| Param | Original file | Final file |
|---|---|---|
| Filename | modeM0/AS1A13_024T03_9000006064_45291cztM0_level2.fits | modeM0/AS1A13_024T03_9000006064_45291cztM0_level2_quad_clean.evt |
| Size (bytes) | 507,193,920 | 113,025,600 |
| Size | 483.7 MB | 107.8 MB |
| Events in quadrant A | 5,729,774 | 764,513 |
| Events in quadrant B | 3,487,655 | 792,359 |
| Events in quadrant C | 3,842,017 | 734,530 |
| Events in quadrant D | 5,158,040 | 630,459 |
| Mode M0 | |||
|---|---|---|---|
| Quadrant | BADHDUFLAG | Total packets | Discarded packets |
| A | 0 | 21880 | 0 |
| B | 0 | 15229 | 0 |
| C | 0 | 16610 | 0 |
| D | 0 | 20394 | 0 |
| Mode SS | |||
|---|---|---|---|
| Quadrant | BADHDUFLAG | Total packets | Discarded packets |
| A | 0 | 144 | 0 |
| B | 0 | 144 | 0 |
| C | 0 | 144 | 0 |
| D | 0 | 144 | 0 |
| Quadrant | Total seconds | Saturated seconds | Saturation percentage |
|---|---|---|---|
| A | 7180 | 27 | 0.376045% |
| B | 7181 | 48 | 0.668431% |
| C | 7180 | 156 | 2.172702% |
| D | 7180 | 598 | 8.328691% |
Noise dominated data is calculated using 1-second bins in cleaned event files. If a bin has >2000 counts, and if more than 50% of those come from <1% of pixels, then it is considered to be noise-dominated and hence unusable.
| Quadrant | # 1 sec bins | Bins with >0 counts | Bins with >2000 counts | High rate bins dominated by noise | Noise dominated (total time) | Noise dominated (detector-on time) | Marked lightcurve |
|---|---|---|---|---|---|---|---|
| A | 7180 | 7180 | 4 | 4 | 0.06% | 0.06% | 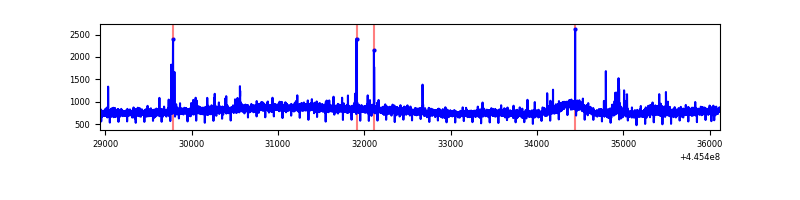 |
| B | 7181 | 7181 | 18 | 18 | 0.25% | 0.25% | 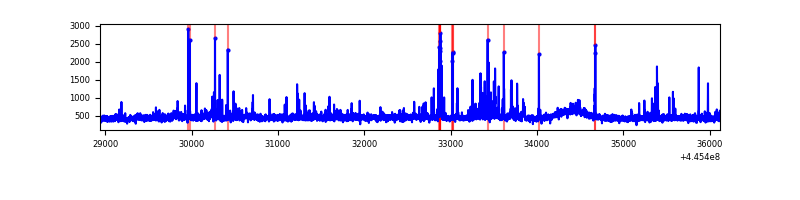 |
| C | 7180 | 7180 | 112 | 112 | 1.56% | 1.56% | 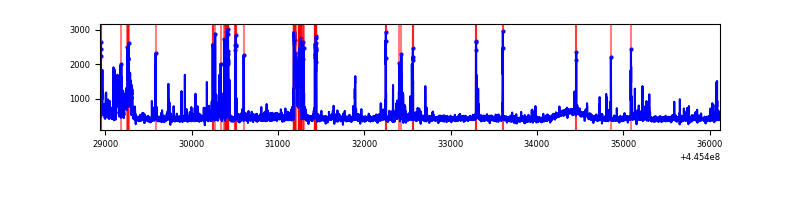 |
| D | 7180 | 7180 | 599 | 599 | 8.34% | 8.34% | 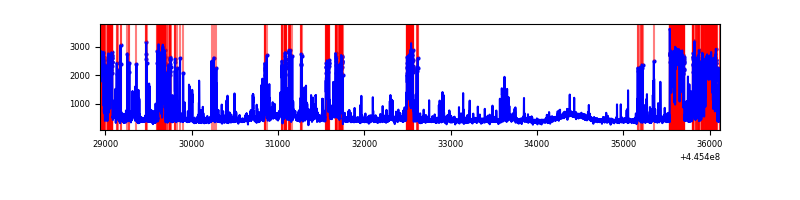 |
Top three noisy pixels from each quadrant. If the there are fewer than three noisy pixels in the level2.evt file, extra rows are filled as -1
| Pixel properties | Quadrant properties | ||||||
|---|---|---|---|---|---|---|---|
| Quadrant | DetID | PixID | Counts | Sigma | Mean | Median | Sigma |
| A | 10 | 83 | 2559807 | 15382.67 | 794 | 776 | 166.4 |
| A | 13 | 248 | 43611 | 257.48 | 794 | 776 | 166.4 |
| A | 10 | 248 | 40392 | 238.13 | 794 | 776 | 166.4 |
| B | 5 | 172 | 65809 | 413.66 | 793 | 770 | 157.2 |
| B | 5 | 32 | 50047 | 313.41 | 793 | 770 | 157.2 |
| B | 3 | 112 | 40590 | 253.26 | 793 | 770 | 157.2 |
| C | 14 | 254 | 697984 | 3873.41 | 762 | 766 | 180.0 |
| C | 3 | 233 | 122676 | 677.27 | 762 | 766 | 180.0 |
| C | 2 | 14 | 29055 | 157.16 | 762 | 766 | 180.0 |
| D | 2 | 249 | 996581 | 5287.62 | 743 | 718 | 188.3 |
| D | 13 | 249 | 678931 | 3601.03 | 743 | 718 | 188.3 |
| D | 13 | 29 | 198964 | 1052.6 | 743 | 718 | 188.3 |
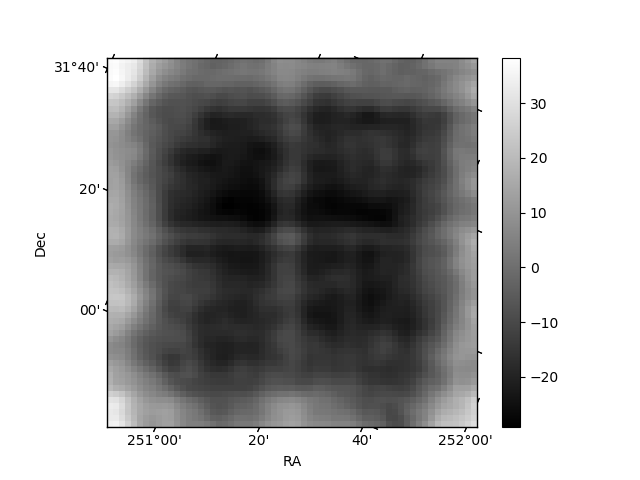
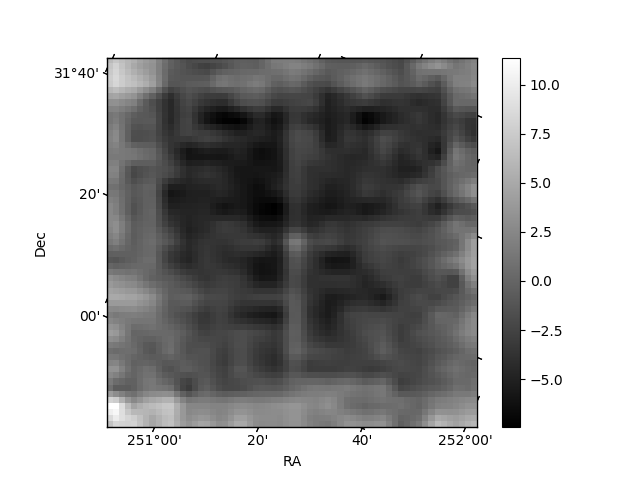
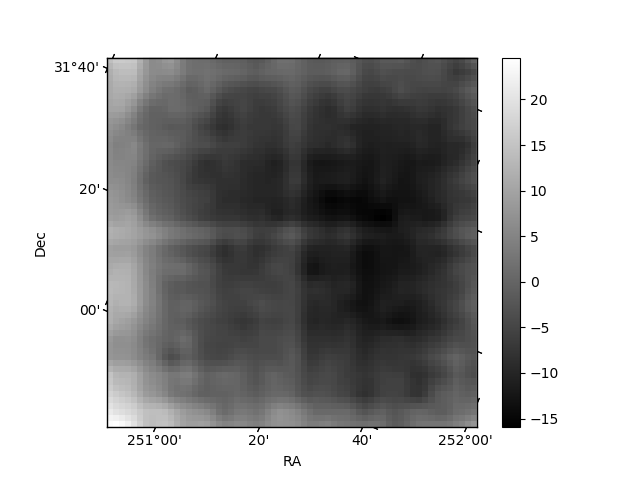
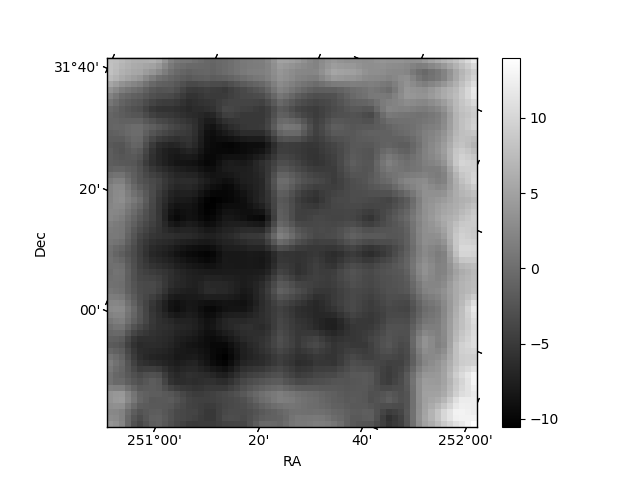
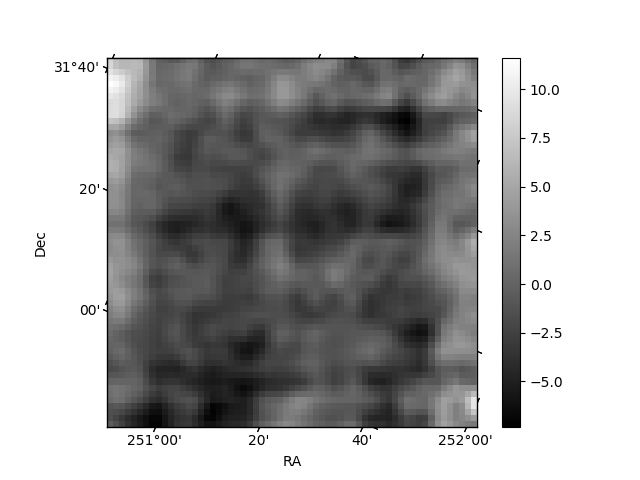
Histogram calculated using DETX and DETY for each event in the final _common_clean file
| Quadrant A | 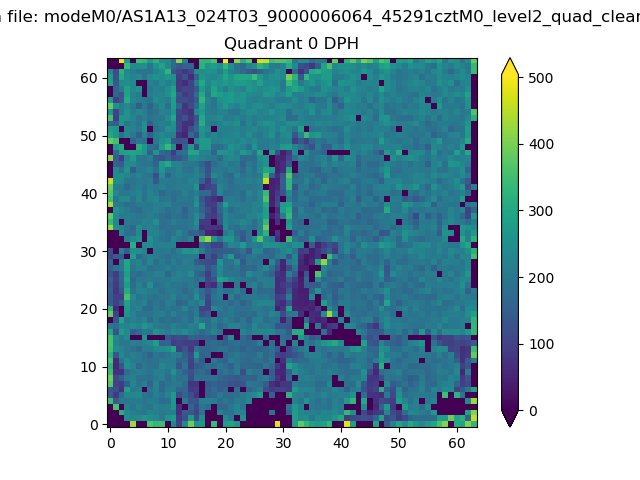 |
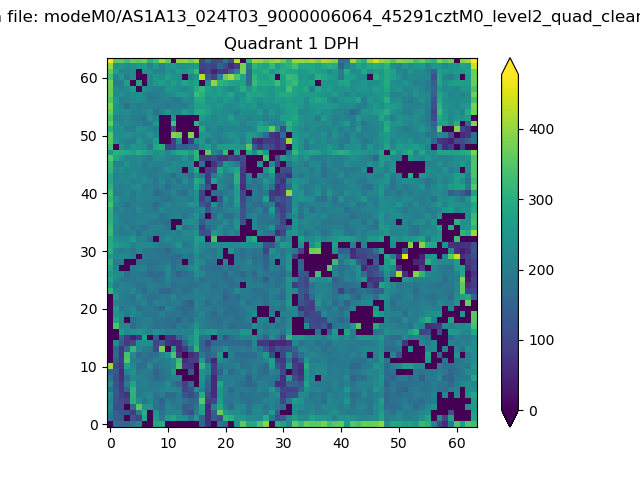 |
Quadrant B |
|---|---|---|---|
| Quadrant D | 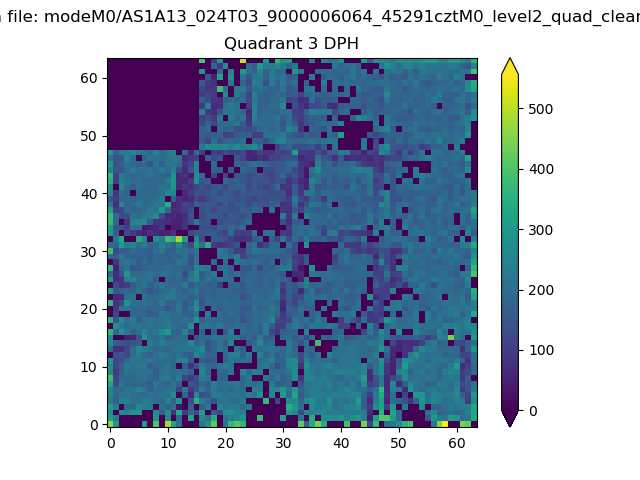 |
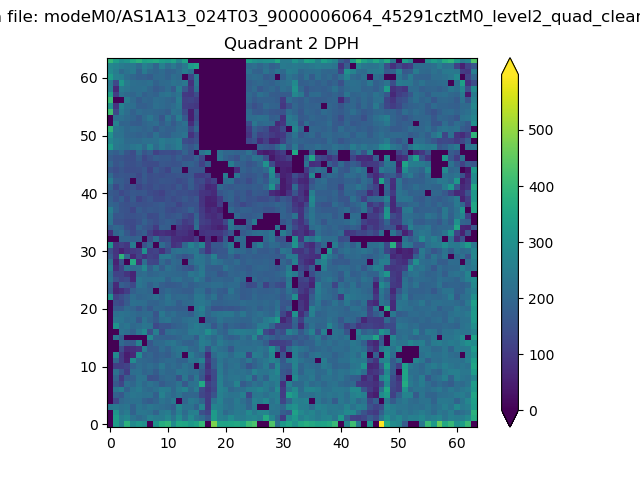 |
Quadrant C |
| Plot type | Count rate plots | Images |
|---|---|---|
| Comparison with Poisson distribution Blue bars denote a histogram of data divided into 1 sec bins. Red curve is a Poisson curve with rate = median count rate of data. |
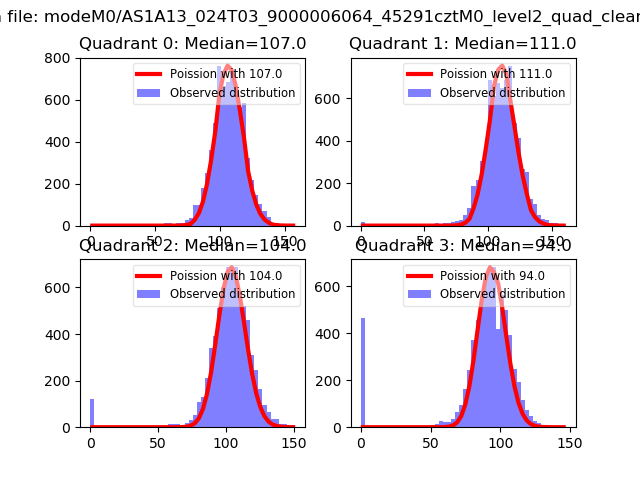 |
 |
| Quadrant-wise count rates Data is divided into 100 sec bins |
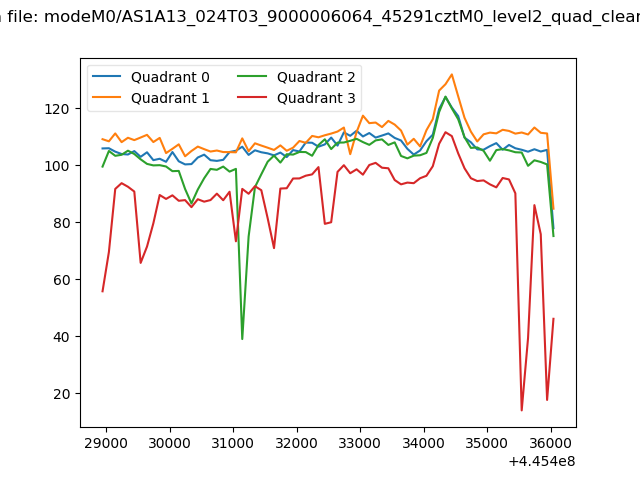 |
|
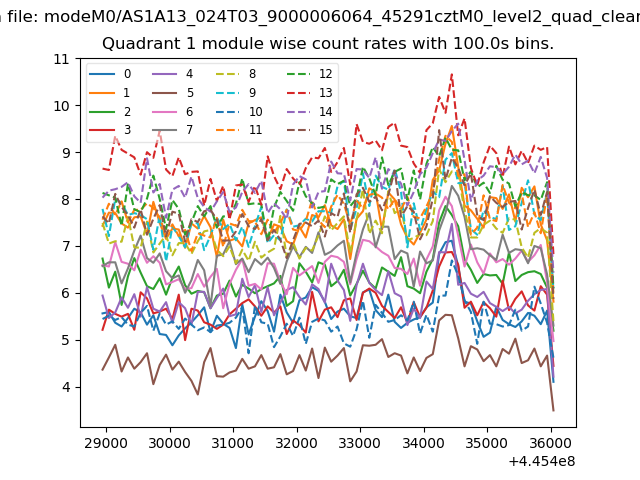
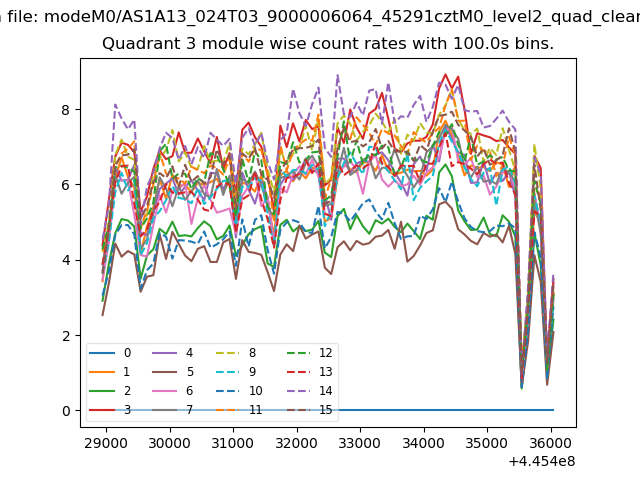
| Module-wise count rates for Quadrant A Data is divided into 100 sec bins |
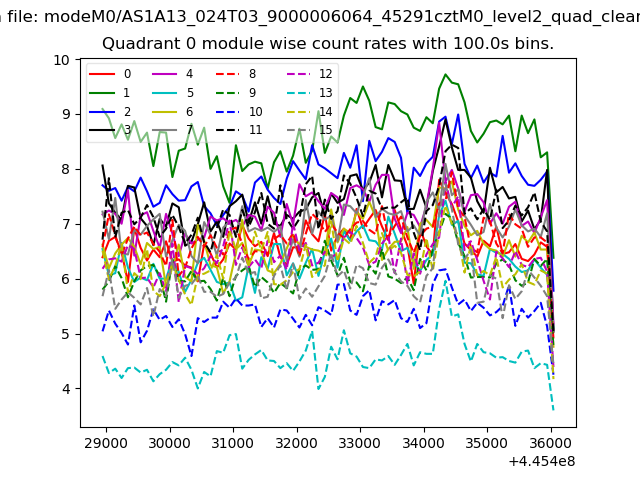 |
 |
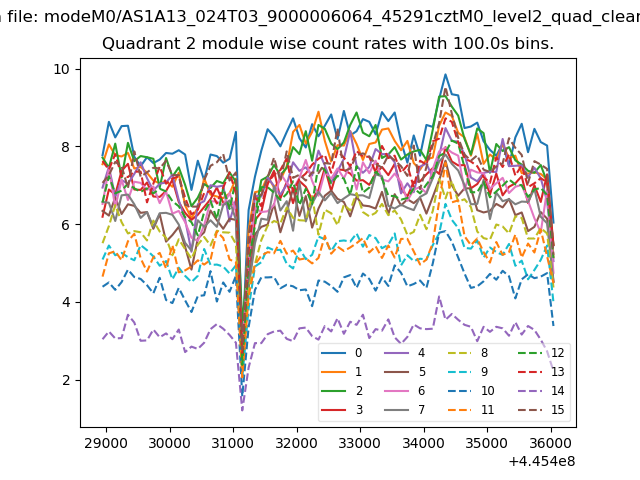
| Module-wise count rates for Quadrant B Data is divided into 100 sec bins |
 |
 |
| Module-wise count rates for Quadrant C Data is divided into 100 sec bins |
 |
 |
| Module-wise count rates for Quadrant D Data is divided into 100 sec bins |
 |
 |
| Parameter | Plot |
|---|---|
| CZT HV Monitor | 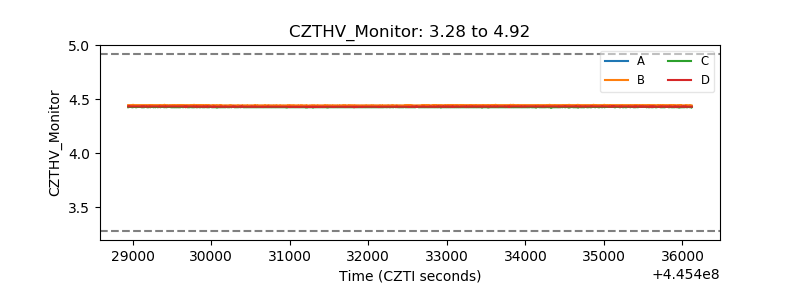 |
| D_VDD | 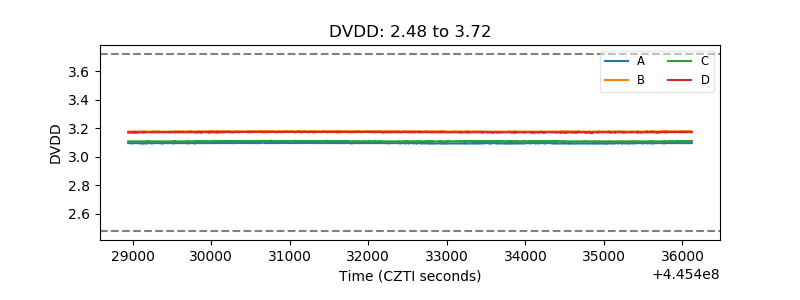 |
| Temperature 1 | 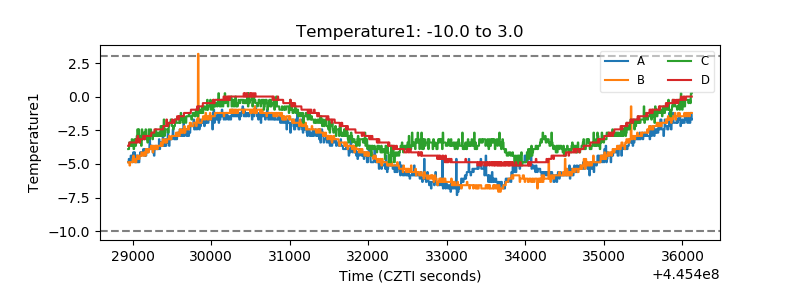 |
| Veto HV Monitor | 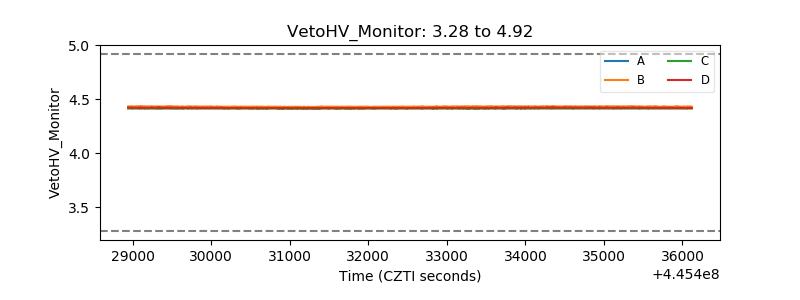 |
| Veto LLD | 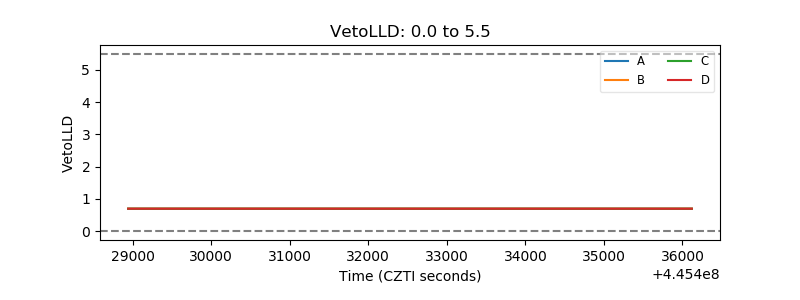 |
| Alpha Counter | 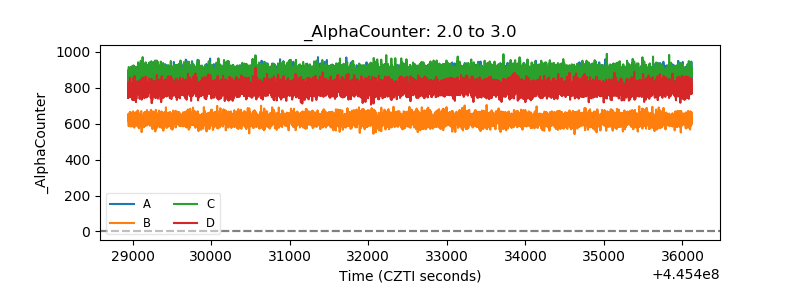 |
| _CPM_Rate | 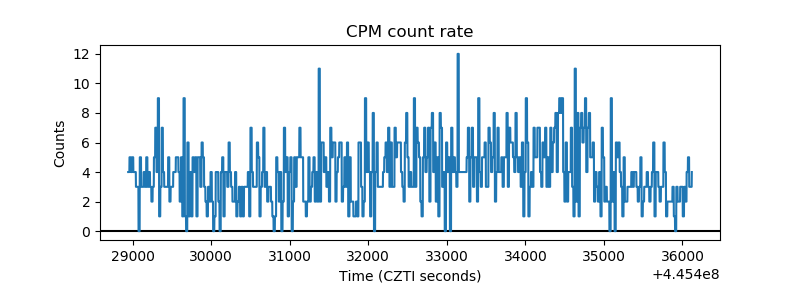 |
| CZT Counter | 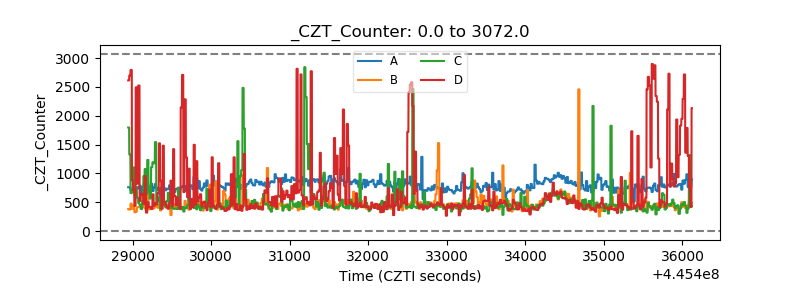 |
| +2.5 Volts monitor | 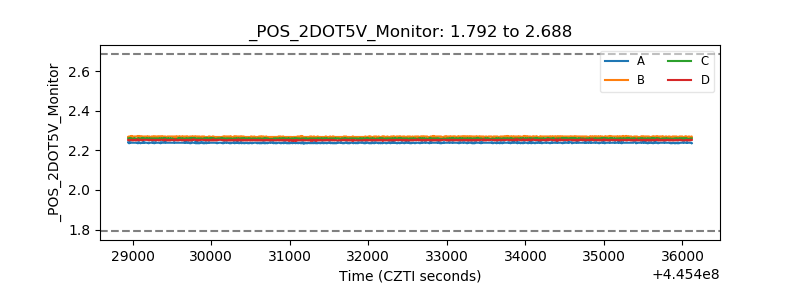 |
| +5 Volts monitor | 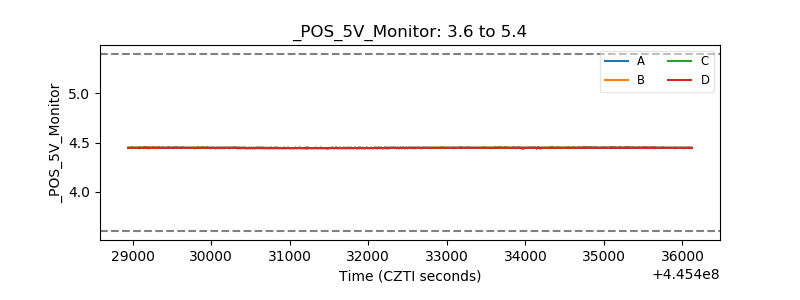 |
| _ROLL_ROT | 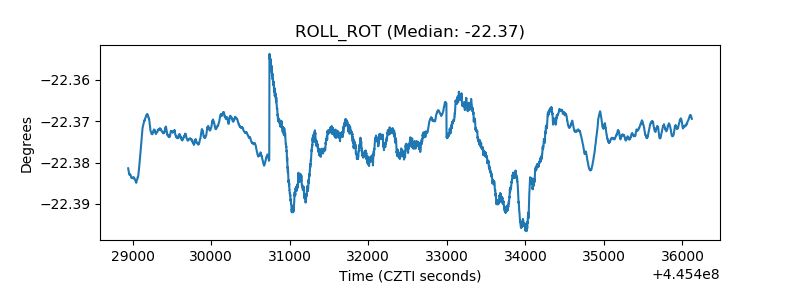 |
| _Roll_DEC | 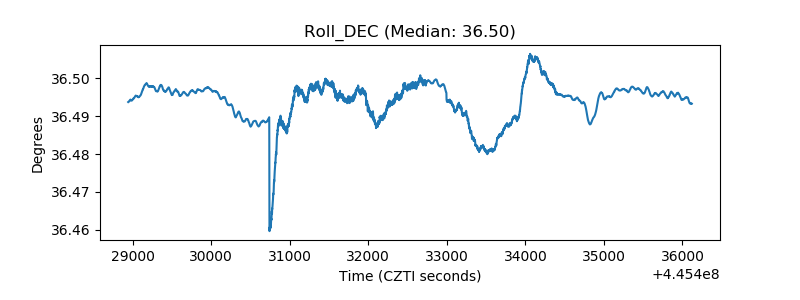 |
| _Roll_RA | 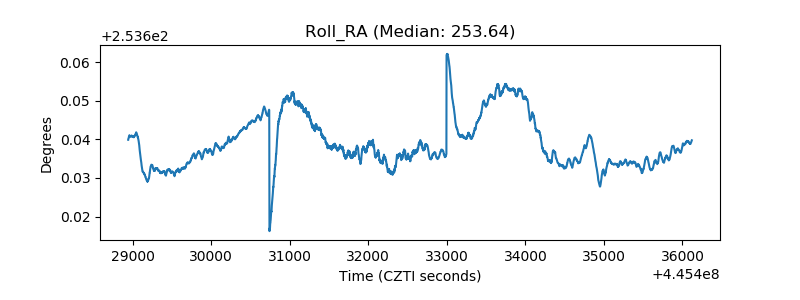 |
| Veto Counter | 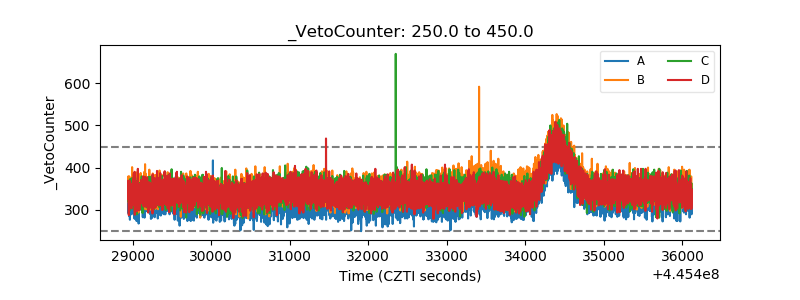 |