| Param | Original file | Final file |
|---|---|---|
| Filename | modeM0/AS1A13_073T04_9000006066_45294cztM0_level2.fits | modeM0/AS1A13_073T04_9000006066_45294cztM0_level2_quad_clean.evt |
| Size (bytes) | 1,040,774,400 | 225,679,680 |
| Size | 992.6 MB | 215.2 MB |
| Events in quadrant A | 11,729,229 | 1,488,589 |
| Events in quadrant B | 7,681,795 | 1,520,092 |
| Events in quadrant C | 7,206,743 | 1,515,609 |
| Events in quadrant D | 10,796,002 | 1,315,915 |
| Mode SS | |||
|---|---|---|---|
| Quadrant | BADHDUFLAG | Total packets | Discarded packets |
| A | 0 | 290 | 0 |
| B | 0 | 290 | 0 |
| C | 0 | 290 | 0 |
| D | 0 | 290 | 0 |
| Mode M9 | |||
|---|---|---|---|
| Quadrant | BADHDUFLAG | Total packets | Discarded packets |
| A | 0 | 12 | 0 |
| B | 0 | 12 | 0 |
| C | 0 | 12 | 0 |
| D | 0 | 12 | 0 |
| Mode M0 | |||
|---|---|---|---|
| Quadrant | BADHDUFLAG | Total packets | Discarded packets |
| A | 0 | 45157 | 2 |
| B | 0 | 33049 | 2 |
| C | 0 | 31925 | 2 |
| D | 0 | 42125 | 2 |
| Quadrant | Total seconds | Saturated seconds | Saturation percentage |
|---|---|---|---|
| A | 14376 | 466 | 3.241514% |
| B | 14376 | 621 | 4.319699% |
| C | 14376 | 262 | 1.822482% |
| D | 14375 | 1079 | 7.506087% |
Noise dominated data is calculated using 1-second bins in cleaned event files. If a bin has >2000 counts, and if more than 50% of those come from <1% of pixels, then it is considered to be noise-dominated and hence unusable.
| Quadrant | # 1 sec bins | Bins with >0 counts | Bins with >2000 counts | High rate bins dominated by noise | Noise dominated (total time) | Noise dominated (detector-on time) | Marked lightcurve |
|---|---|---|---|---|---|---|---|
| A | 15501 | 14377 | 60 | 60 | 0.39% | 0.42% | 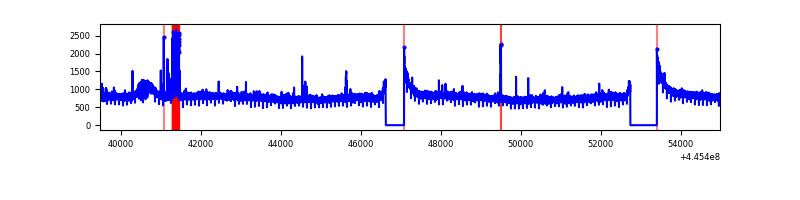 |
| B | 15501 | 14376 | 254 | 254 | 1.64% | 1.77% | 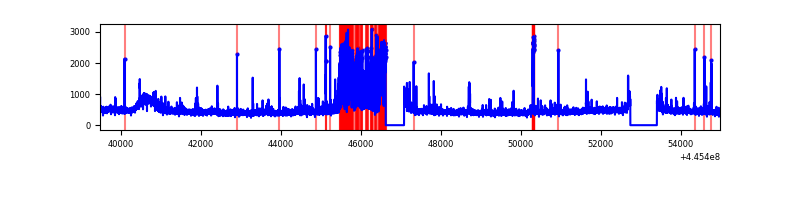 |
| C | 15501 | 14377 | 154 | 154 | 0.99% | 1.07% | 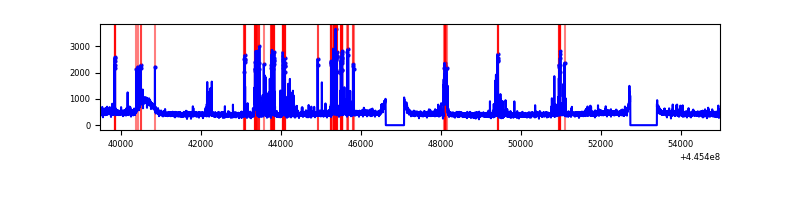 |
| D | 15500 | 14376 | 839 | 839 | 5.41% | 5.84% | 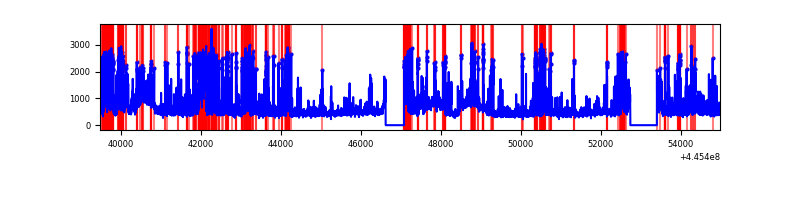 |
Top three noisy pixels from each quadrant. If the there are fewer than three noisy pixels in the level2.evt file, extra rows are filled as -1
| Pixel properties | Quadrant properties | ||||||
|---|---|---|---|---|---|---|---|
| Quadrant | DetID | PixID | Counts | Sigma | Mean | Median | Sigma |
| A | 10 | 83 | 5165997 | 15226.43 | 1624 | 1585 | 339.2 |
| A | 13 | 248 | 209666 | 613.49 | 1624 | 1585 | 339.2 |
| A | 10 | 248 | 40297 | 114.14 | 1624 | 1585 | 339.2 |
| B | 5 | 32 | 1053119 | 3366.03 | 1606 | 1555 | 312.4 |
| B | 0 | 189 | 70536 | 220.81 | 1606 | 1555 | 312.4 |
| B | 12 | 111 | 40950 | 126.1 | 1606 | 1555 | 312.4 |
| C | 14 | 254 | 753728 | 1986.42 | 1606 | 1613 | 378.6 |
| C | 2 | 14 | 128504 | 335.13 | 1606 | 1613 | 378.6 |
| C | 3 | 233 | 44586 | 113.5 | 1606 | 1613 | 378.6 |
| D | 2 | 249 | 2695467 | 6786.24 | 1573 | 1525 | 397.0 |
| D | 13 | 249 | 1102453 | 2773.32 | 1573 | 1525 | 397.0 |
| D | 12 | 233 | 280547 | 702.88 | 1573 | 1525 | 397.0 |
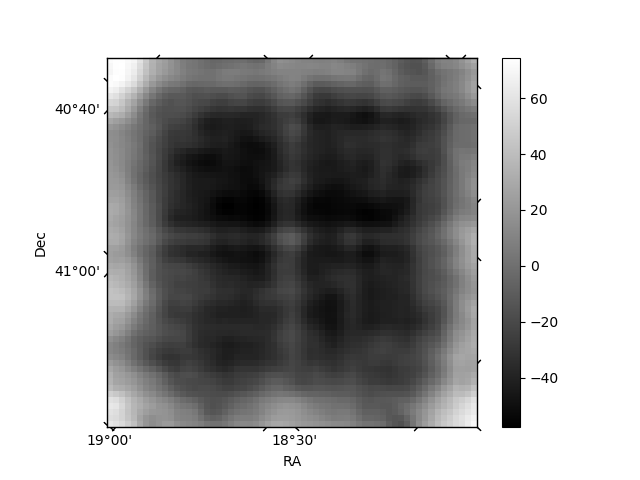
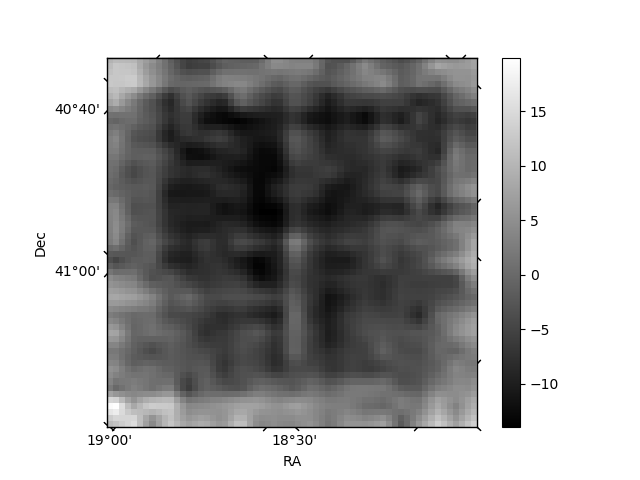
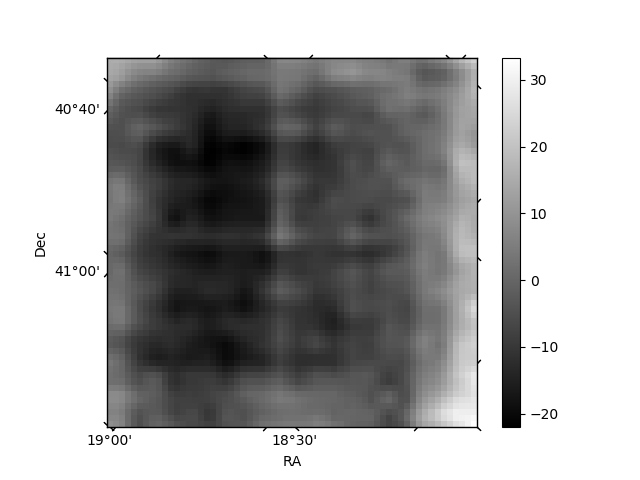
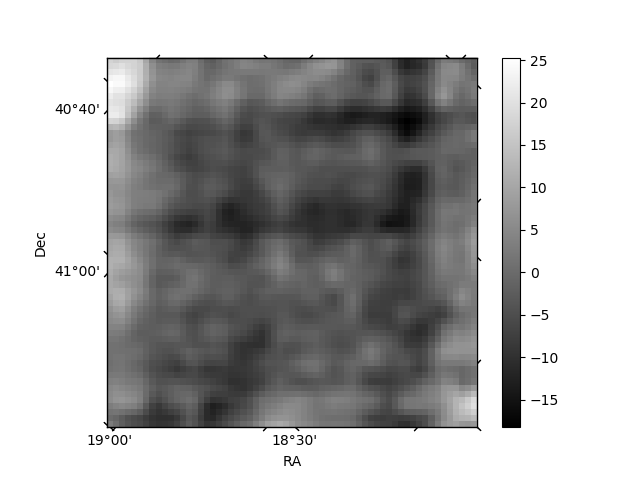
Histogram calculated using DETX and DETY for each event in the final _common_clean file
| Quadrant A | 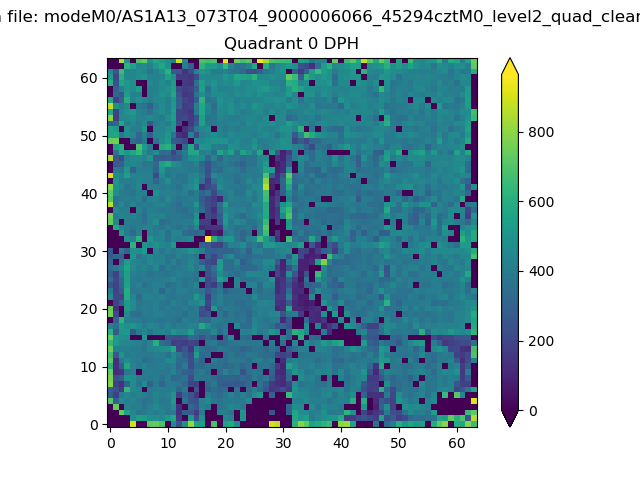 |
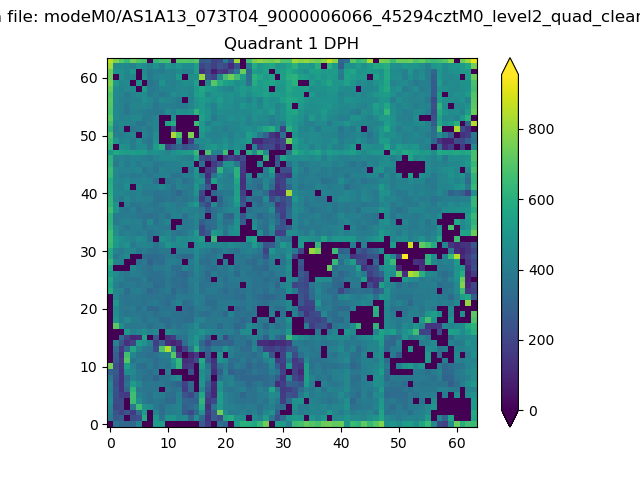 |
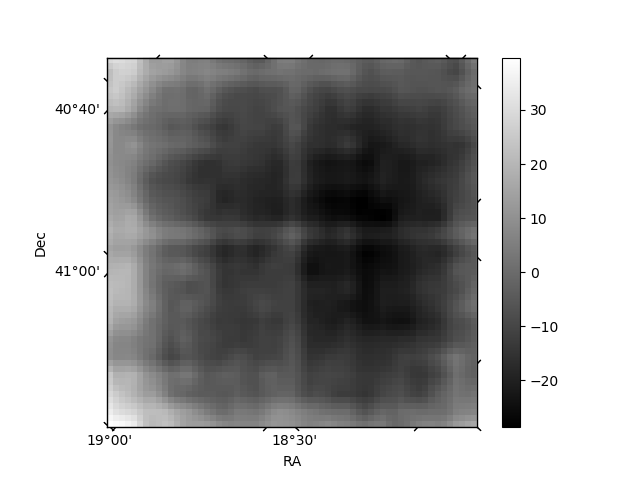
Quadrant B |
|---|---|---|---|
| Quadrant D | 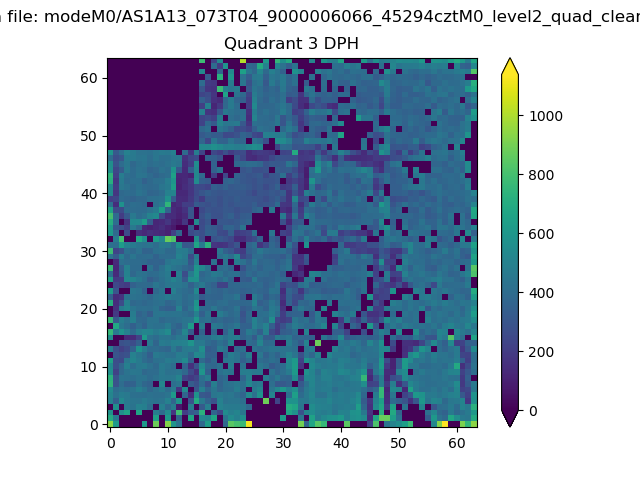 |
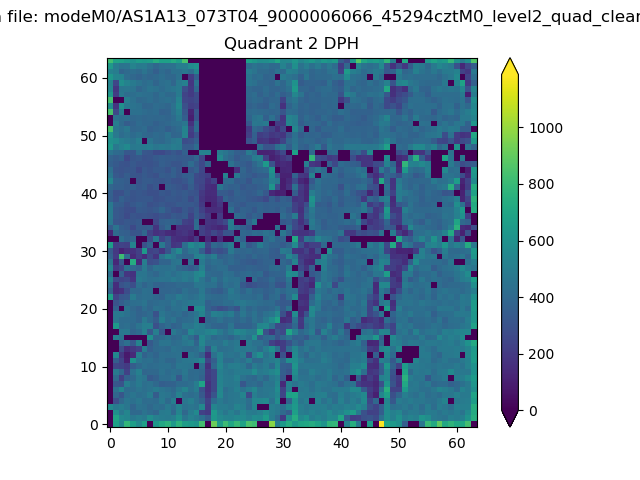 |
Quadrant C |
| Plot type | Count rate plots | Images |
|---|---|---|
| Comparison with Poisson distribution Blue bars denote a histogram of data divided into 1 sec bins. Red curve is a Poisson curve with rate = median count rate of data. |
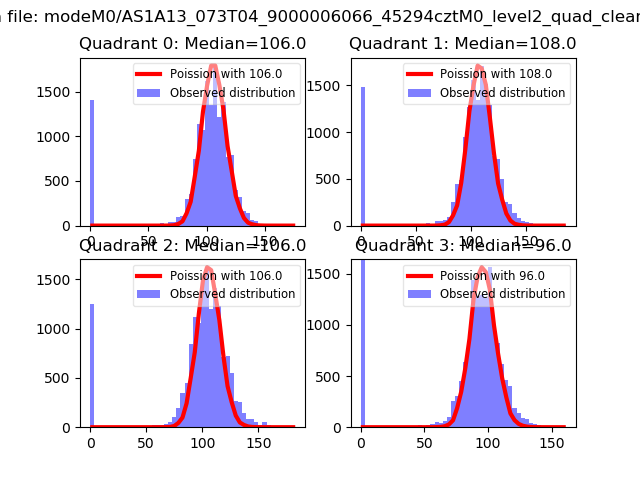 |
 |
| Quadrant-wise count rates Data is divided into 100 sec bins |
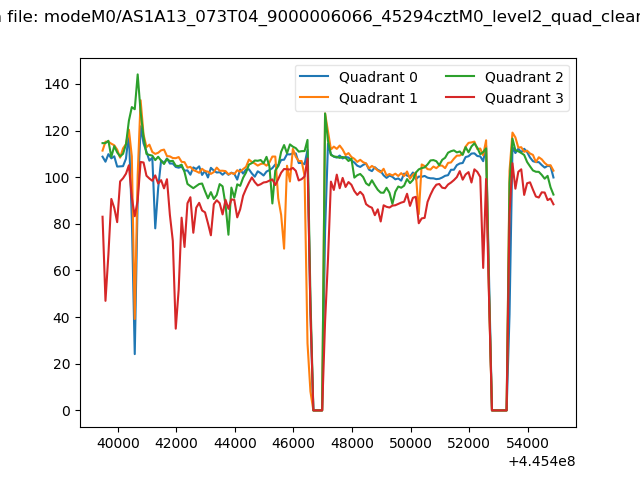 |
|
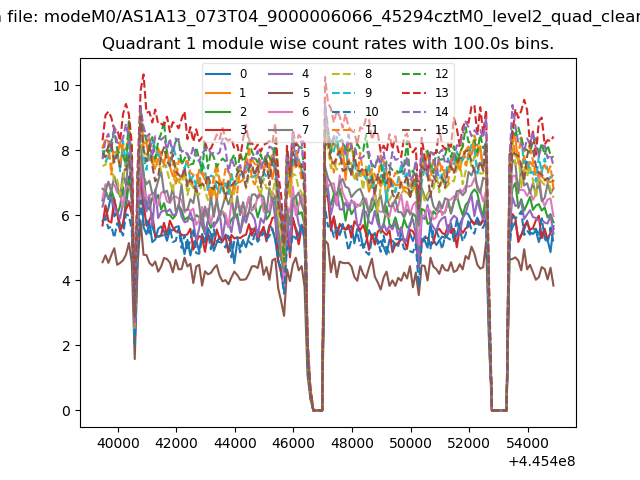
| Module-wise count rates for Quadrant A Data is divided into 100 sec bins |
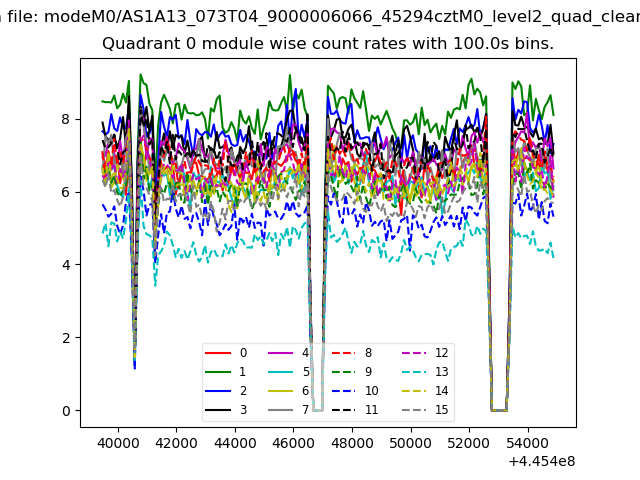 |
 |
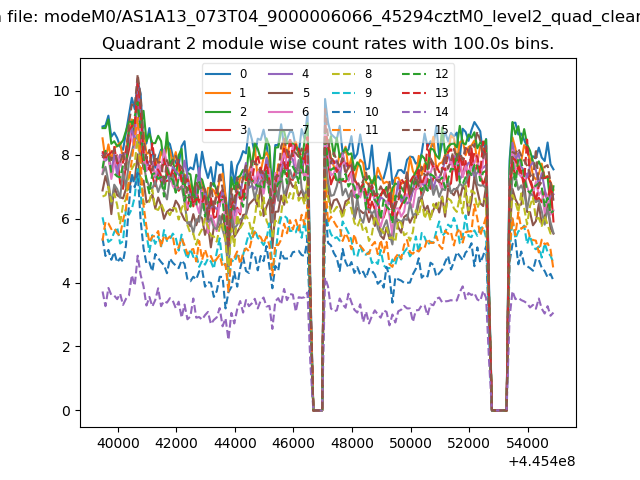
| Module-wise count rates for Quadrant B Data is divided into 100 sec bins |
 |
 |
| Module-wise count rates for Quadrant C Data is divided into 100 sec bins |
 |
 |
| Module-wise count rates for Quadrant D Data is divided into 100 sec bins |
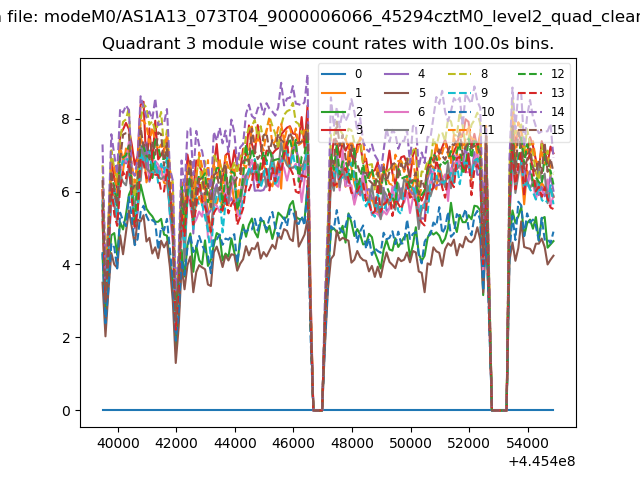 |
 |
| Parameter | Plot |
|---|---|
| CZT HV Monitor | 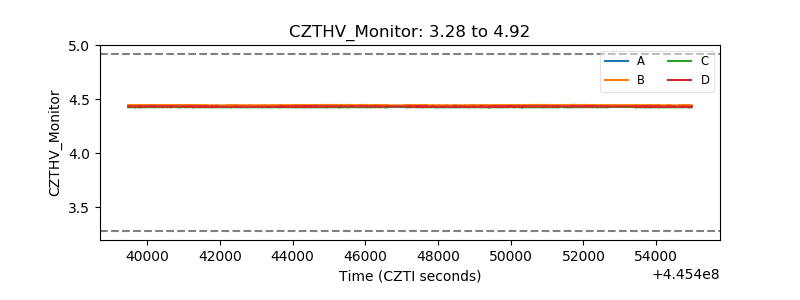 |
| D_VDD | 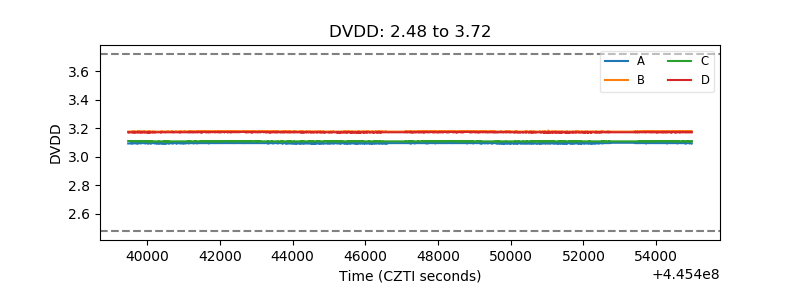 |
| Temperature 1 | 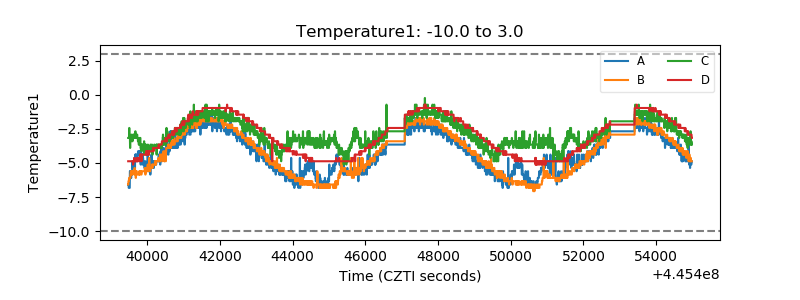 |
| Veto HV Monitor | 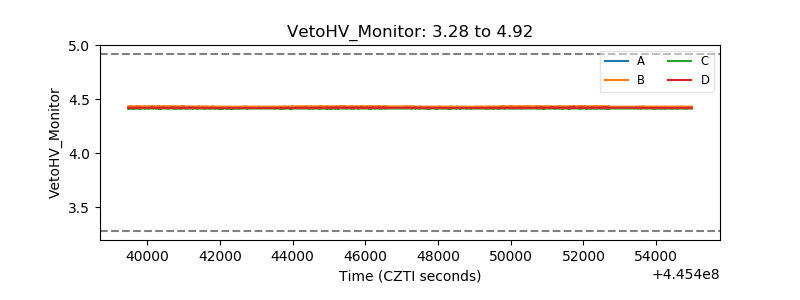 |
| Veto LLD | 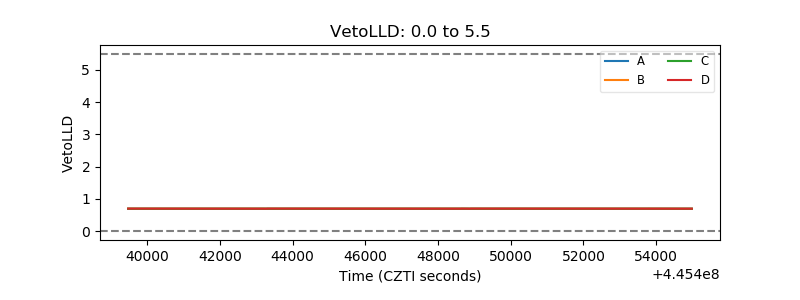 |
| Alpha Counter | 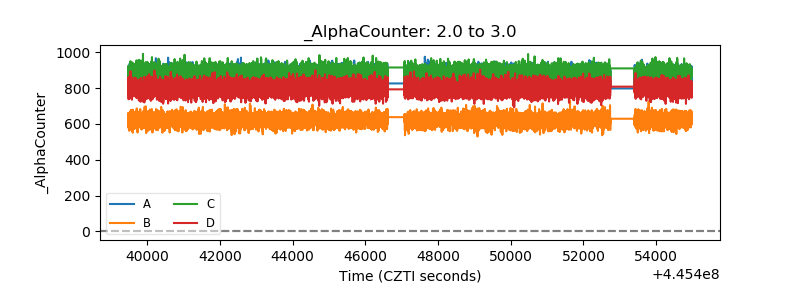 |
| _CPM_Rate | 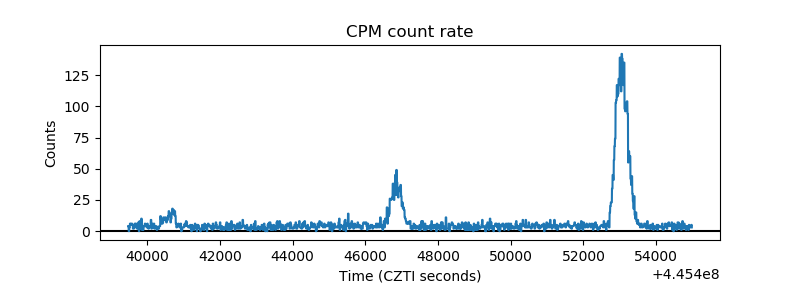 |
| CZT Counter | 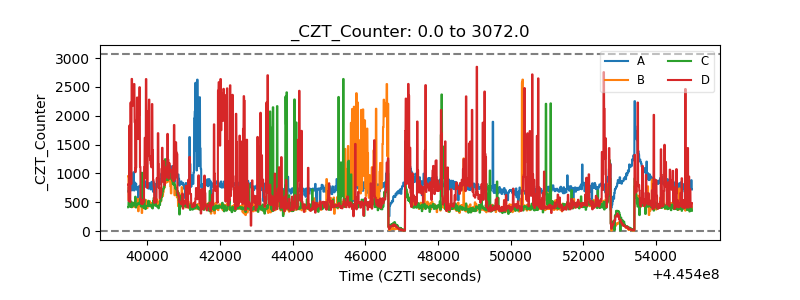 |
| +2.5 Volts monitor | 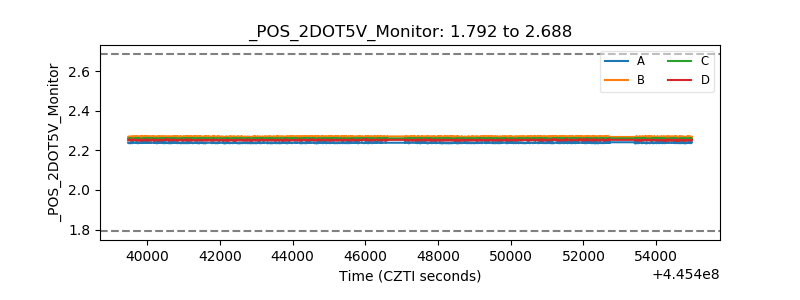 |
| +5 Volts monitor |  |
| _ROLL_ROT | 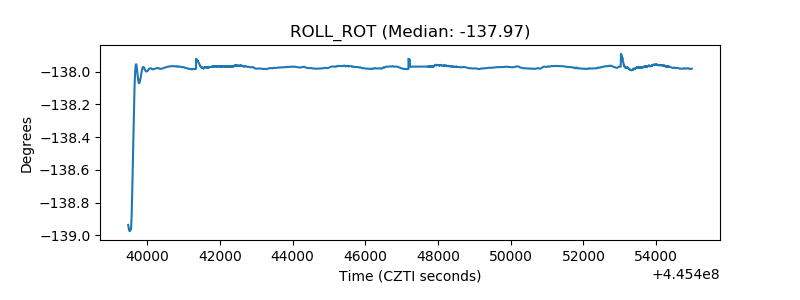 |
| _Roll_DEC | 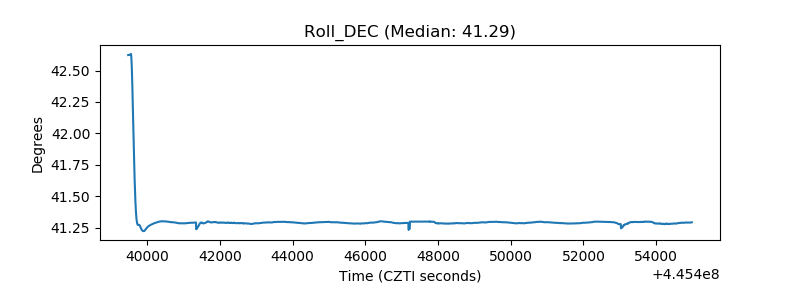 |
| _Roll_RA | 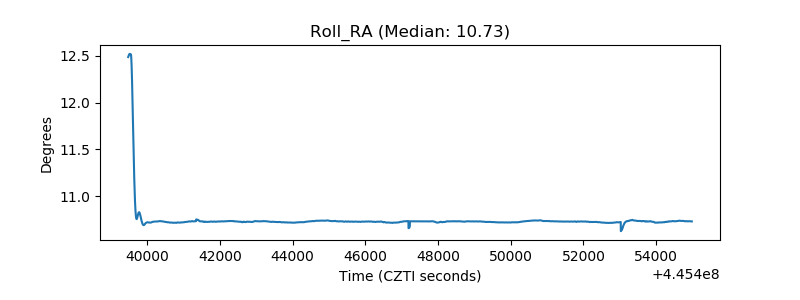 |
| Veto Counter | 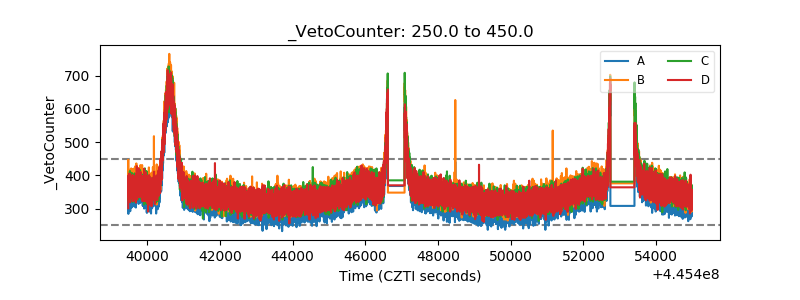 |