| Param | Original file | Final file |
|---|---|---|
| Filename | modeM0/AS1A13_073T04_9000006066_45295cztM0_level2.fits | modeM0/AS1A13_073T04_9000006066_45295cztM0_level2_quad_clean.evt |
| Size (bytes) | 451,042,560 | 102,850,560 |
| Size | 430.1 MB | 98.1 MB |
| Events in quadrant A | 5,493,887 | 674,480 |
| Events in quadrant B | 3,064,826 | 706,600 |
| Events in quadrant C | 3,405,213 | 663,139 |
| Events in quadrant D | 4,229,024 | 617,776 |
| Mode SS | |||
|---|---|---|---|
| Quadrant | BADHDUFLAG | Total packets | Discarded packets |
| A | 0 | 132 | 0 |
| B | 0 | 132 | 0 |
| C | 0 | 132 | 0 |
| D | 0 | 132 | 0 |
| Mode M9 | |||
|---|---|---|---|
| Quadrant | BADHDUFLAG | Total packets | Discarded packets |
| A | 0 | 8 | 0 |
| B | 0 | 8 | 0 |
| C | 0 | 8 | 0 |
| D | 0 | 8 | 0 |
| Mode M0 | |||
|---|---|---|---|
| Quadrant | BADHDUFLAG | Total packets | Discarded packets |
| A | 0 | 21141 | 1 |
| B | 0 | 13724 | 1 |
| C | 0 | 14889 | 1 |
| D | 0 | 17087 | 1 |
| Quadrant | Total seconds | Saturated seconds | Saturation percentage |
|---|---|---|---|
| A | 6477 | 199 | 3.072410% |
| B | 6478 | 61 | 0.941649% |
| C | 6478 | 211 | 3.257178% |
| D | 6478 | 186 | 2.871257% |
Noise dominated data is calculated using 1-second bins in cleaned event files. If a bin has >2000 counts, and if more than 50% of those come from <1% of pixels, then it is considered to be noise-dominated and hence unusable.
| Quadrant | # 1 sec bins | Bins with >0 counts | Bins with >2000 counts | High rate bins dominated by noise | Noise dominated (total time) | Noise dominated (detector-on time) | Marked lightcurve |
|---|---|---|---|---|---|---|---|
| A | 7342 | 6477 | 92 | 92 | 1.25% | 1.42% | 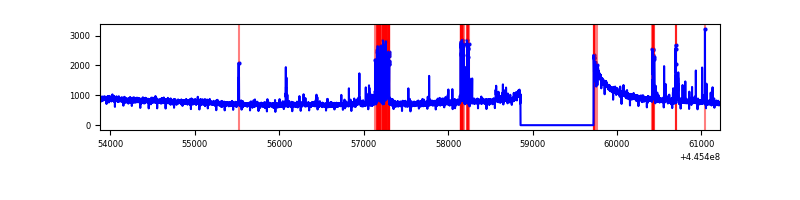 |
| B | 7343 | 6478 | 25 | 25 | 0.34% | 0.39% | 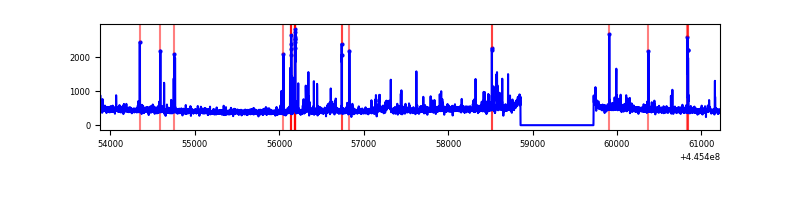 |
| C | 7343 | 6478 | 194 | 194 | 2.64% | 2.99% | 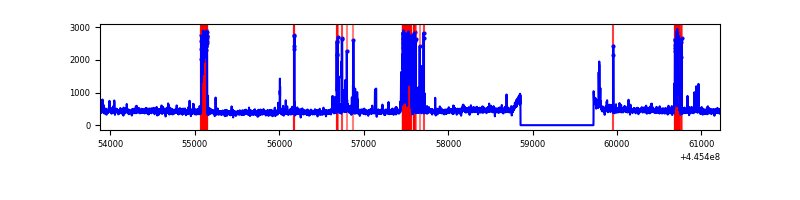 |
| D | 7343 | 6478 | 173 | 173 | 2.36% | 2.67% | 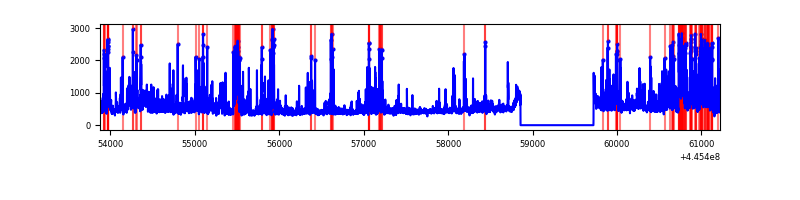 |
Top three noisy pixels from each quadrant. If the there are fewer than three noisy pixels in the level2.evt file, extra rows are filled as -1
| Pixel properties | Quadrant properties | ||||||
|---|---|---|---|---|---|---|---|
| Quadrant | DetID | PixID | Counts | Sigma | Mean | Median | Sigma |
| A | 10 | 83 | 2397394 | 16548.86 | 698 | 683 | 144.8 |
| A | 10 | 248 | 356292 | 2455.42 | 698 | 683 | 144.8 |
| A | 13 | 248 | 16847 | 111.61 | 698 | 683 | 144.8 |
| B | 5 | 32 | 97675 | 707.96 | 704 | 682 | 137.0 |
| B | 5 | 172 | 38077 | 272.95 | 704 | 682 | 137.0 |
| B | 0 | 186 | 37823 | 271.1 | 704 | 682 | 137.0 |
| C | 14 | 254 | 669374 | 4113.29 | 690 | 692 | 162.6 |
| C | 3 | 233 | 17472 | 103.22 | 690 | 692 | 162.6 |
| C | 3 | 160 | 8830 | 50.06 | 690 | 692 | 162.6 |
| D | 2 | 249 | 932358 | 5385.69 | 692 | 672 | 173.0 |
| D | 1 | 52 | 262845 | 1515.51 | 692 | 672 | 173.0 |
| D | 13 | 171 | 171756 | 988.97 | 692 | 672 | 173.0 |
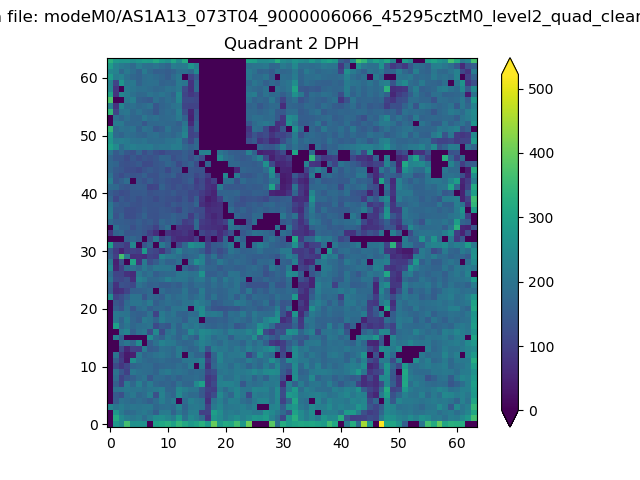
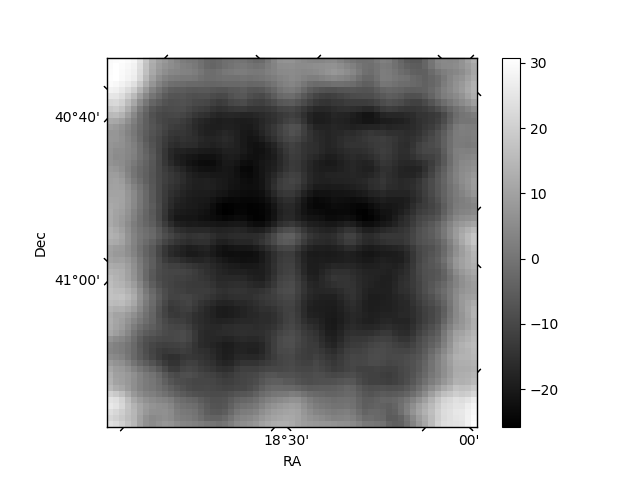
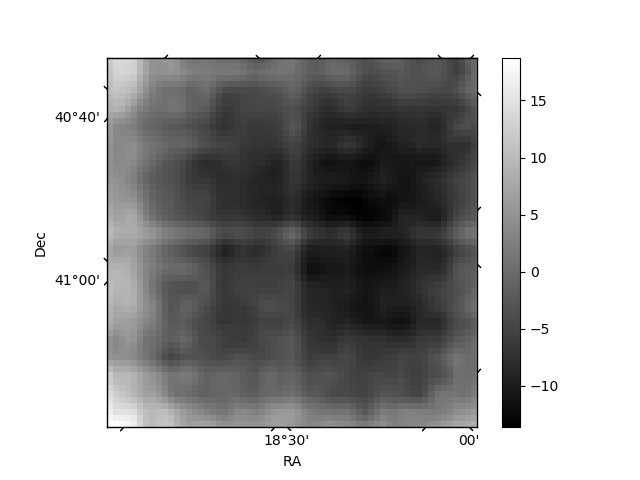
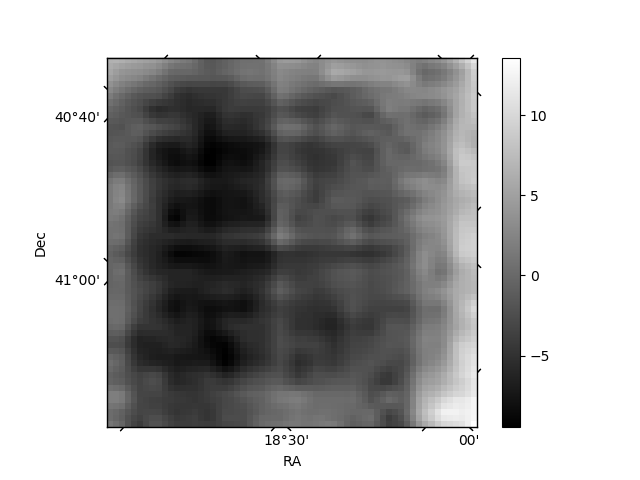
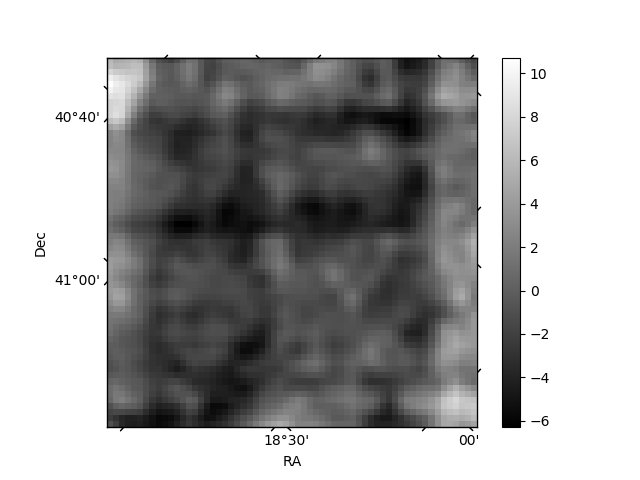
Histogram calculated using DETX and DETY for each event in the final _common_clean file
| Quadrant A | 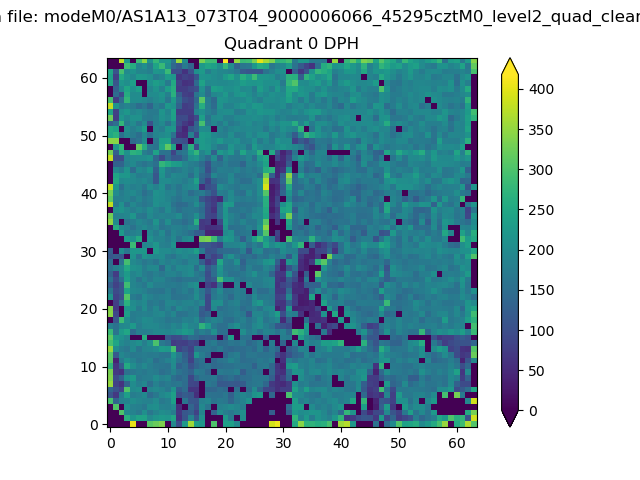 |
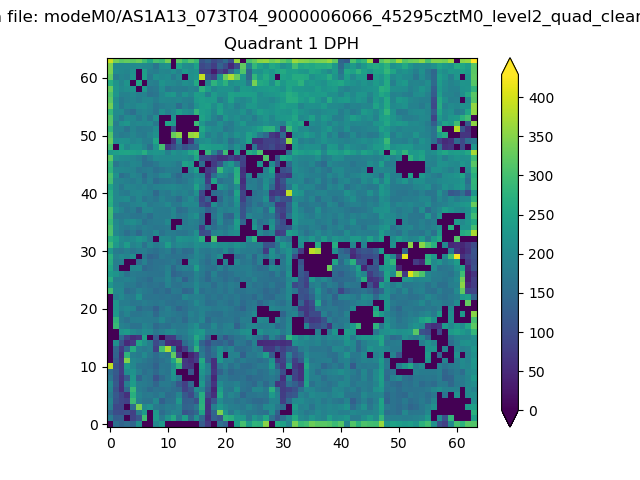 |
Quadrant B |
|---|---|---|---|
| Quadrant D | 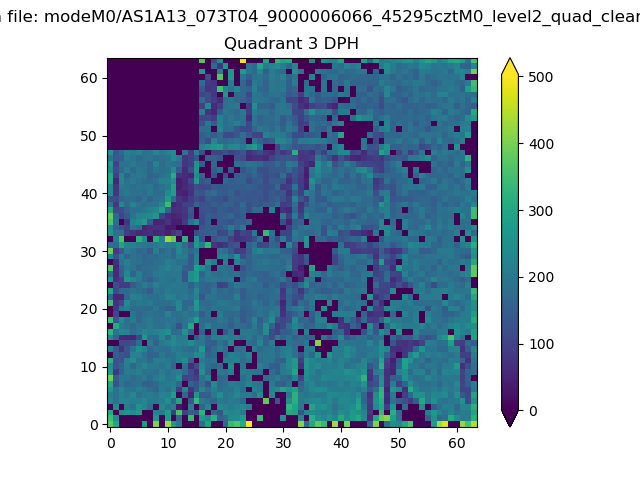 |
 |
Quadrant C |
| Plot type | Count rate plots | Images |
|---|---|---|
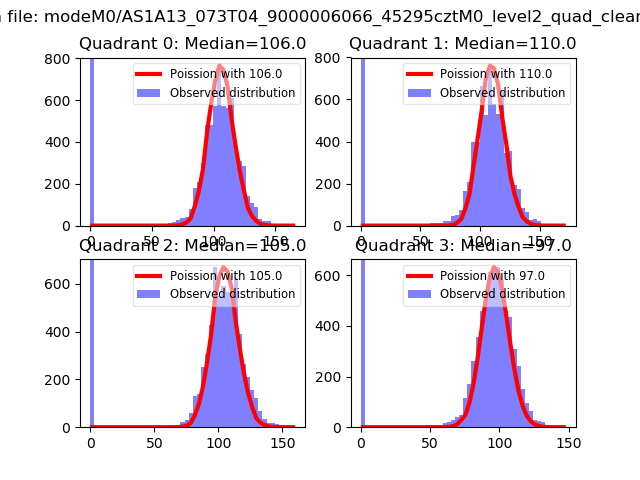
| Comparison with Poisson distribution Blue bars denote a histogram of data divided into 1 sec bins. Red curve is a Poisson curve with rate = median count rate of data. |
 |
 |
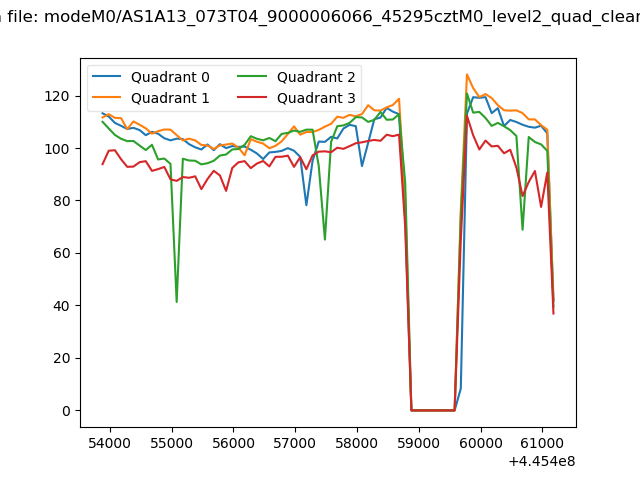
| Quadrant-wise count rates Data is divided into 100 sec bins |
 |
|
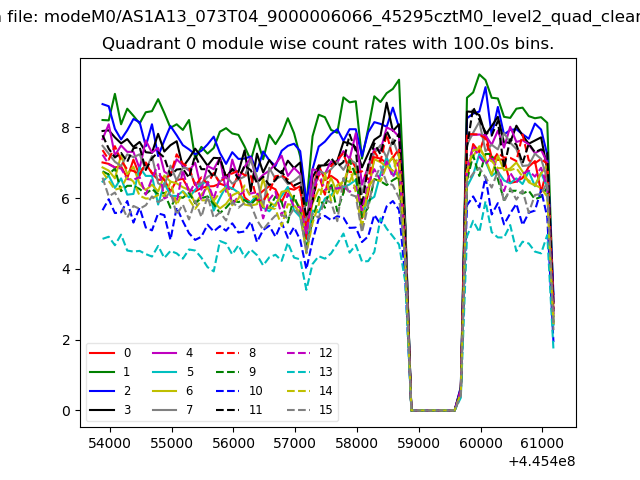
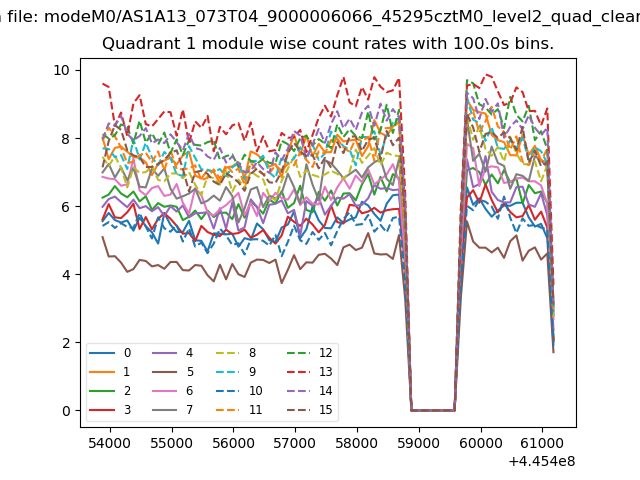
| Module-wise count rates for Quadrant A Data is divided into 100 sec bins |
 |
 |
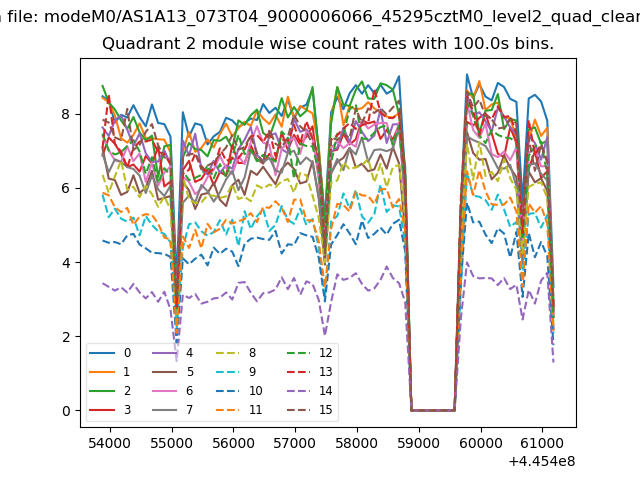
| Module-wise count rates for Quadrant B Data is divided into 100 sec bins |
 |
 |
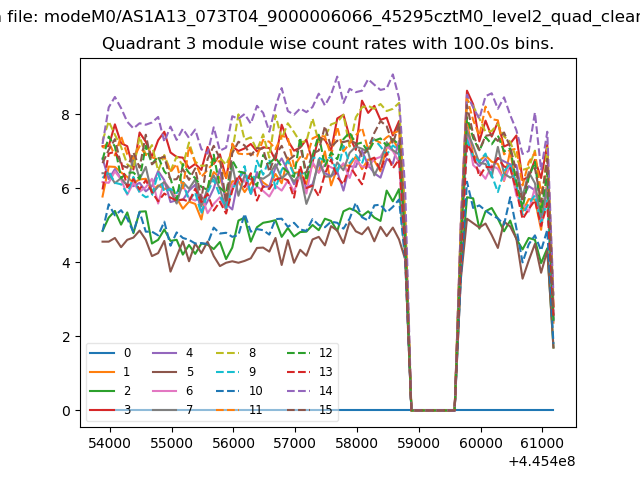
| Module-wise count rates for Quadrant C Data is divided into 100 sec bins |
 |
 |
| Module-wise count rates for Quadrant D Data is divided into 100 sec bins |
 |
 |
| Parameter | Plot |
|---|---|
| CZT HV Monitor |  |
| D_VDD | 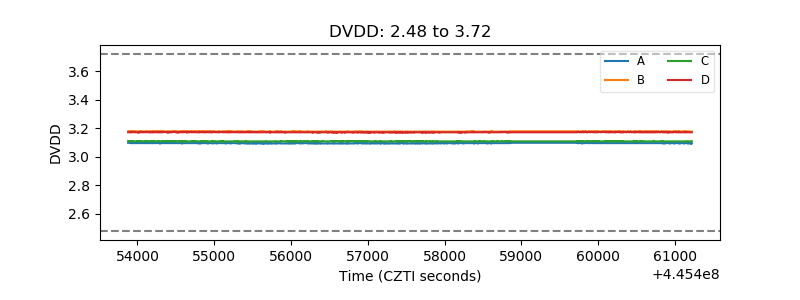 |
| Temperature 1 | 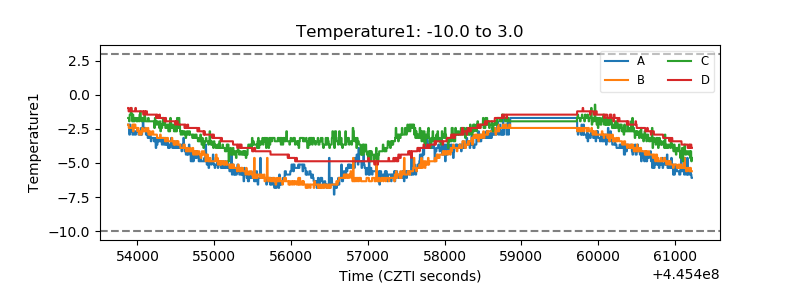 |
| Veto HV Monitor | 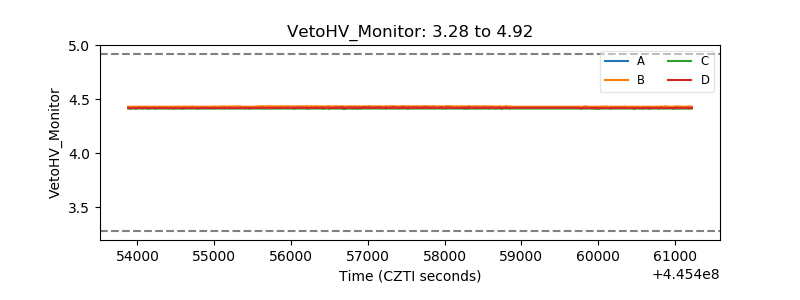 |
| Veto LLD | 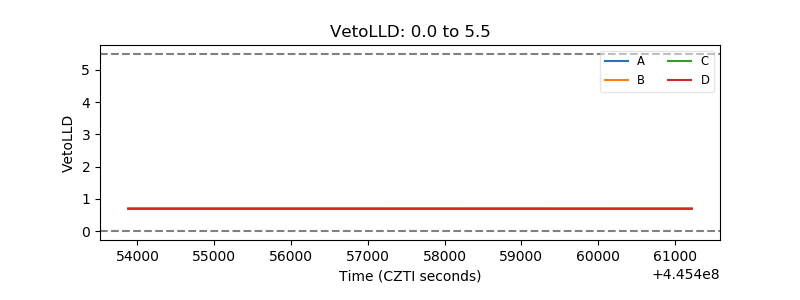 |
| Alpha Counter | 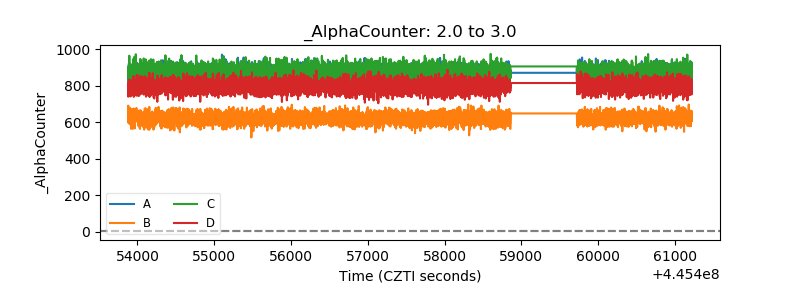 |
| _CPM_Rate | 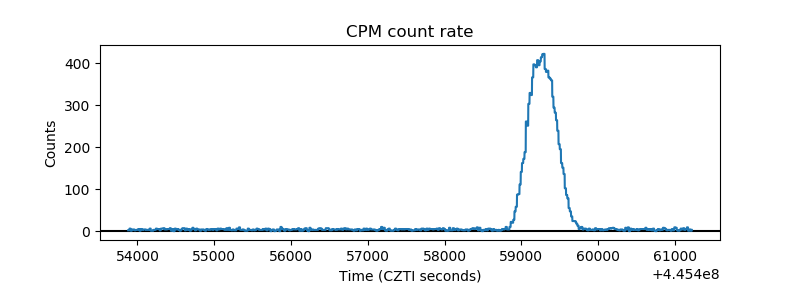 |
| CZT Counter | 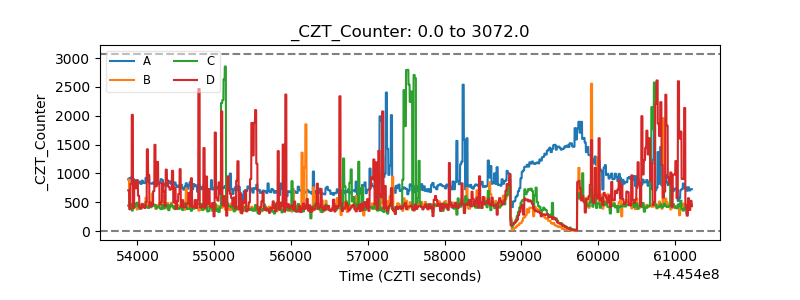 |
| +2.5 Volts monitor | 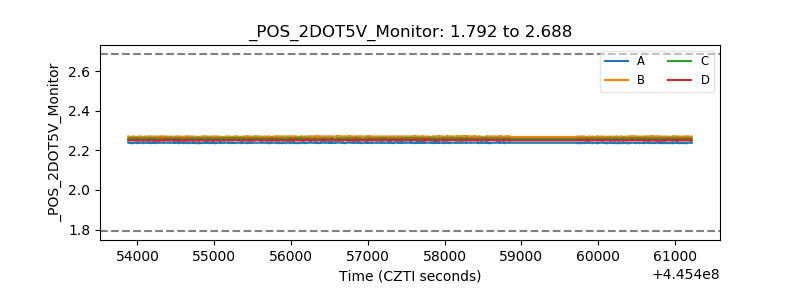 |
| +5 Volts monitor | 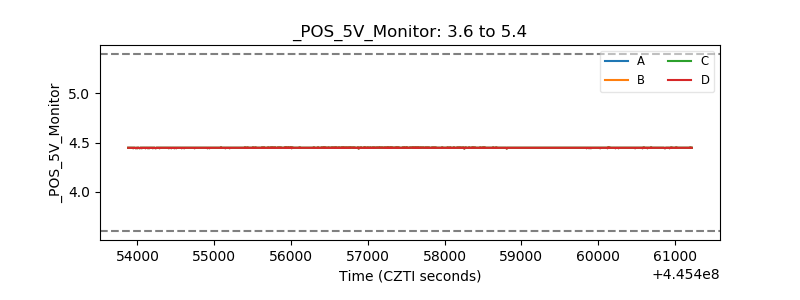 |
| _ROLL_ROT | 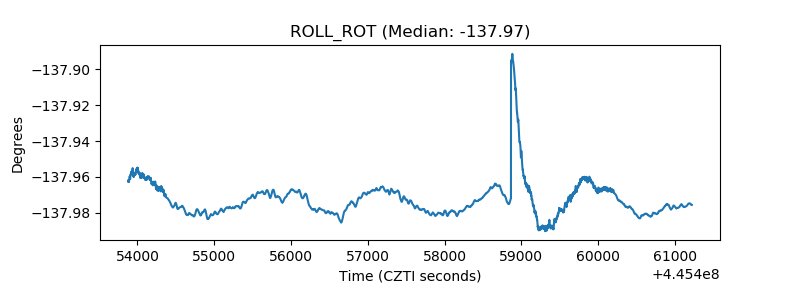 |
| _Roll_DEC | 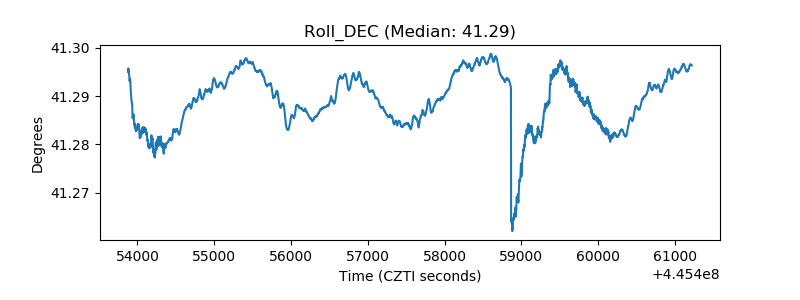 |
| _Roll_RA | 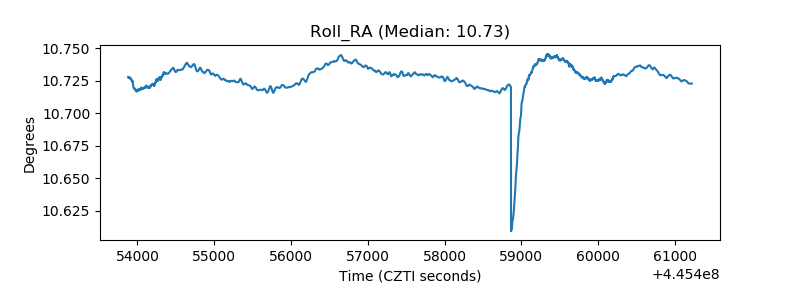 |
| Veto Counter | 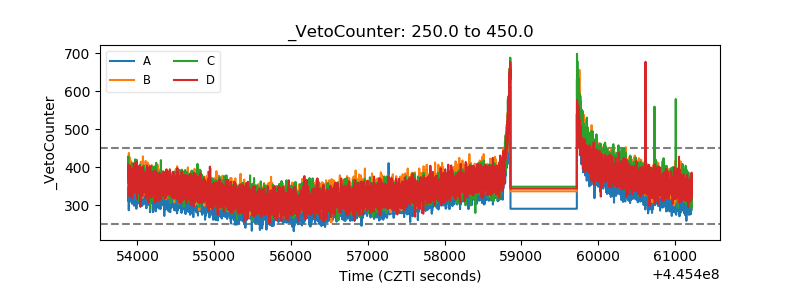 |