| Param | Original file | Final file |
|---|---|---|
| Filename | modeM0/AS1A13_073T04_9000006066_45297cztM0_level2.fits | modeM0/AS1A13_073T04_9000006066_45297cztM0_level2_quad_clean.evt |
| Size (bytes) | 495,976,320 | 110,240,640 |
| Size | 473.0 MB | 105.1 MB |
| Events in quadrant A | 5,721,341 | 727,251 |
| Events in quadrant B | 3,233,297 | 761,683 |
| Events in quadrant C | 3,617,567 | 723,177 |
| Events in quadrant D | 5,260,953 | 652,617 |
| Mode SS | |||
|---|---|---|---|
| Quadrant | BADHDUFLAG | Total packets | Discarded packets |
| A | 0 | 140 | 0 |
| B | 0 | 140 | 0 |
| C | 0 | 140 | 0 |
| D | 0 | 140 | 0 |
| Mode M9 | |||
|---|---|---|---|
| Quadrant | BADHDUFLAG | Total packets | Discarded packets |
| A | 0 | 10 | 0 |
| B | 0 | 10 | 0 |
| C | 0 | 10 | 0 |
| D | 0 | 10 | 0 |
| Mode M0 | |||
|---|---|---|---|
| Quadrant | BADHDUFLAG | Total packets | Discarded packets |
| A | 0 | 22285 | 2 |
| B | 0 | 14301 | 2 |
| C | 0 | 15592 | 2 |
| D | 0 | 20402 | 2 |
| Quadrant | Total seconds | Saturated seconds | Saturation percentage |
|---|---|---|---|
| A | 6782 | 183 | 2.698319% |
| B | 6781 | 55 | 0.811090% |
| C | 6782 | 165 | 2.432911% |
| D | 6782 | 389 | 5.735771% |
Noise dominated data is calculated using 1-second bins in cleaned event files. If a bin has >2000 counts, and if more than 50% of those come from <1% of pixels, then it is considered to be noise-dominated and hence unusable.
| Quadrant | # 1 sec bins | Bins with >0 counts | Bins with >2000 counts | High rate bins dominated by noise | Noise dominated (total time) | Noise dominated (detector-on time) | Marked lightcurve |
|---|---|---|---|---|---|---|---|
| A | 7817 | 6782 | 40 | 40 | 0.51% | 0.59% | 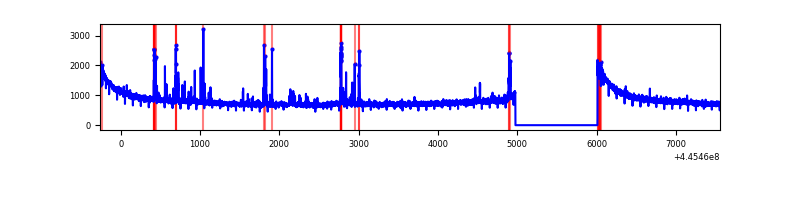 |
| B | 7816 | 6781 | 21 | 21 | 0.27% | 0.31% | 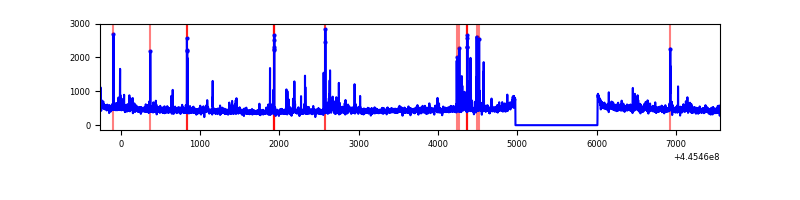 |
| C | 7817 | 6783 | 151 | 151 | 1.93% | 2.23% | 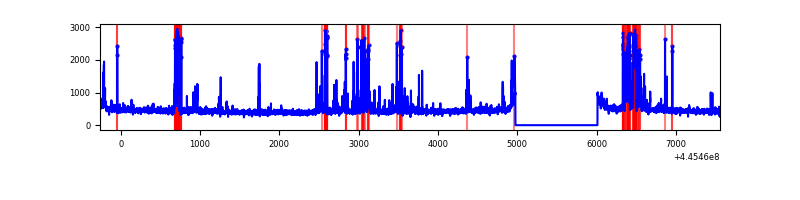 |
| D | 7817 | 6782 | 388 | 388 | 4.96% | 5.72% | 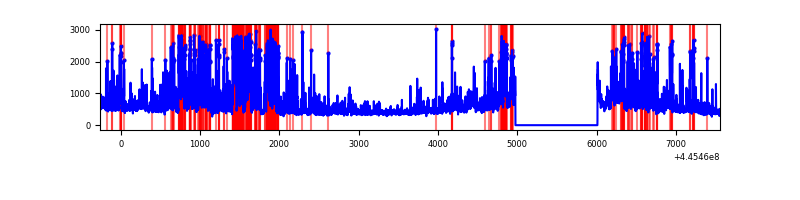 |
Top three noisy pixels from each quadrant. If the there are fewer than three noisy pixels in the level2.evt file, extra rows are filled as -1
| Pixel properties | Quadrant properties | ||||||
|---|---|---|---|---|---|---|---|
| Quadrant | DetID | PixID | Counts | Sigma | Mean | Median | Sigma |
| A | 10 | 83 | 2612853 | 16974.18 | 745 | 729 | 153.9 |
| A | 10 | 248 | 206795 | 1339.06 | 745 | 729 | 153.9 |
| A | 0 | 243 | 11036 | 66.98 | 745 | 729 | 153.9 |
| B | 5 | 32 | 92326 | 625.22 | 752 | 730 | 146.5 |
| B | 0 | 186 | 26403 | 175.24 | 752 | 730 | 146.5 |
| B | 0 | 168 | 24084 | 159.41 | 752 | 730 | 146.5 |
| C | 14 | 254 | 590218 | 3370.55 | 743 | 749 | 174.9 |
| C | 11 | 16 | 79621 | 450.99 | 743 | 749 | 174.9 |
| C | 12 | 2 | 19805 | 108.96 | 743 | 749 | 174.9 |
| D | 2 | 249 | 1583529 | 8576.46 | 732 | 711 | 184.6 |
| D | 1 | 52 | 422419 | 2285.01 | 732 | 711 | 184.6 |
| D | 13 | 171 | 142417 | 767.83 | 732 | 711 | 184.6 |
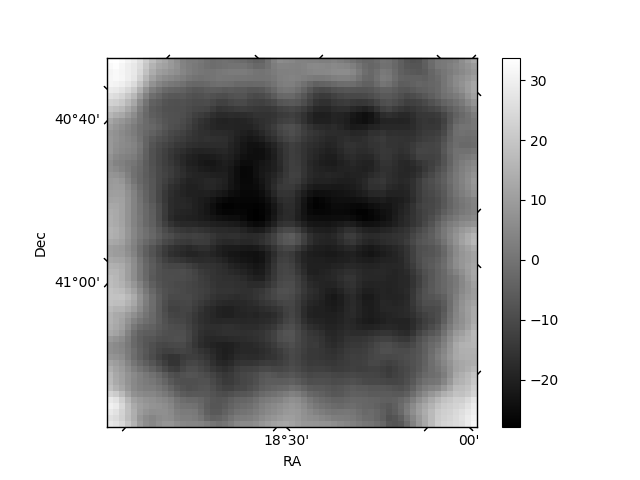
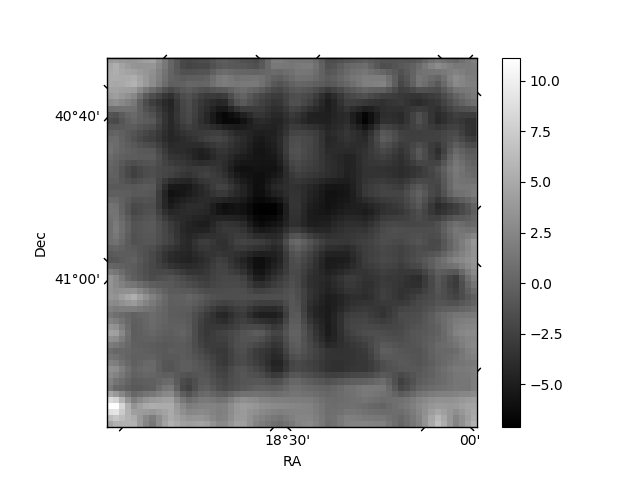
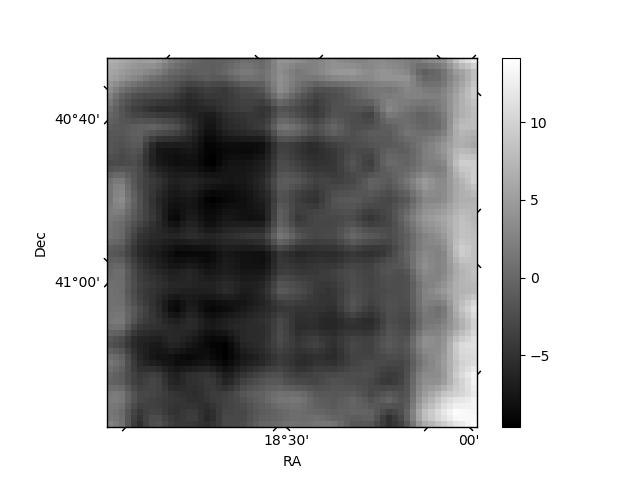
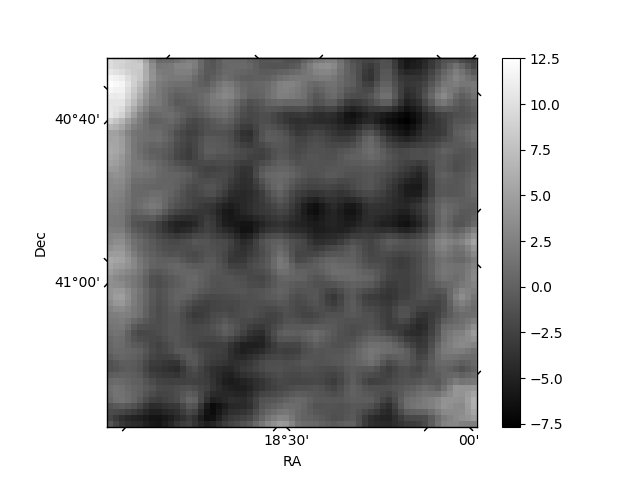
Histogram calculated using DETX and DETY for each event in the final _common_clean file
| Quadrant A | 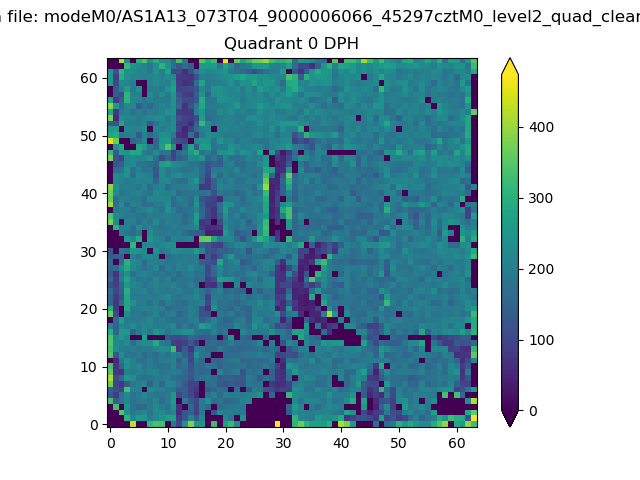 |
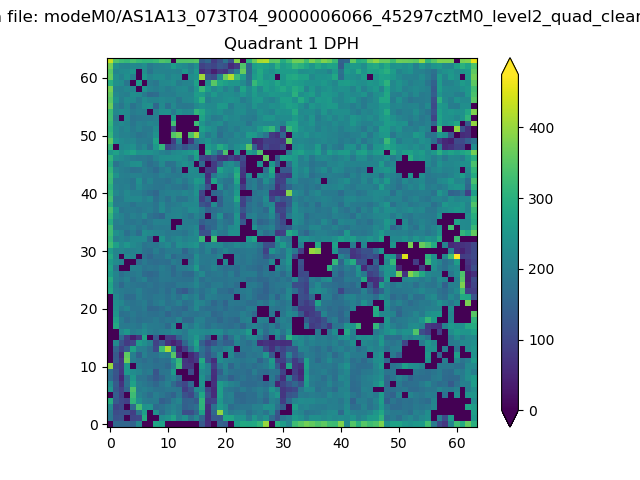 |
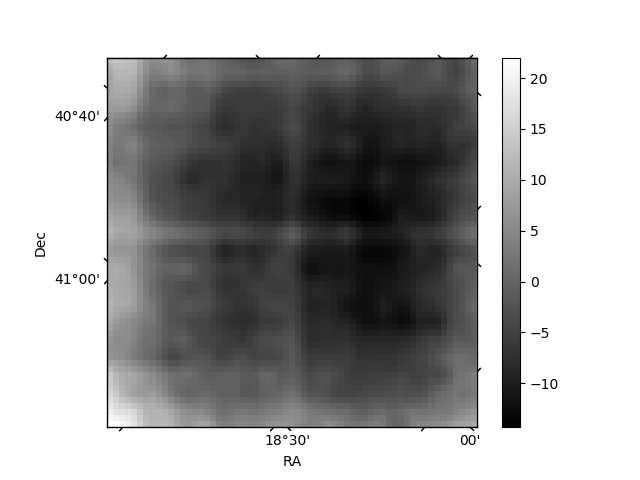
Quadrant B |
|---|---|---|---|
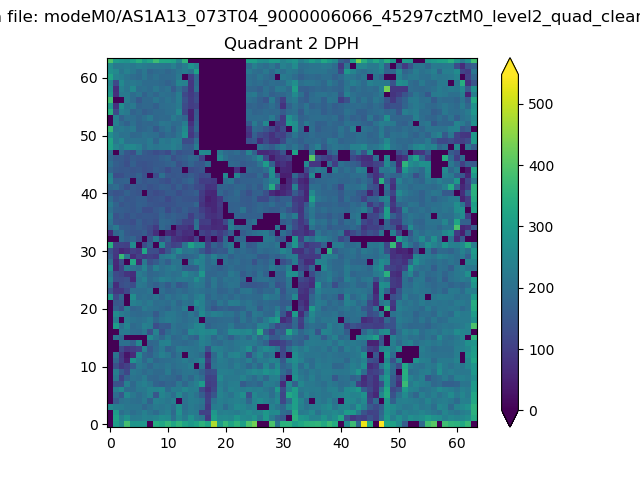
| Quadrant D | 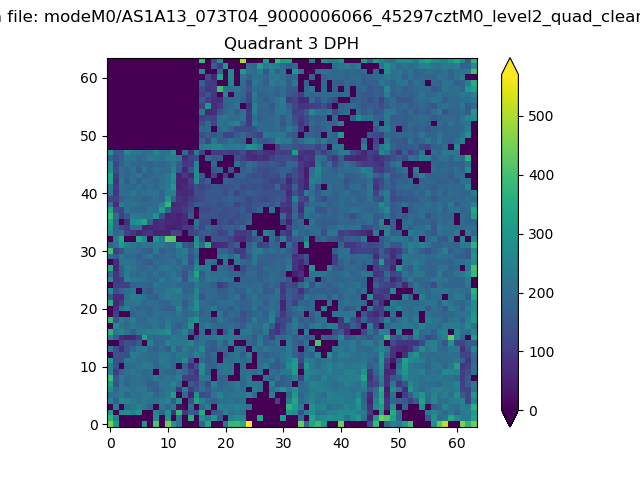 |
 |
Quadrant C |
| Plot type | Count rate plots | Images |
|---|---|---|
| Comparison with Poisson distribution Blue bars denote a histogram of data divided into 1 sec bins. Red curve is a Poisson curve with rate = median count rate of data. |
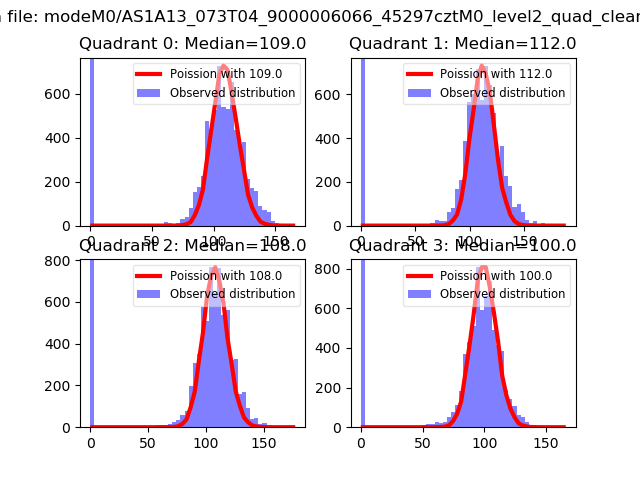 |
 |
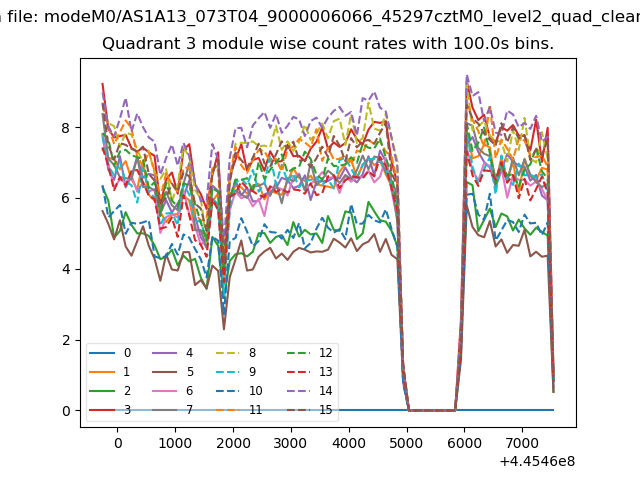
| Quadrant-wise count rates Data is divided into 100 sec bins |
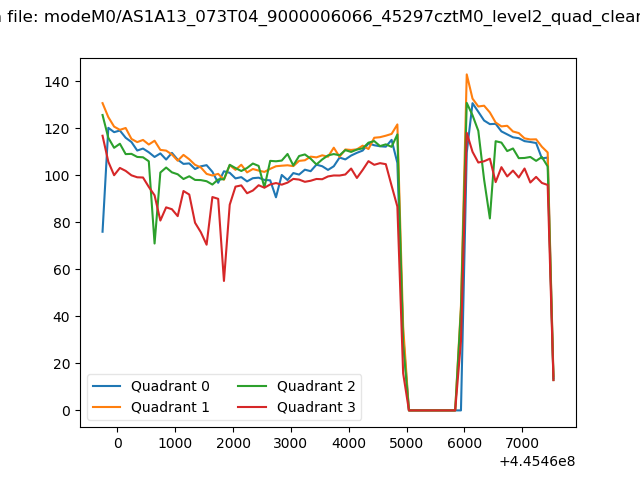 |
|
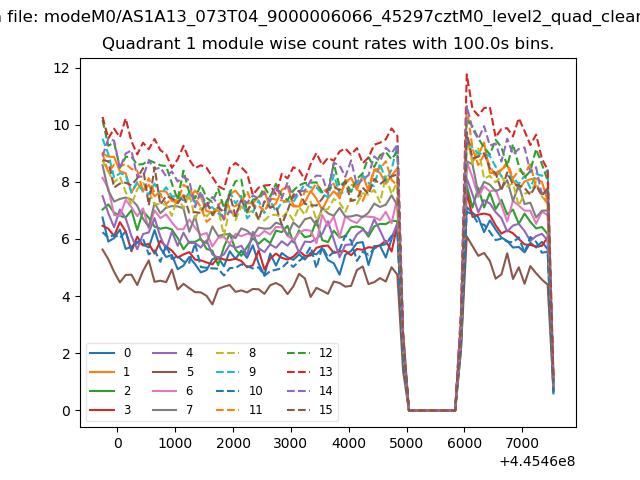
| Module-wise count rates for Quadrant A Data is divided into 100 sec bins |
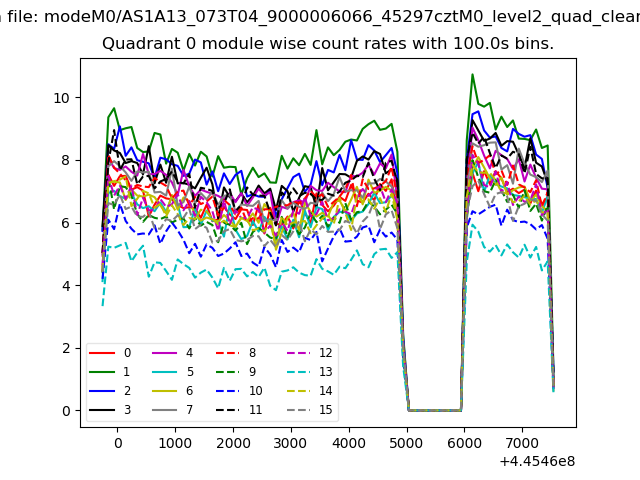 |
 |
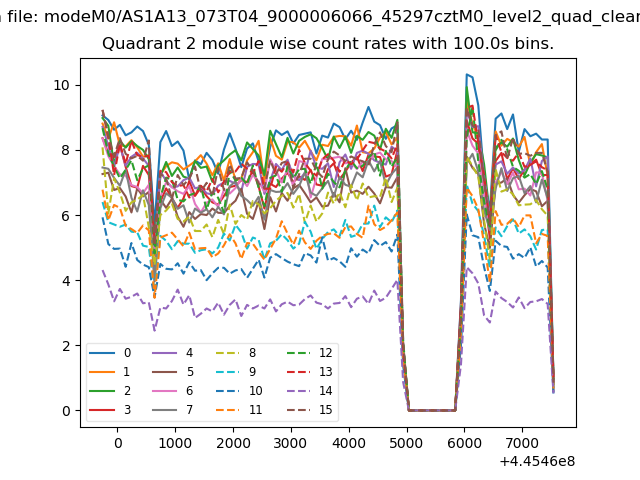
| Module-wise count rates for Quadrant B Data is divided into 100 sec bins |
 |
 |
| Module-wise count rates for Quadrant C Data is divided into 100 sec bins |
 |
 |
| Module-wise count rates for Quadrant D Data is divided into 100 sec bins |
 |
 |
| Parameter | Plot |
|---|---|
| CZT HV Monitor | 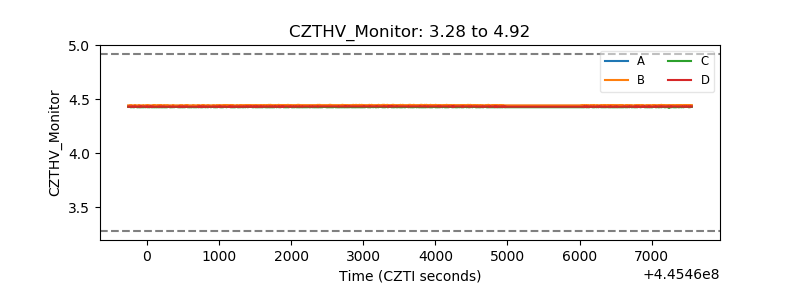 |
| D_VDD | 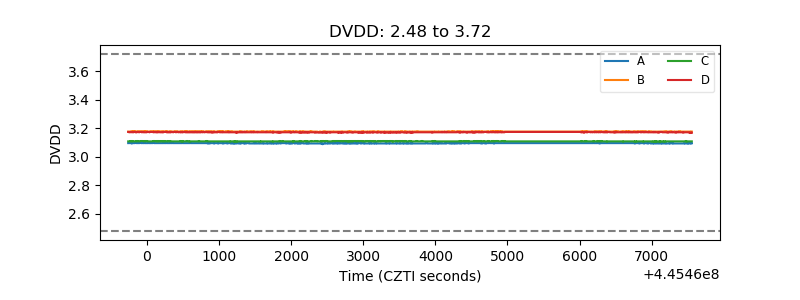 |
| Temperature 1 | 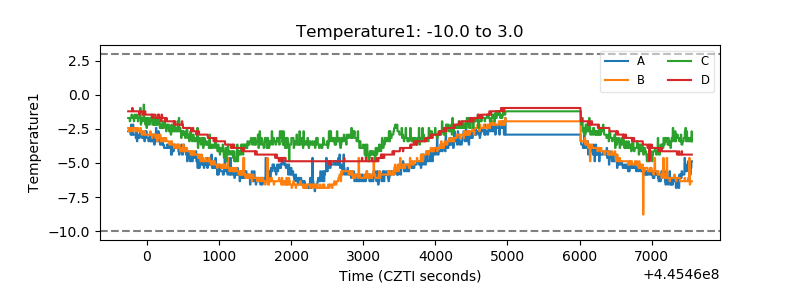 |
| Veto HV Monitor |  |
| Veto LLD | 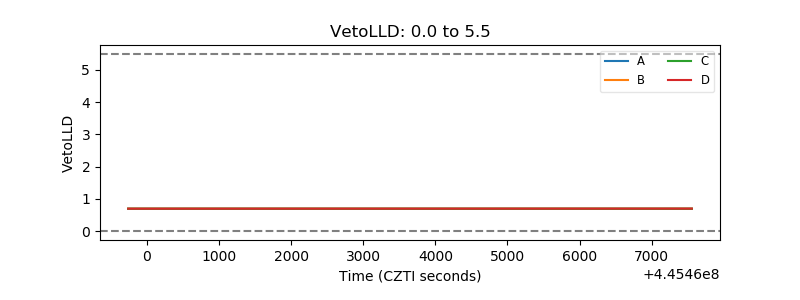 |
| Alpha Counter | 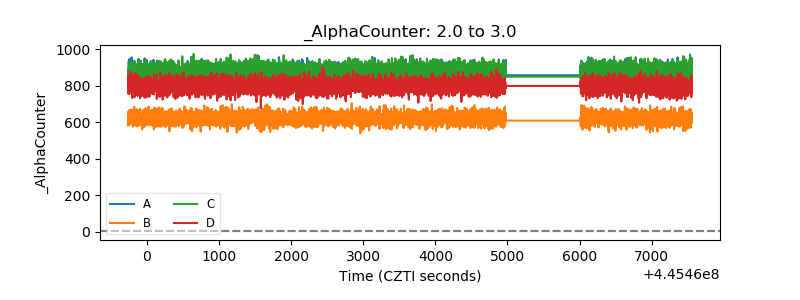 |
| _CPM_Rate | 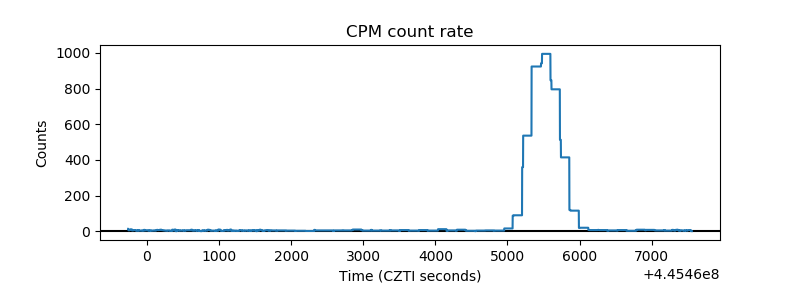 |
| CZT Counter | 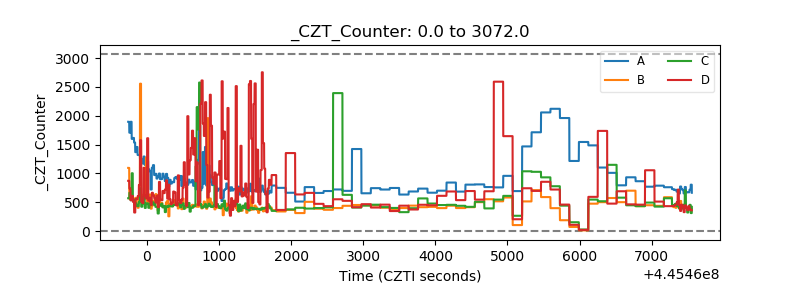 |
| +2.5 Volts monitor | 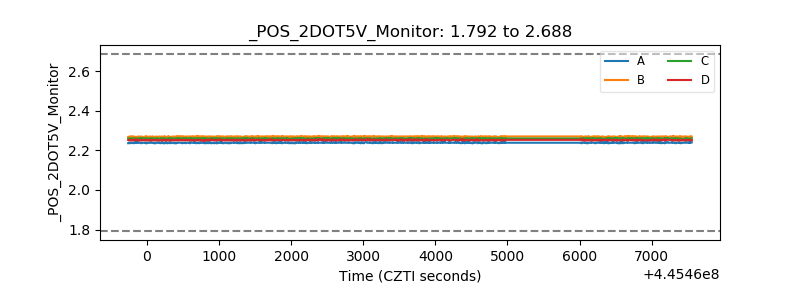 |
| +5 Volts monitor | 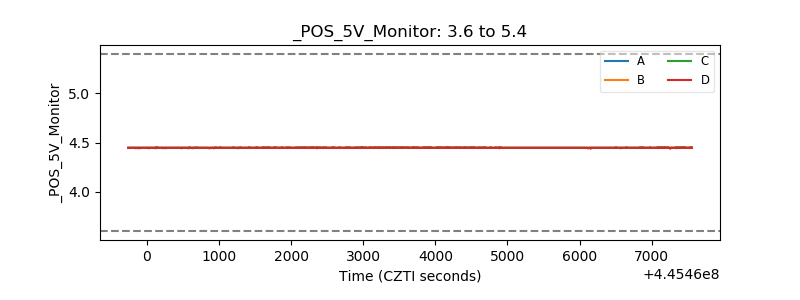 |
| _ROLL_ROT | 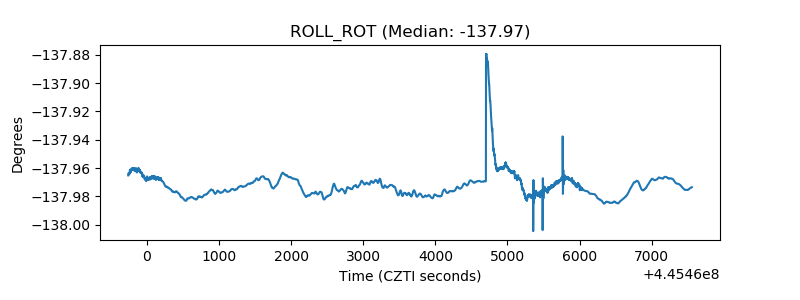 |
| _Roll_DEC | 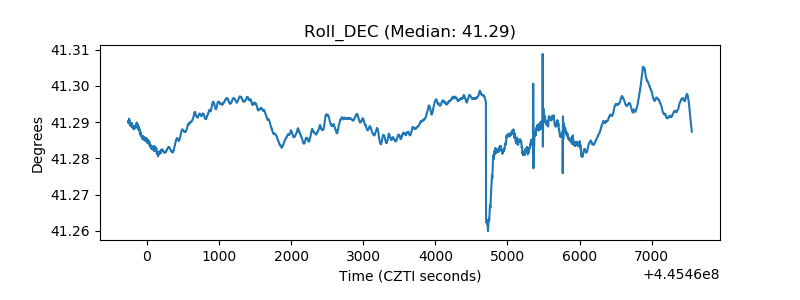 |
| _Roll_RA | 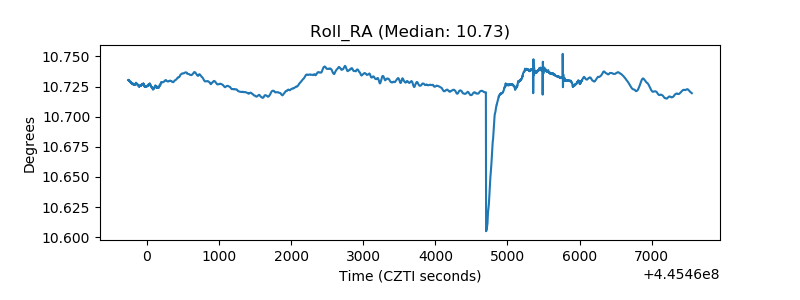 |
| Veto Counter | 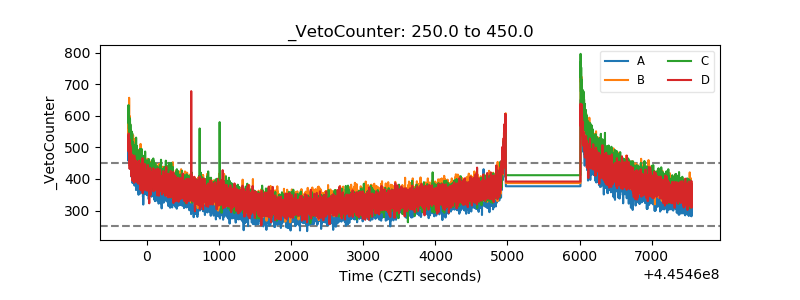 |