| Param | Original file | Final file |
|---|---|---|
| Filename | modeM0/AS1A13_073T04_9000006066_45298cztM0_level2.fits | modeM0/AS1A13_073T04_9000006066_45298cztM0_level2_quad_clean.evt |
| Size (bytes) | 473,158,080 | 110,695,680 |
| Size | 451.2 MB | 105.6 MB |
| Events in quadrant A | 5,687,609 | 722,462 |
| Events in quadrant B | 3,256,988 | 775,256 |
| Events in quadrant C | 3,582,449 | 733,396 |
| Events in quadrant D | 4,481,101 | 665,727 |
| Mode SS | |||
|---|---|---|---|
| Quadrant | BADHDUFLAG | Total packets | Discarded packets |
| A | 0 | 132 | 0 |
| B | 0 | 132 | 0 |
| C | 0 | 132 | 0 |
| D | 0 | 132 | 0 |
| Mode M9 | |||
|---|---|---|---|
| Quadrant | BADHDUFLAG | Total packets | Discarded packets |
| A | 0 | 17 | 0 |
| B | 0 | 17 | 0 |
| C | 0 | 18 | 0 |
| D | 0 | 18 | 0 |
| Mode M0 | |||
|---|---|---|---|
| Quadrant | BADHDUFLAG | Total packets | Discarded packets |
| A | 0 | 22025 | 4 |
| B | 0 | 14016 | 2 |
| C | 0 | 15185 | 2 |
| D | 0 | 17985 | 2 |
| Quadrant | Total seconds | Saturated seconds | Saturation percentage |
|---|---|---|---|
| A | 6526 | 262 | 4.014710% |
| B | 6526 | 51 | 0.781489% |
| C | 6526 | 165 | 2.528348% |
| D | 6526 | 265 | 4.060680% |
Noise dominated data is calculated using 1-second bins in cleaned event files. If a bin has >2000 counts, and if more than 50% of those come from <1% of pixels, then it is considered to be noise-dominated and hence unusable.
| Quadrant | # 1 sec bins | Bins with >0 counts | Bins with >2000 counts | High rate bins dominated by noise | Noise dominated (total time) | Noise dominated (detector-on time) | Marked lightcurve |
|---|---|---|---|---|---|---|---|
| A | 7691 | 6526 | 142 | 142 | 1.85% | 2.18% | 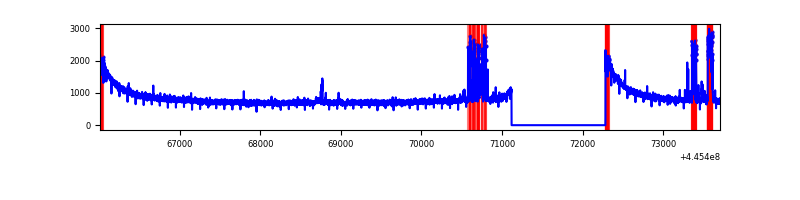 |
| B | 7691 | 6527 | 15 | 15 | 0.20% | 0.23% | 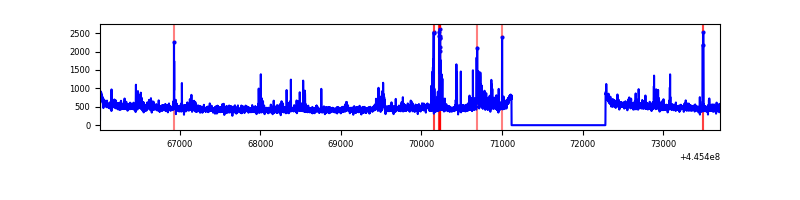 |
| C | 7691 | 6526 | 158 | 158 | 2.05% | 2.42% | 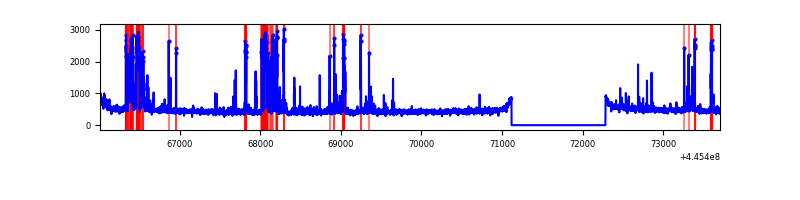 |
| D | 7691 | 6526 | 227 | 227 | 2.95% | 3.48% | 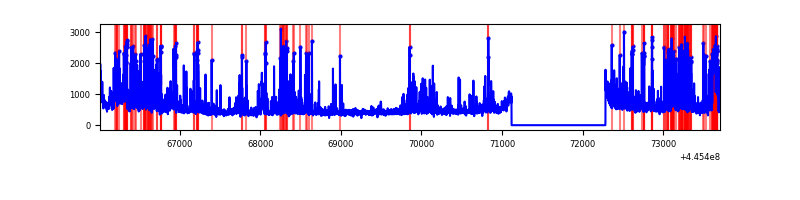 |
Top three noisy pixels from each quadrant. If the there are fewer than three noisy pixels in the level2.evt file, extra rows are filled as -1
| Pixel properties | Quadrant properties | ||||||
|---|---|---|---|---|---|---|---|
| Quadrant | DetID | PixID | Counts | Sigma | Mean | Median | Sigma |
| A | 10 | 83 | 2487042 | 16552.87 | 732 | 718 | 150.2 |
| A | 10 | 248 | 349111 | 2319.45 | 732 | 718 | 150.2 |
| A | 0 | 243 | 13955 | 88.13 | 732 | 718 | 150.2 |
| B | 3 | 112 | 104039 | 716.3 | 745 | 725 | 144.2 |
| B | 5 | 172 | 63168 | 432.93 | 745 | 725 | 144.2 |
| B | 0 | 183 | 38588 | 262.51 | 745 | 725 | 144.2 |
| C | 14 | 254 | 657877 | 3816.17 | 735 | 740 | 172.2 |
| C | 11 | 16 | 17143 | 95.26 | 735 | 740 | 172.2 |
| C | 12 | 249 | 13028 | 71.36 | 735 | 740 | 172.2 |
| D | 2 | 249 | 1192088 | 6608.45 | 727 | 706 | 180.3 |
| D | 13 | 171 | 155424 | 858.2 | 727 | 706 | 180.3 |
| D | 1 | 52 | 140959 | 777.97 | 727 | 706 | 180.3 |
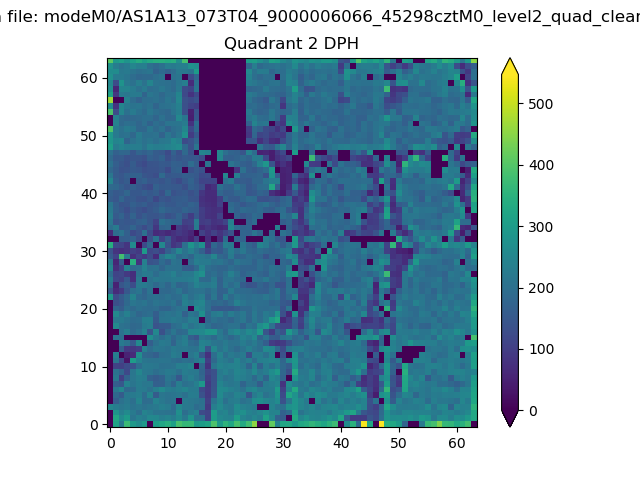
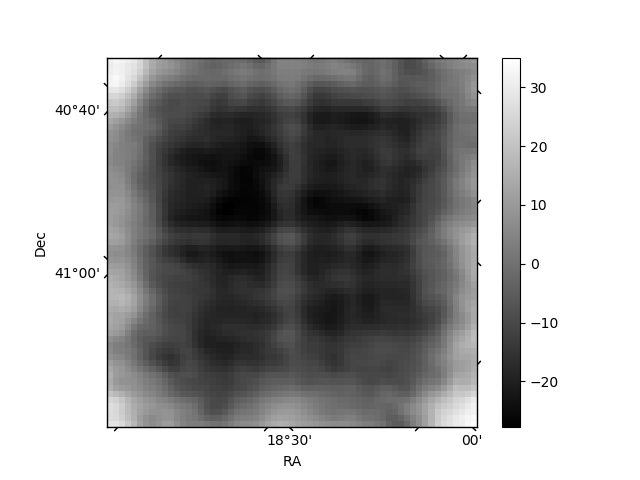
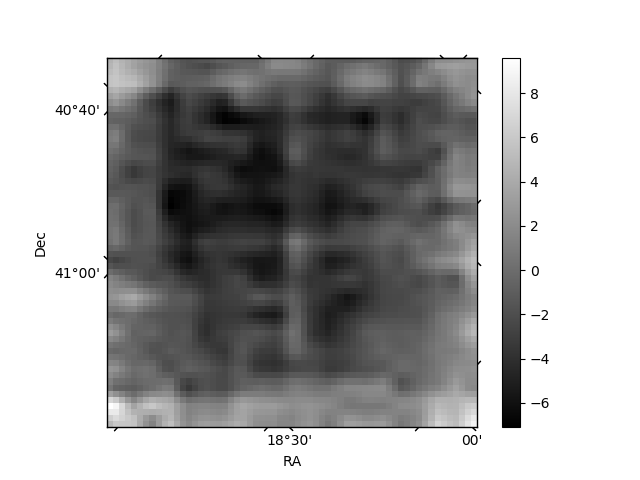
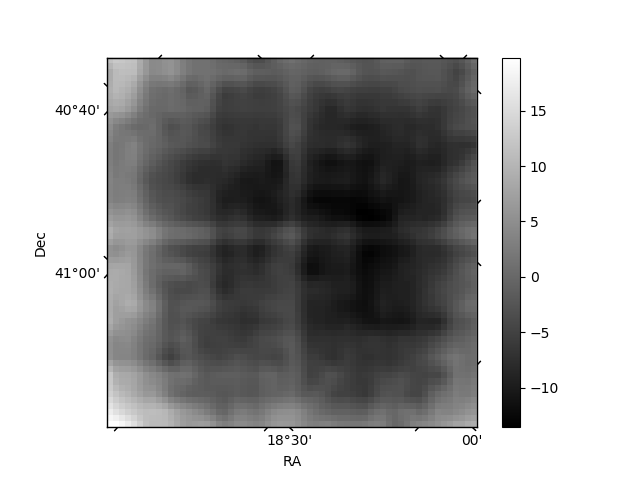
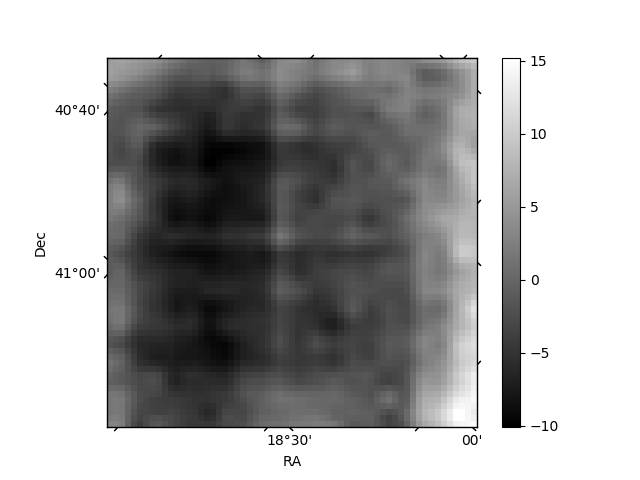
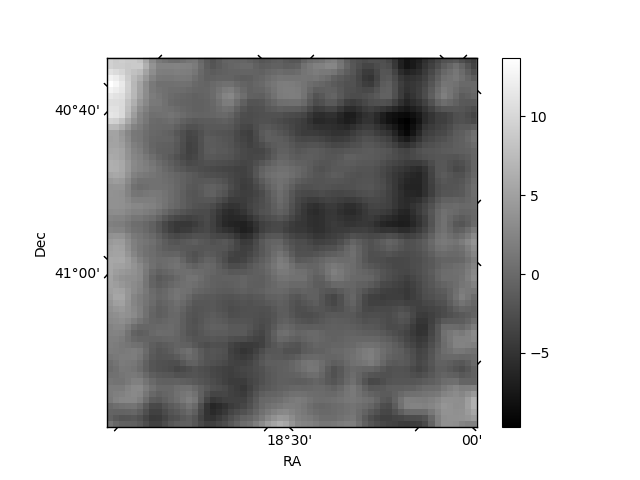
Histogram calculated using DETX and DETY for each event in the final _common_clean file
| Quadrant A | 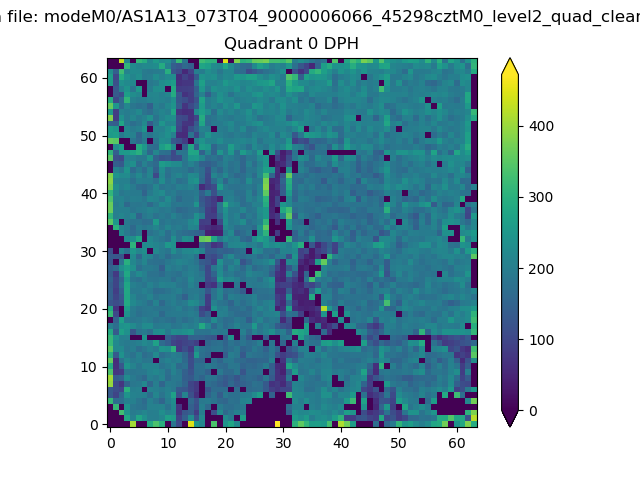 |
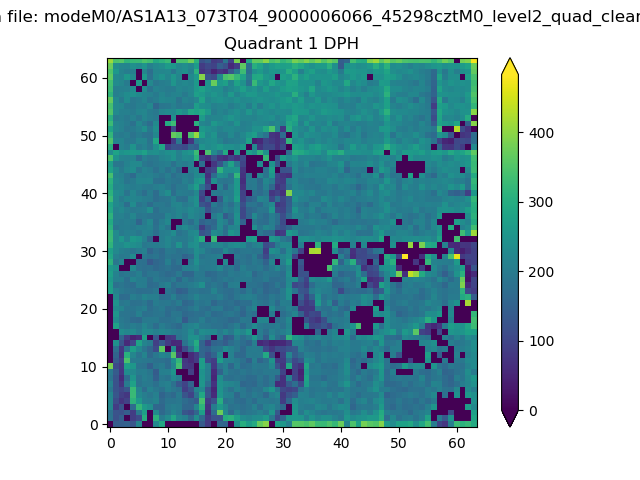 |
Quadrant B |
|---|---|---|---|
| Quadrant D | 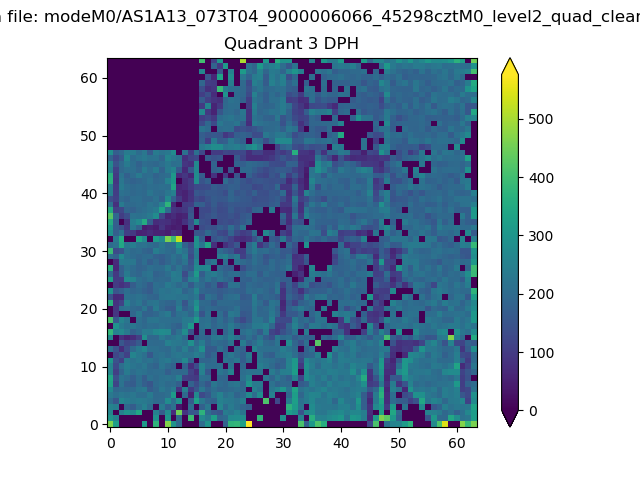 |
 |
Quadrant C |
| Plot type | Count rate plots | Images |
|---|---|---|
| Comparison with Poisson distribution Blue bars denote a histogram of data divided into 1 sec bins. Red curve is a Poisson curve with rate = median count rate of data. |
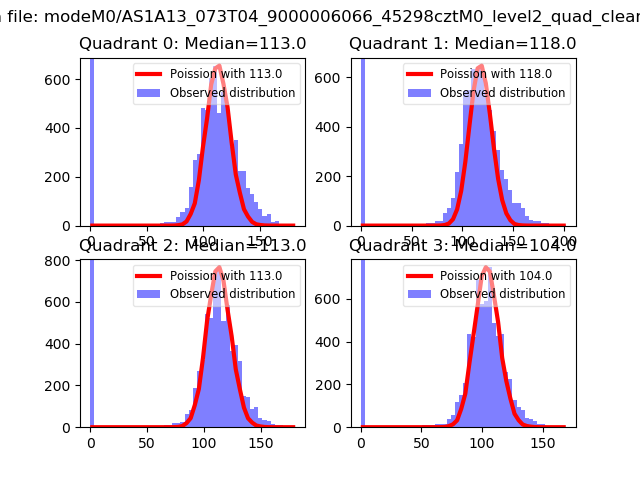 |
 |
| Quadrant-wise count rates Data is divided into 100 sec bins |
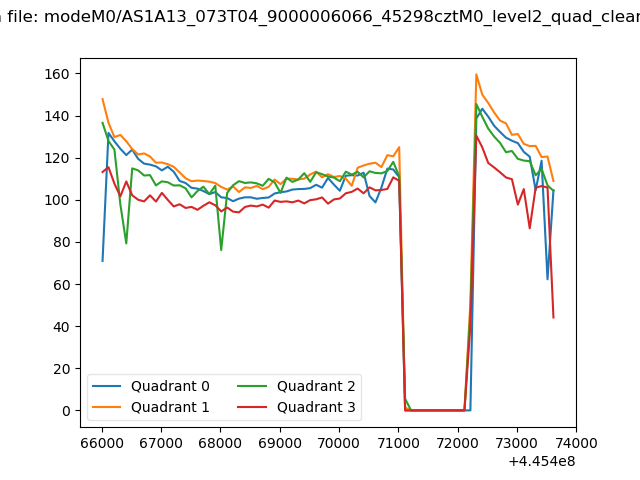 |
|
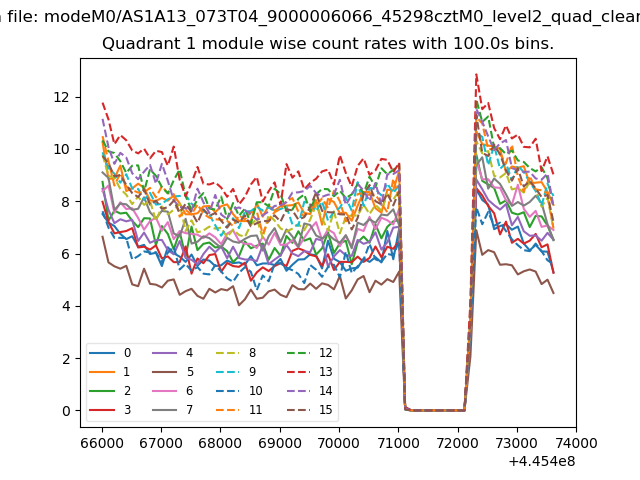
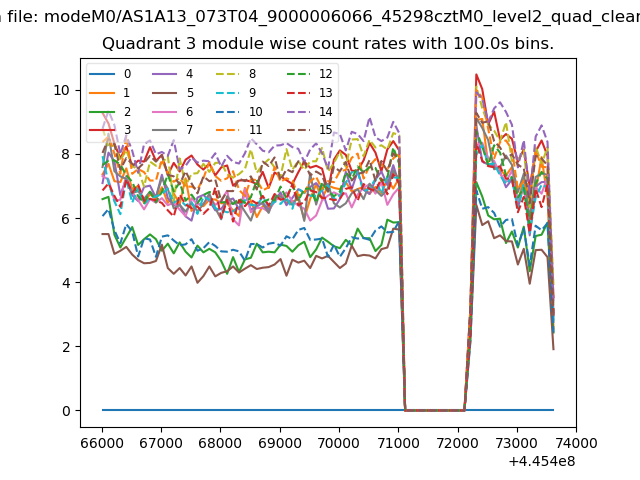
| Module-wise count rates for Quadrant A Data is divided into 100 sec bins |
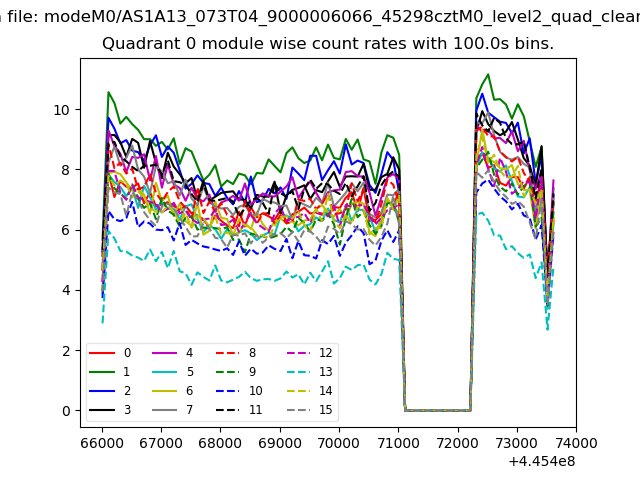 |
 |
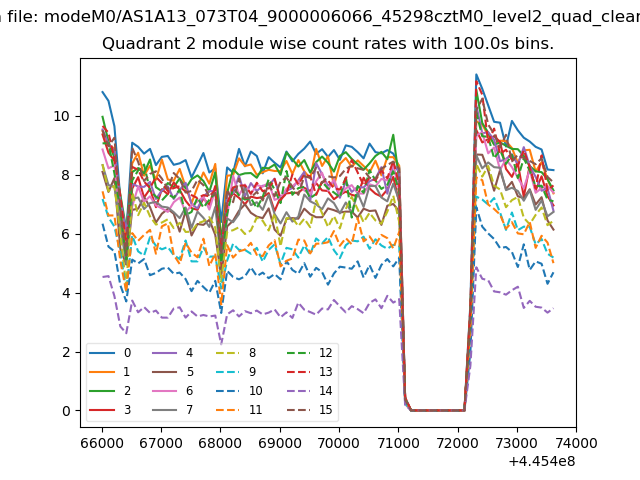
| Module-wise count rates for Quadrant B Data is divided into 100 sec bins |
 |
 |
| Module-wise count rates for Quadrant C Data is divided into 100 sec bins |
 |
 |
| Module-wise count rates for Quadrant D Data is divided into 100 sec bins |
 |
 |
| Parameter | Plot |
|---|---|
| CZT HV Monitor | 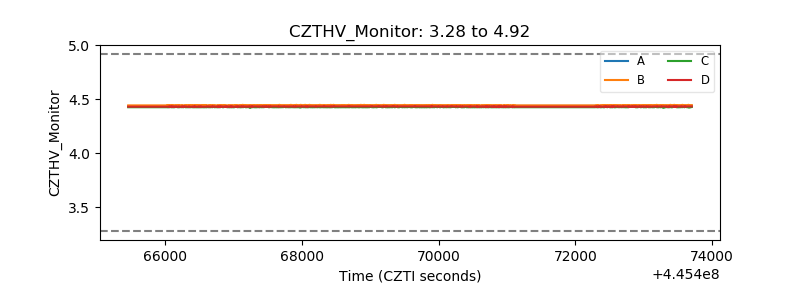 |
| D_VDD | 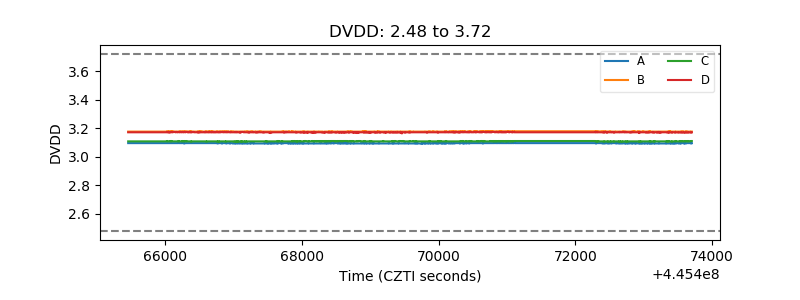 |
| Temperature 1 | 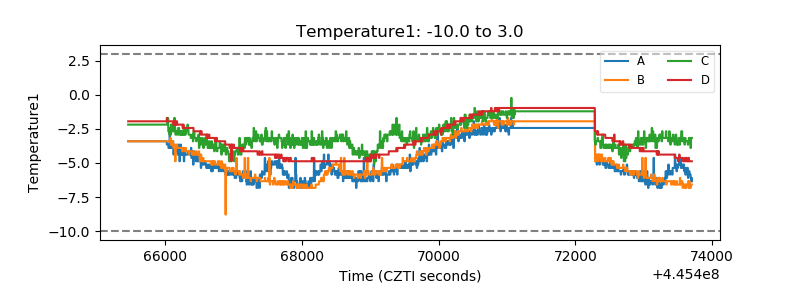 |
| Veto HV Monitor | 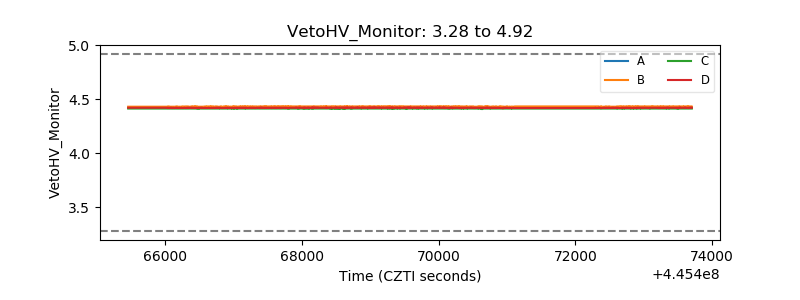 |
| Veto LLD | 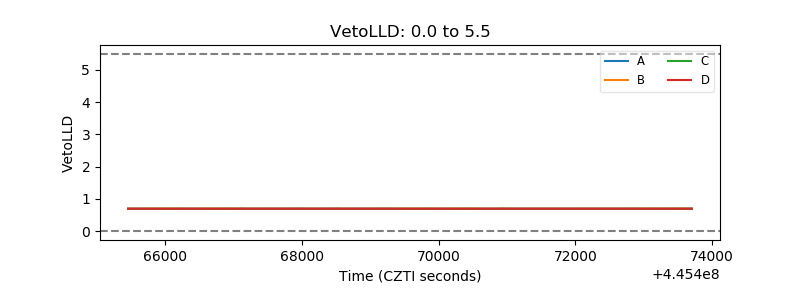 |
| Alpha Counter |  |
| _CPM_Rate | 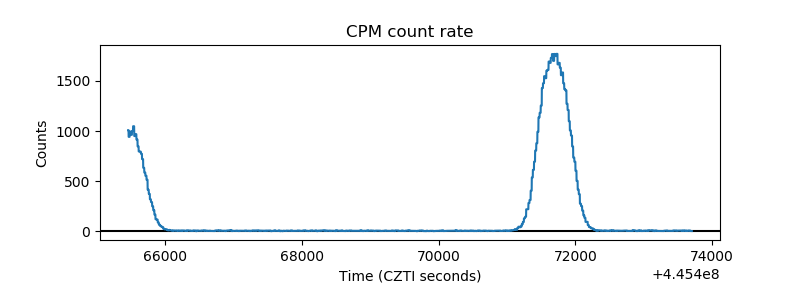 |
| CZT Counter | 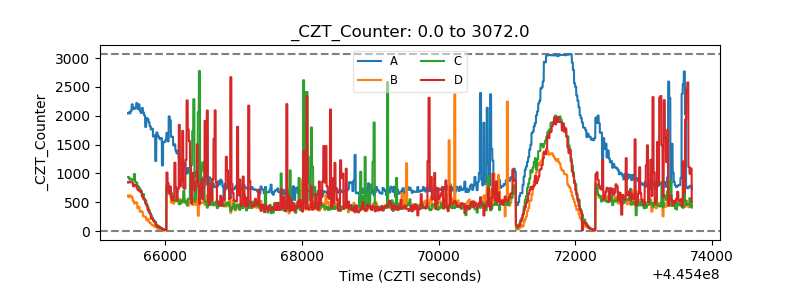 |
| +2.5 Volts monitor | 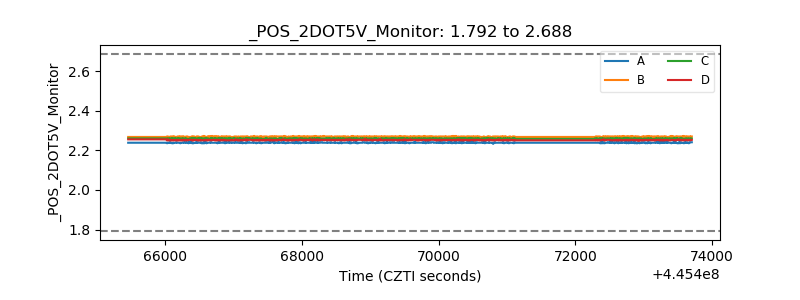 |
| +5 Volts monitor | 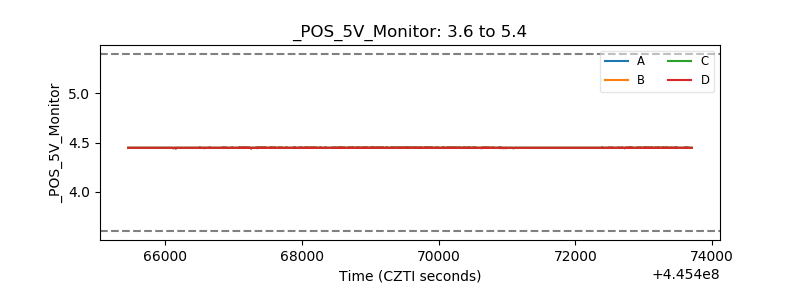 |
| _ROLL_ROT | 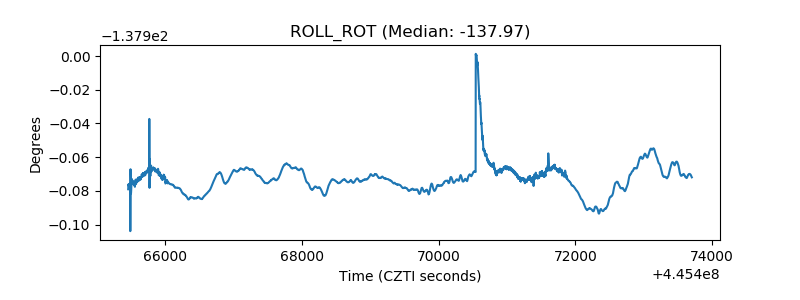 |
| _Roll_DEC | 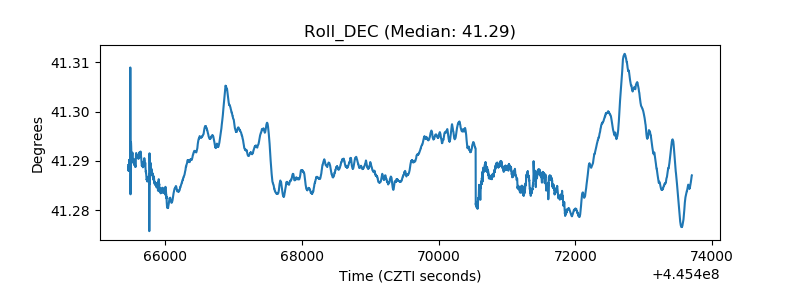 |
| _Roll_RA | 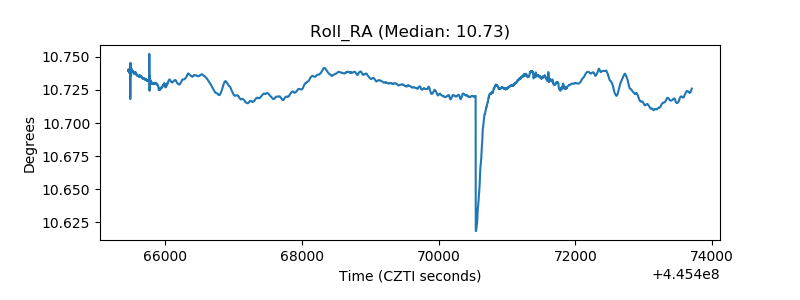 |
| Veto Counter | 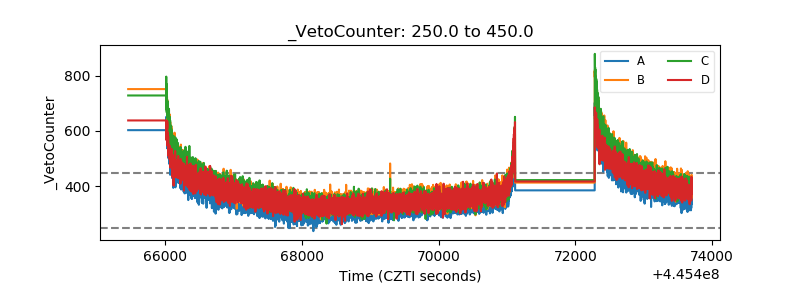 |