| Param | Original file | Final file |
|---|---|---|
| Filename | modeM0/AS1A13_073T04_9000006066_45299cztM0_level2.fits | modeM0/AS1A13_073T04_9000006066_45299cztM0_level2_quad_clean.evt |
| Size (bytes) | 466,885,440 | 115,957,440 |
| Size | 445.3 MB | 110.6 MB |
| Events in quadrant A | 5,780,489 | 759,295 |
| Events in quadrant B | 3,425,907 | 811,142 |
| Events in quadrant C | 3,197,176 | 782,860 |
| Events in quadrant D | 4,370,470 | 700,989 |
| Mode SS | |||
|---|---|---|---|
| Quadrant | BADHDUFLAG | Total packets | Discarded packets |
| A | 0 | 134 | 0 |
| B | 0 | 134 | 0 |
| C | 0 | 134 | 0 |
| D | 0 | 134 | 0 |
| Mode M9 | |||
|---|---|---|---|
| Quadrant | BADHDUFLAG | Total packets | Discarded packets |
| A | 0 | 12 | 0 |
| B | 0 | 12 | 0 |
| C | 0 | 12 | 0 |
| D | 0 | 12 | 0 |
| Mode M0 | |||
|---|---|---|---|
| Quadrant | BADHDUFLAG | Total packets | Discarded packets |
| A | 0 | 22167 | 2 |
| B | 0 | 14462 | 2 |
| C | 0 | 13973 | 2 |
| D | 0 | 17543 | 2 |
| Quadrant | Total seconds | Saturated seconds | Saturation percentage |
|---|---|---|---|
| A | 6549 | 277 | 4.229653% |
| B | 6549 | 138 | 2.107192% |
| C | 6550 | 57 | 0.870229% |
| D | 6550 | 270 | 4.122137% |
Noise dominated data is calculated using 1-second bins in cleaned event files. If a bin has >2000 counts, and if more than 50% of those come from <1% of pixels, then it is considered to be noise-dominated and hence unusable.
| Quadrant | # 1 sec bins | Bins with >0 counts | Bins with >2000 counts | High rate bins dominated by noise | Noise dominated (total time) | Noise dominated (detector-on time) | Marked lightcurve |
|---|---|---|---|---|---|---|---|
| A | 7784 | 6549 | 151 | 151 | 1.94% | 2.31% | 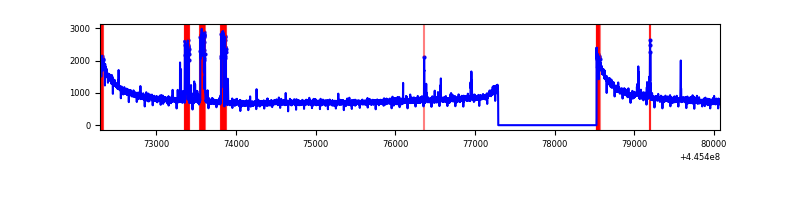 |
| B | 7784 | 6549 | 73 | 73 | 0.94% | 1.11% | 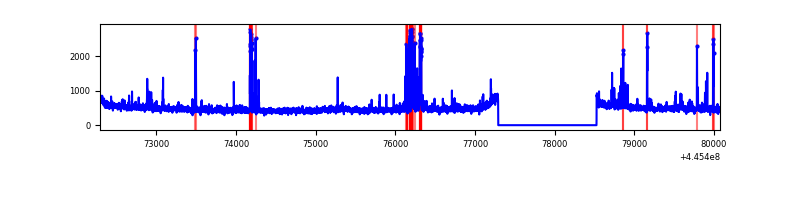 |
| C | 7785 | 6550 | 19 | 19 | 0.24% | 0.29% | 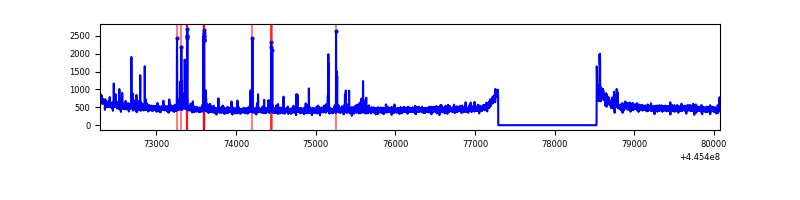 |
| D | 7785 | 6550 | 218 | 218 | 2.80% | 3.33% | 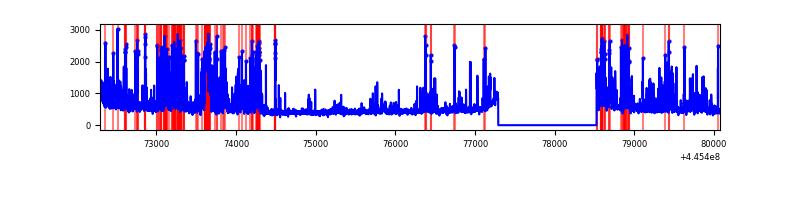 |
Top three noisy pixels from each quadrant. If the there are fewer than three noisy pixels in the level2.evt file, extra rows are filled as -1
| Pixel properties | Quadrant properties | ||||||
|---|---|---|---|---|---|---|---|
| Quadrant | DetID | PixID | Counts | Sigma | Mean | Median | Sigma |
| A | 10 | 83 | 2460233 | 15792.17 | 759 | 746 | 155.7 |
| A | 10 | 248 | 370683 | 2375.34 | 759 | 746 | 155.7 |
| A | 0 | 243 | 10151 | 60.39 | 759 | 746 | 155.7 |
| B | 5 | 172 | 244578 | 1642.72 | 770 | 749 | 148.4 |
| B | 0 | 183 | 37363 | 246.68 | 770 | 749 | 148.4 |
| B | 4 | 80 | 23813 | 155.39 | 770 | 749 | 148.4 |
| C | 14 | 254 | 183150 | 1022.32 | 763 | 770 | 178.4 |
| C | 3 | 233 | 19236 | 103.51 | 763 | 770 | 178.4 |
| C | 12 | 2 | 7614 | 38.36 | 763 | 770 | 178.4 |
| D | 2 | 249 | 878192 | 4695.2 | 750 | 728 | 186.9 |
| D | 1 | 52 | 185111 | 986.61 | 750 | 728 | 186.9 |
| D | 13 | 171 | 177012 | 943.27 | 750 | 728 | 186.9 |
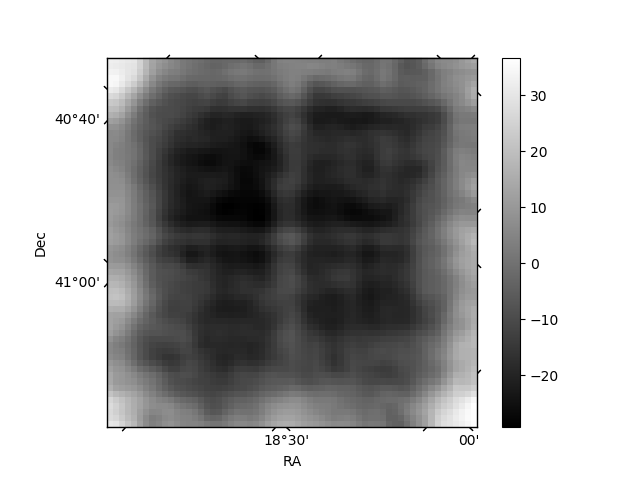
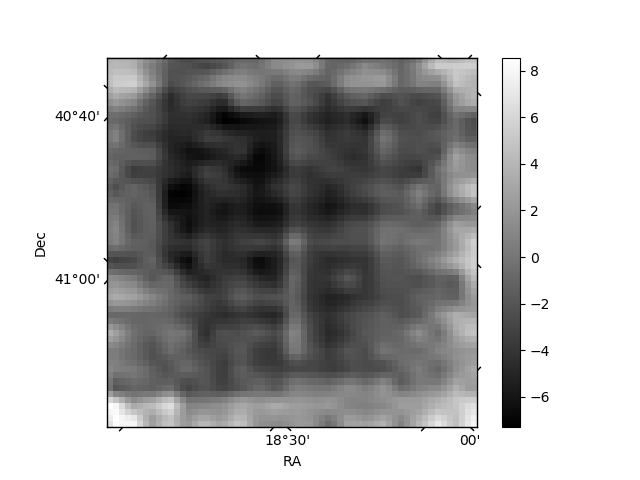
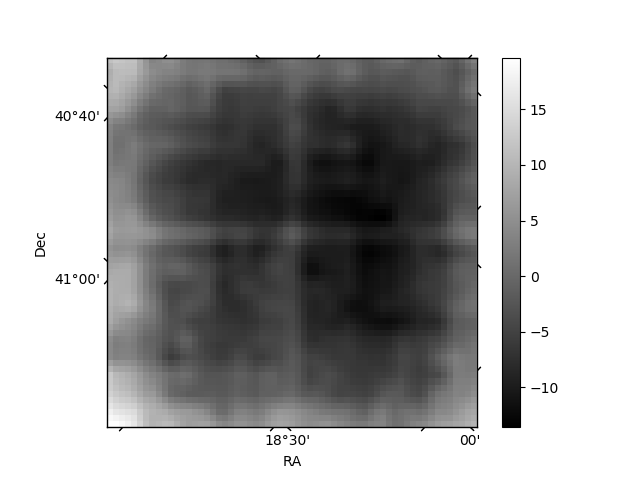
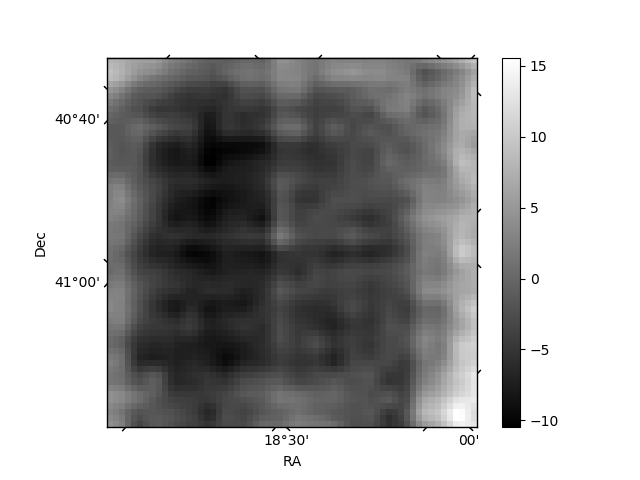
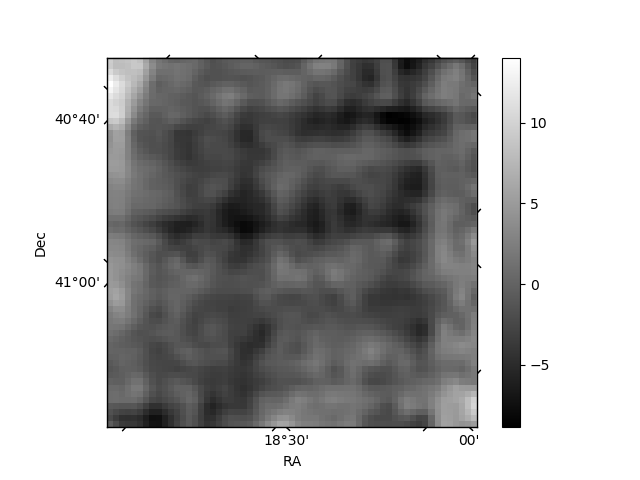
Histogram calculated using DETX and DETY for each event in the final _common_clean file
| Quadrant A | 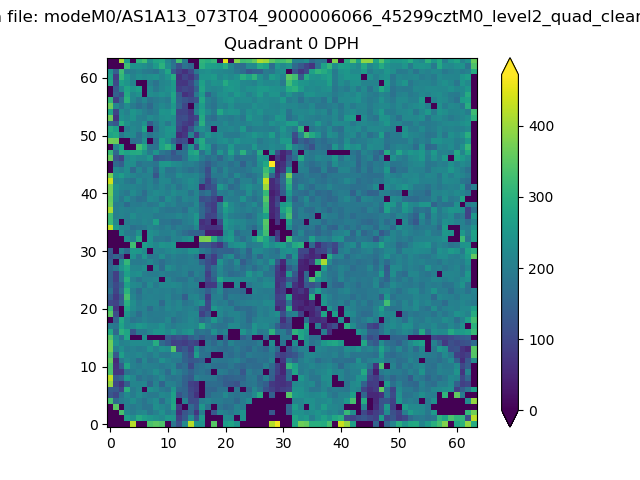 |
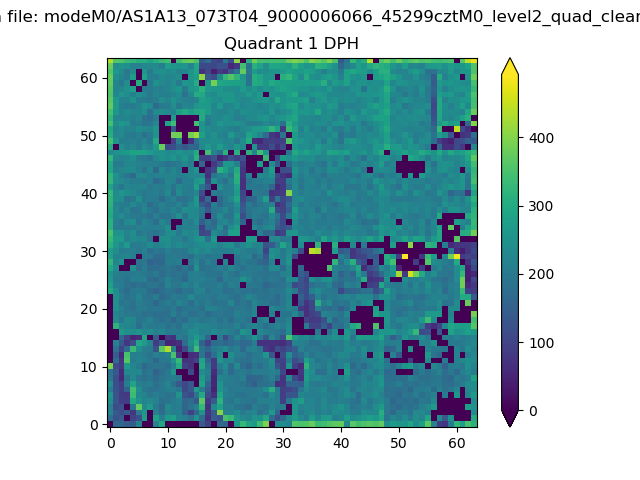 |
Quadrant B |
|---|---|---|---|
| Quadrant D | 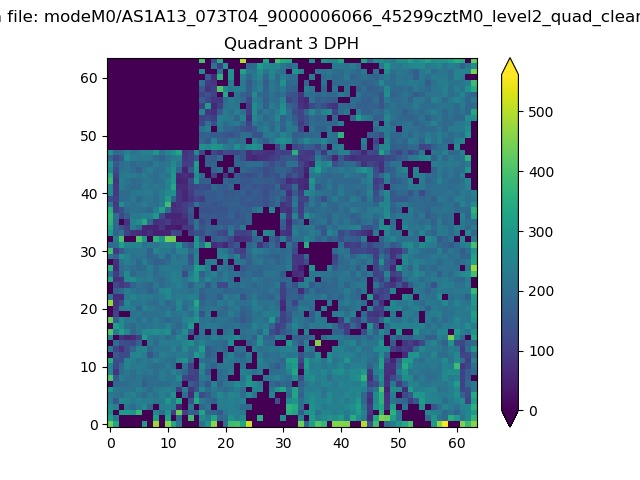 |
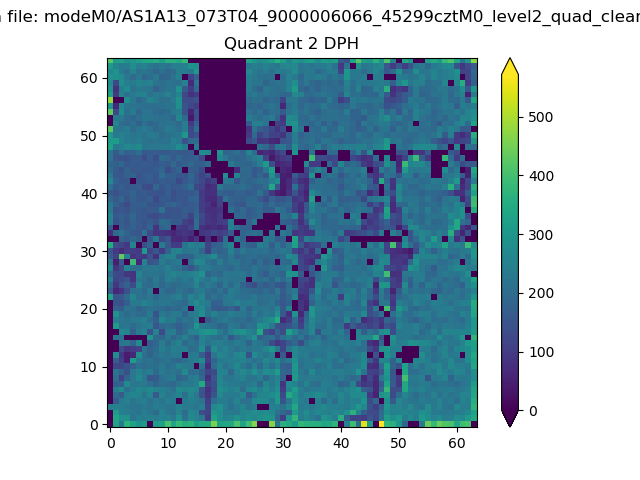 |
Quadrant C |
| Plot type | Count rate plots | Images |
|---|---|---|
| Comparison with Poisson distribution Blue bars denote a histogram of data divided into 1 sec bins. Red curve is a Poisson curve with rate = median count rate of data. |
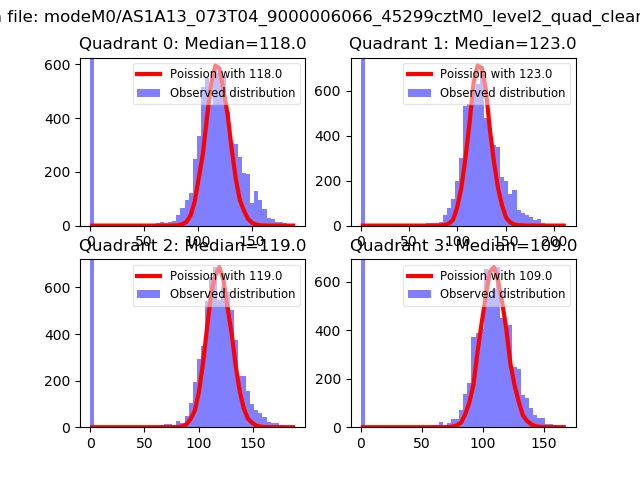 |
 |
| Quadrant-wise count rates Data is divided into 100 sec bins |
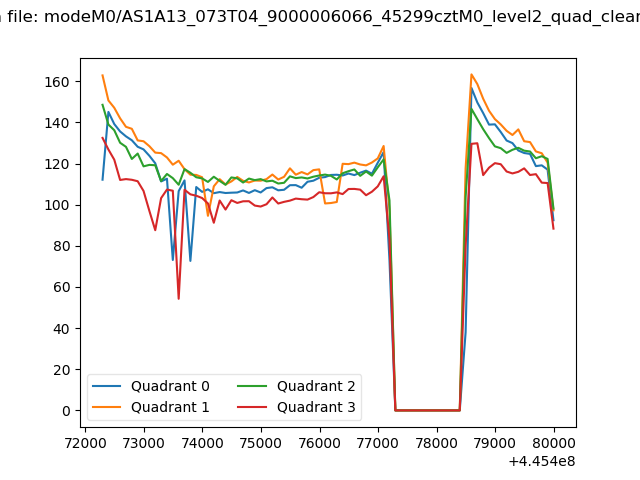 |
|
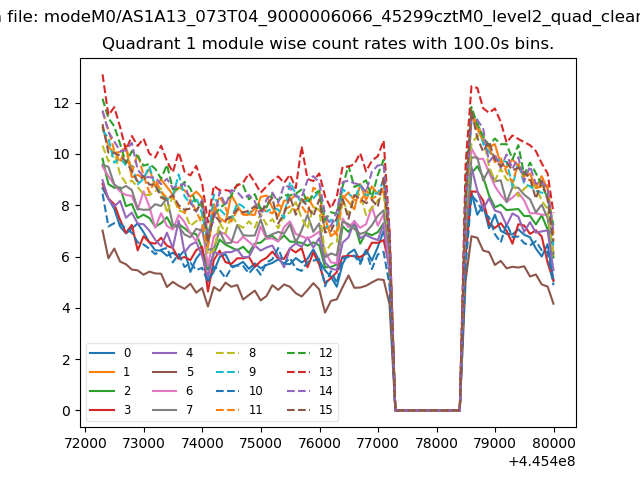
| Module-wise count rates for Quadrant A Data is divided into 100 sec bins |
 |
 |
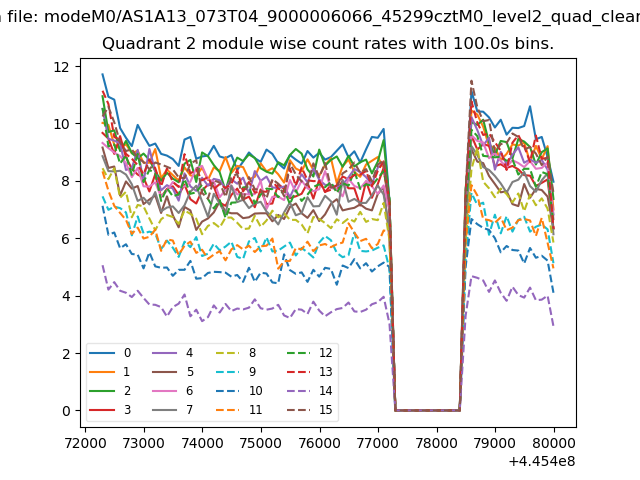
| Module-wise count rates for Quadrant B Data is divided into 100 sec bins |
 |
 |
| Module-wise count rates for Quadrant C Data is divided into 100 sec bins |
 |
 |
| Module-wise count rates for Quadrant D Data is divided into 100 sec bins |
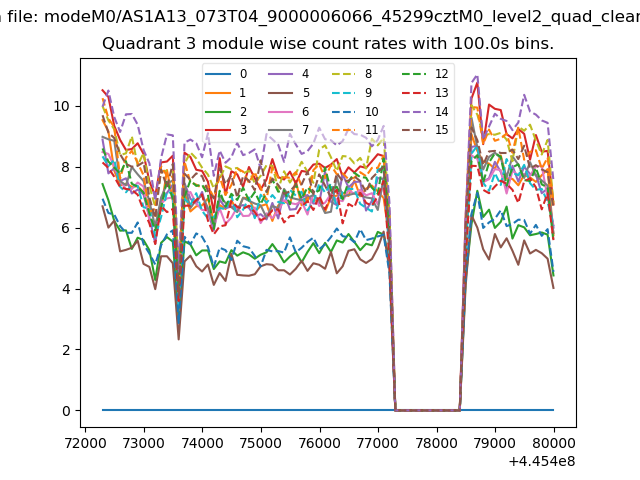 |
 |
| Parameter | Plot |
|---|---|
| CZT HV Monitor | 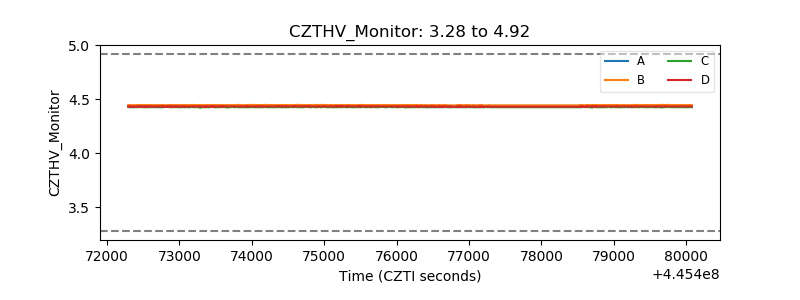 |
| D_VDD | 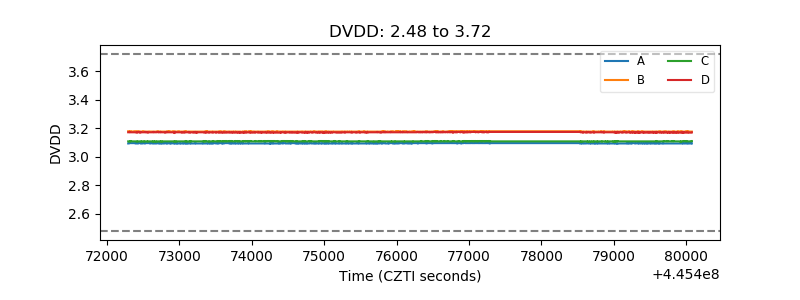 |
| Temperature 1 | 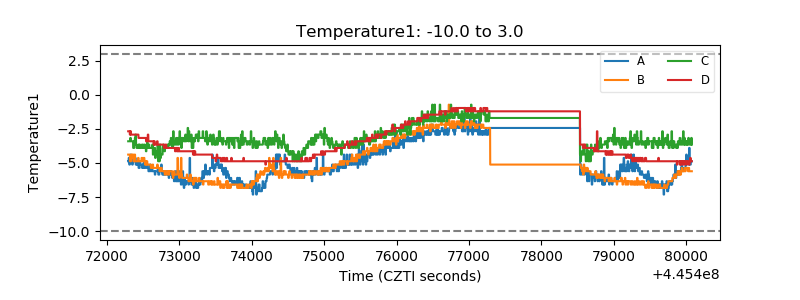 |
| Veto HV Monitor | 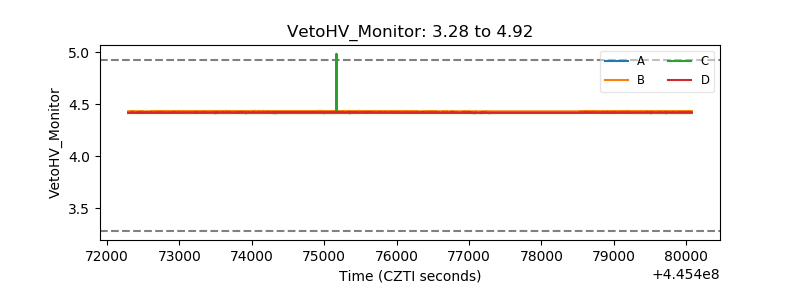 |
| Veto LLD | 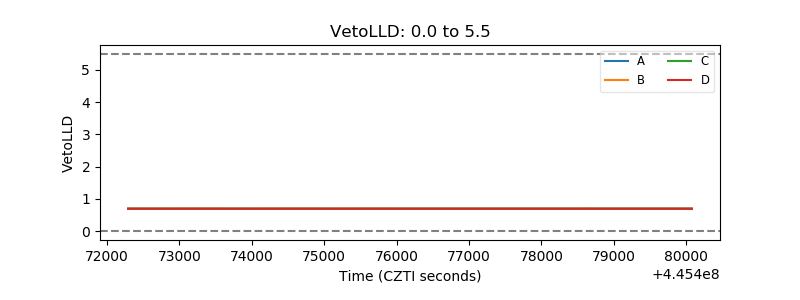 |
| Alpha Counter | 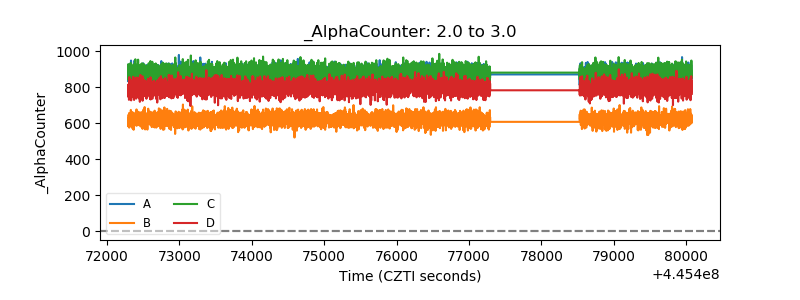 |
| _CPM_Rate | 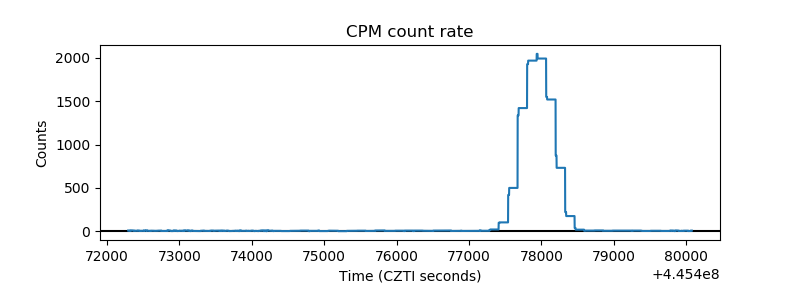 |
| CZT Counter | 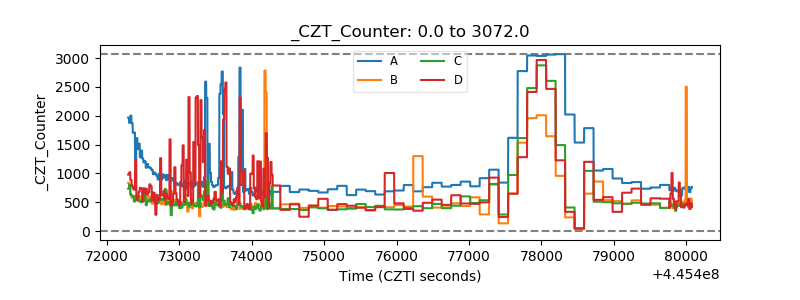 |
| +2.5 Volts monitor | 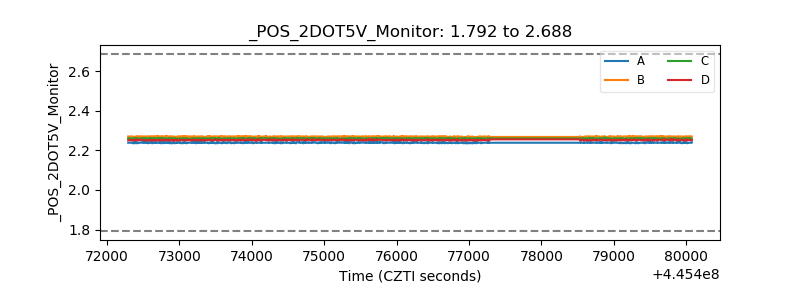 |
| +5 Volts monitor | 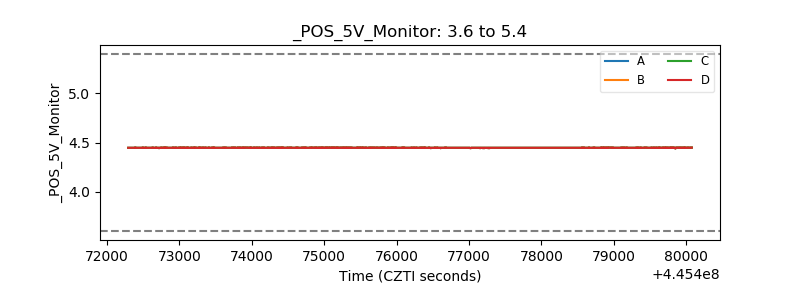 |
| _ROLL_ROT | 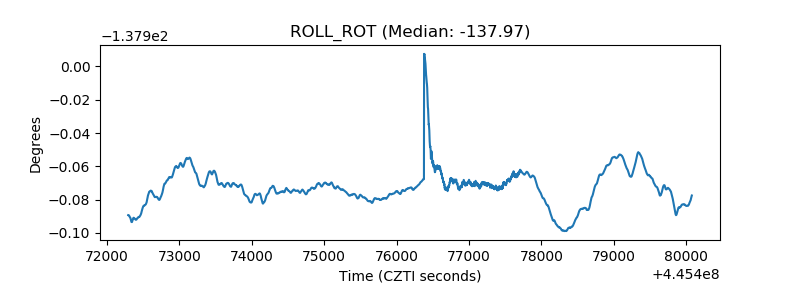 |
| _Roll_DEC | 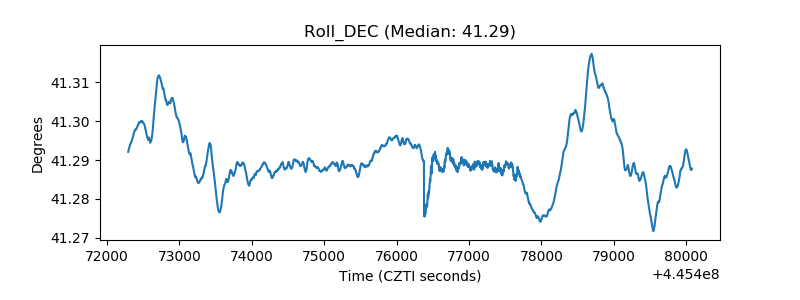 |
| _Roll_RA | 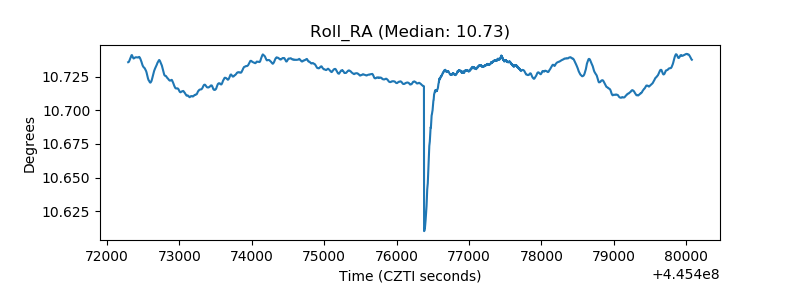 |
| Veto Counter | 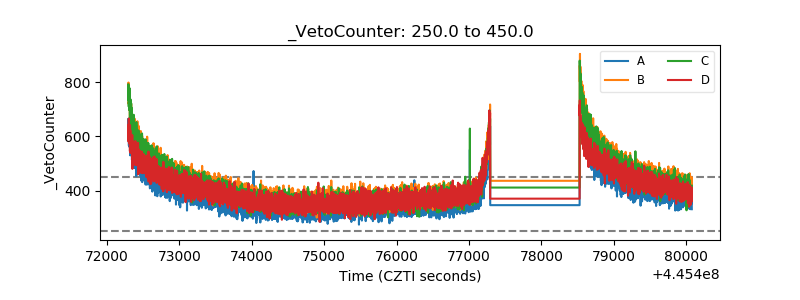 |