| Param | Original file | Final file |
|---|---|---|
| Filename | modeM0/AS1A13_073T04_9000006066_45300cztM0_level2.fits | modeM0/AS1A13_073T04_9000006066_45300cztM0_level2_quad_clean.evt |
| Size (bytes) | 455,238,720 | 118,396,800 |
| Size | 434.1 MB | 112.9 MB |
| Events in quadrant A | 5,627,443 | 782,615 |
| Events in quadrant B | 3,526,562 | 830,476 |
| Events in quadrant C | 3,142,694 | 804,475 |
| Events in quadrant D | 4,046,917 | 711,468 |
| Mode SS | |||
|---|---|---|---|
| Quadrant | BADHDUFLAG | Total packets | Discarded packets |
| A | 0 | 134 | 0 |
| B | 0 | 134 | 0 |
| C | 0 | 134 | 0 |
| D | 0 | 134 | 0 |
| Mode M9 | |||
|---|---|---|---|
| Quadrant | BADHDUFLAG | Total packets | Discarded packets |
| A | 0 | 17 | 0 |
| B | 0 | 17 | 0 |
| C | 0 | 18 | 0 |
| D | 0 | 18 | 0 |
| Mode M0 | |||
|---|---|---|---|
| Quadrant | BADHDUFLAG | Total packets | Discarded packets |
| A | 0 | 21462 | 2 |
| B | 0 | 14637 | 2 |
| C | 0 | 13729 | 2 |
| D | 0 | 16490 | 2 |
| Quadrant | Total seconds | Saturated seconds | Saturation percentage |
|---|---|---|---|
| A | 6541 | 209 | 3.195230% |
| B | 6541 | 128 | 1.956887% |
| C | 6541 | 47 | 0.718545% |
| D | 6541 | 249 | 3.806757% |
Noise dominated data is calculated using 1-second bins in cleaned event files. If a bin has >2000 counts, and if more than 50% of those come from <1% of pixels, then it is considered to be noise-dominated and hence unusable.
| Quadrant | # 1 sec bins | Bins with >0 counts | Bins with >2000 counts | High rate bins dominated by noise | Noise dominated (total time) | Noise dominated (detector-on time) | Marked lightcurve |
|---|---|---|---|---|---|---|---|
| A | 7771 | 6541 | 23 | 23 | 0.30% | 0.35% | 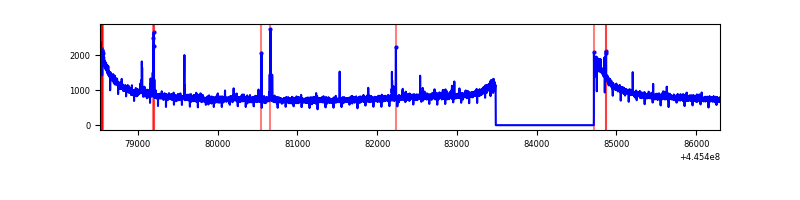 |
| B | 7771 | 6541 | 37 | 37 | 0.48% | 0.57% | 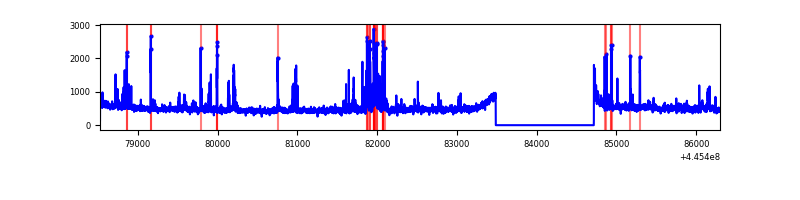 |
| C | 7771 | 6541 | 2 | 2 | 0.03% | 0.03% | 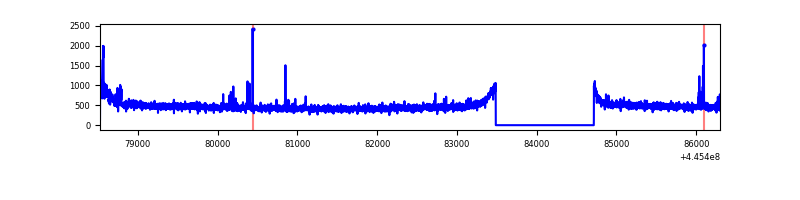 |
| D | 7771 | 6541 | 157 | 157 | 2.02% | 2.40% | 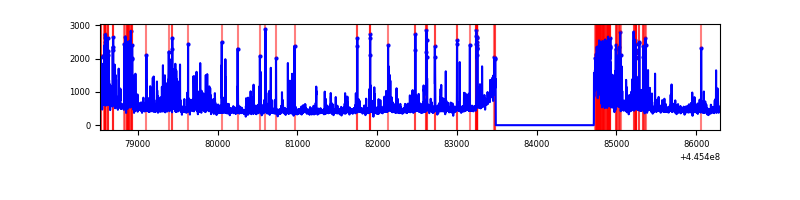 |
Top three noisy pixels from each quadrant. If the there are fewer than three noisy pixels in the level2.evt file, extra rows are filled as -1
| Pixel properties | Quadrant properties | ||||||
|---|---|---|---|---|---|---|---|
| Quadrant | DetID | PixID | Counts | Sigma | Mean | Median | Sigma |
| A | 10 | 83 | 2517166 | 15690.59 | 778 | 763 | 160.4 |
| A | 10 | 248 | 86032 | 531.68 | 778 | 763 | 160.4 |
| A | 0 | 243 | 15791 | 93.7 | 778 | 763 | 160.4 |
| B | 5 | 172 | 168506 | 1119.35 | 786 | 765 | 149.9 |
| B | 5 | 255 | 84046 | 555.74 | 786 | 765 | 149.9 |
| B | 0 | 189 | 66701 | 440.0 | 786 | 765 | 149.9 |
| C | 14 | 254 | 73990 | 404.33 | 778 | 785 | 181.1 |
| C | 3 | 233 | 18180 | 96.08 | 778 | 785 | 181.1 |
| C | 11 | 16 | 13366 | 69.49 | 778 | 785 | 181.1 |
| D | 2 | 249 | 543995 | 2878.6 | 763 | 742 | 188.7 |
| D | 1 | 52 | 201633 | 1064.49 | 763 | 742 | 188.7 |
| D | 13 | 171 | 136129 | 717.39 | 763 | 742 | 188.7 |
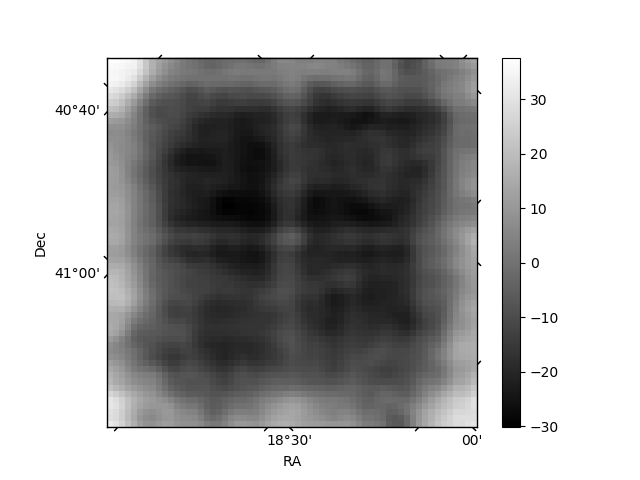
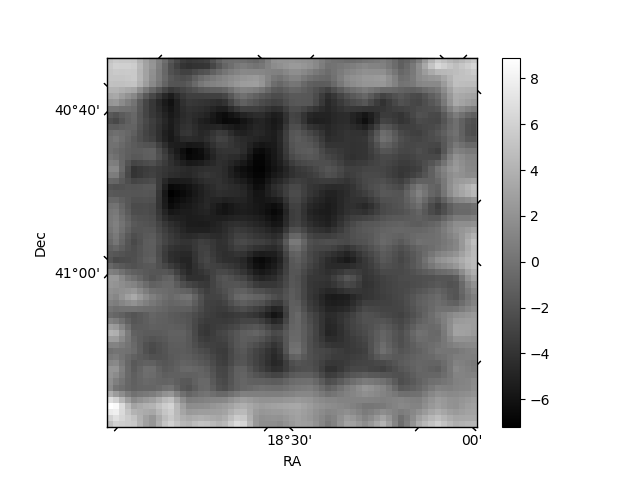
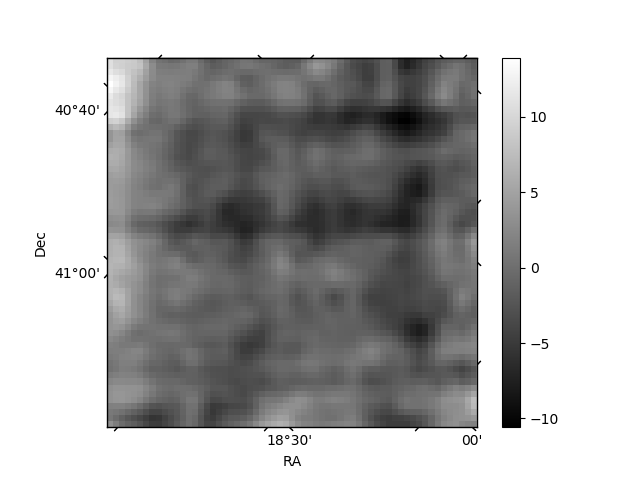
Histogram calculated using DETX and DETY for each event in the final _common_clean file
| Quadrant A | 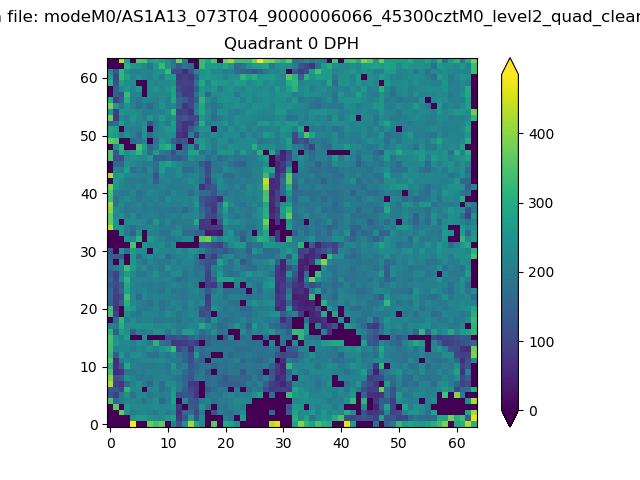 |
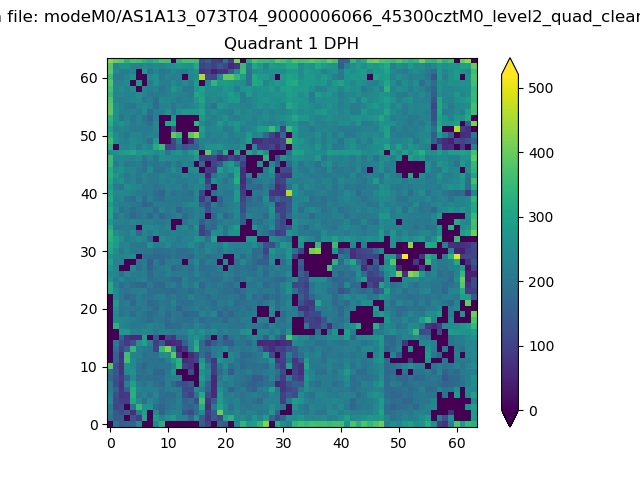 |
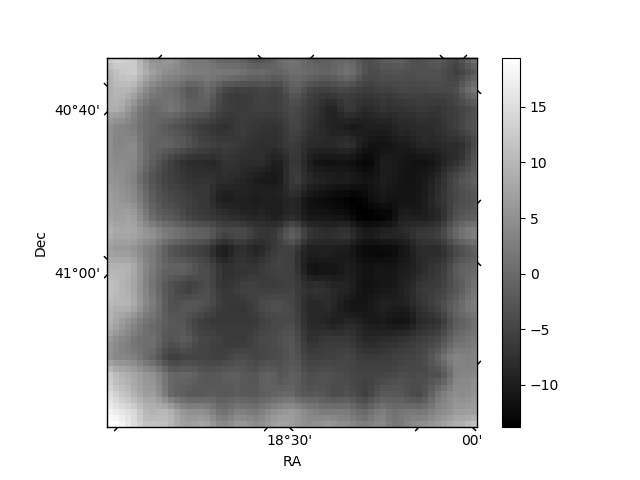
Quadrant B |
|---|---|---|---|
| Quadrant D | 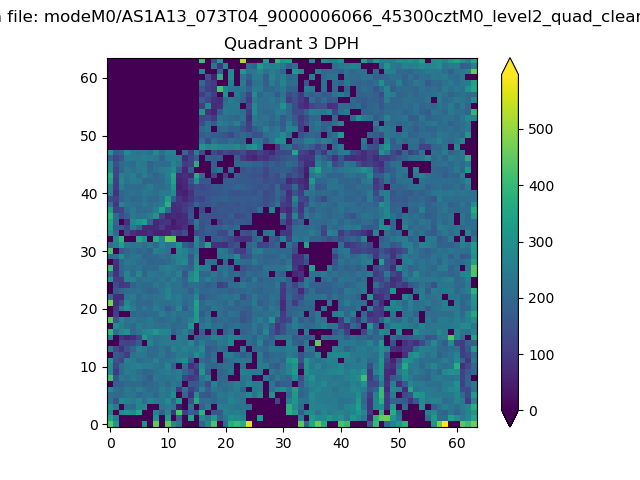 |
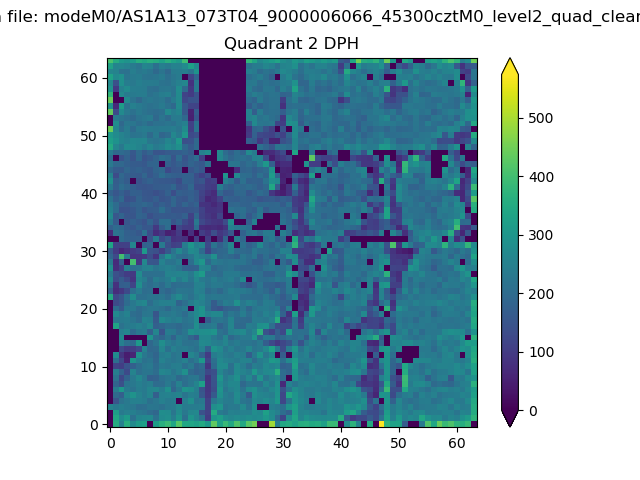 |
Quadrant C |
| Plot type | Count rate plots | Images |
|---|---|---|
| Comparison with Poisson distribution Blue bars denote a histogram of data divided into 1 sec bins. Red curve is a Poisson curve with rate = median count rate of data. |
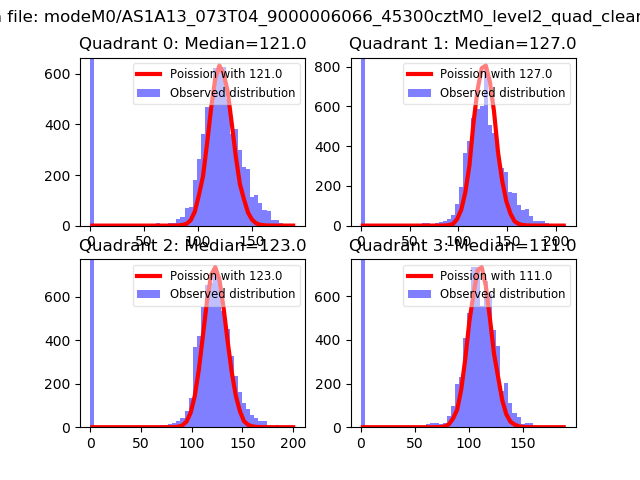 |
 |
| Quadrant-wise count rates Data is divided into 100 sec bins |
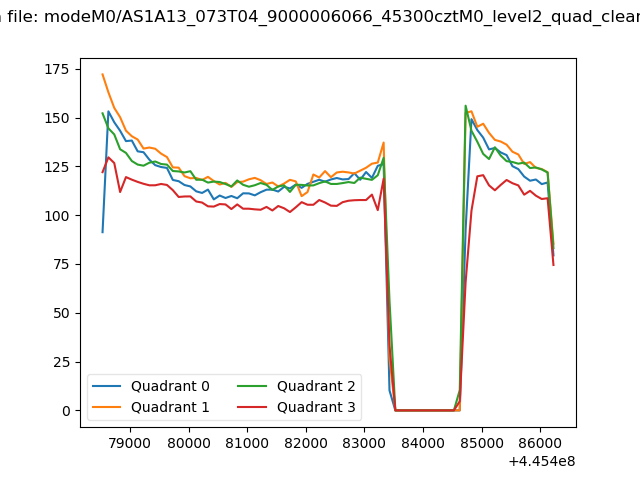 |
|
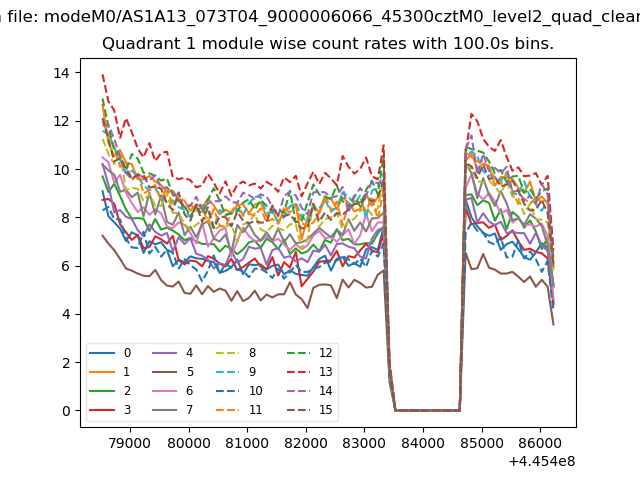
| Module-wise count rates for Quadrant A Data is divided into 100 sec bins |
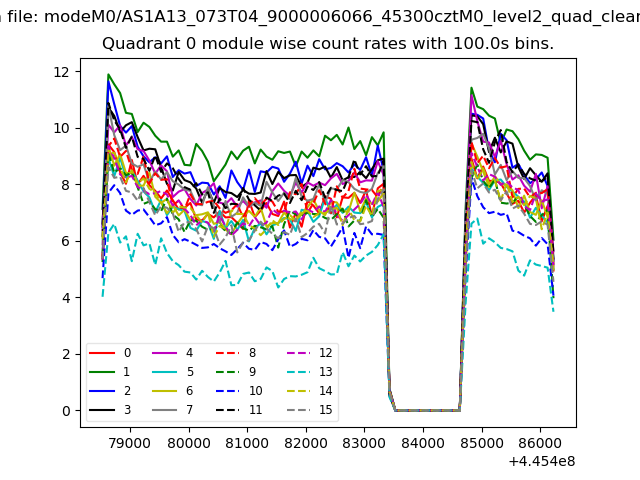 |
 |
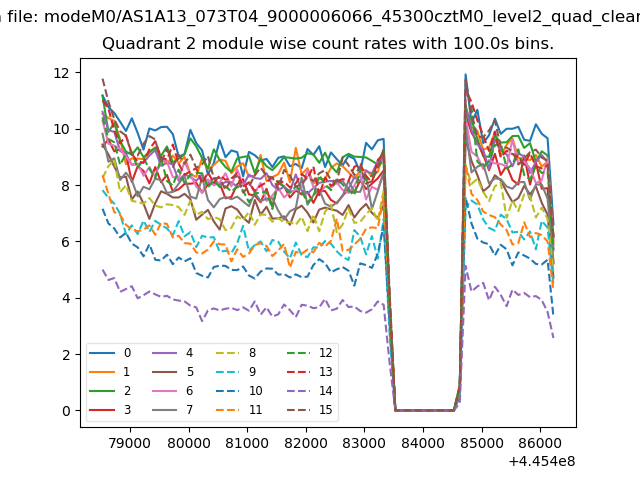
| Module-wise count rates for Quadrant B Data is divided into 100 sec bins |
 |
 |
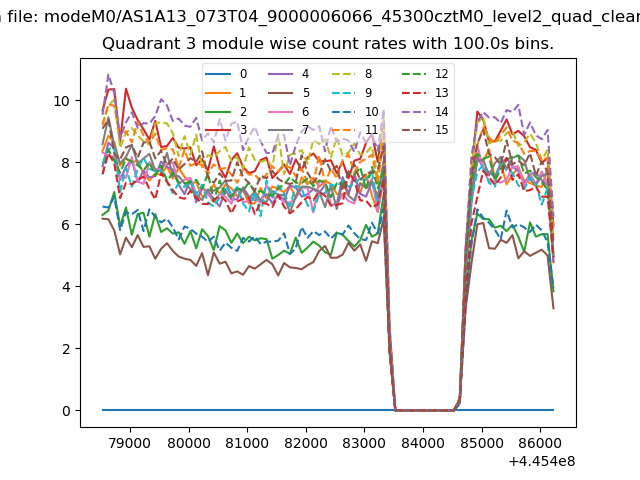
| Module-wise count rates for Quadrant C Data is divided into 100 sec bins |
 |
 |
| Module-wise count rates for Quadrant D Data is divided into 100 sec bins |
 |
 |
| Parameter | Plot |
|---|---|
| CZT HV Monitor | 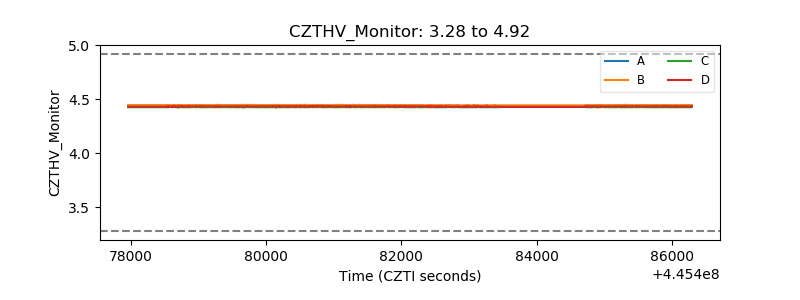 |
| D_VDD | 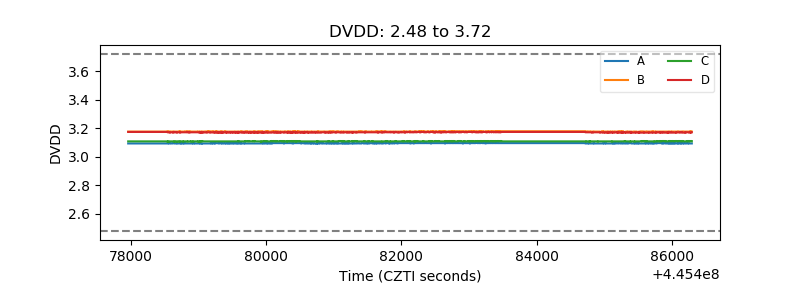 |
| Temperature 1 | 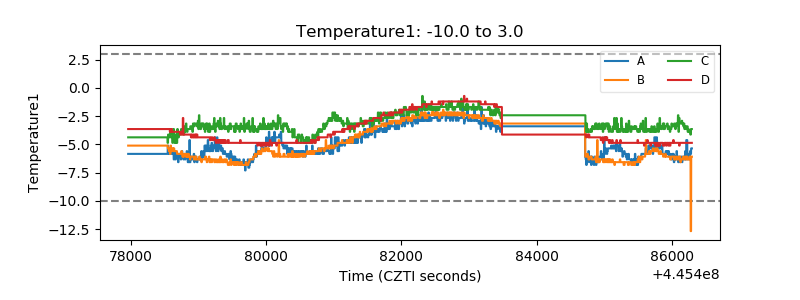 |
| Veto HV Monitor |  |
| Veto LLD | 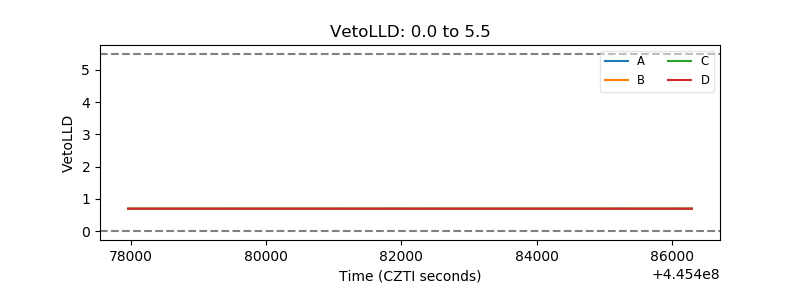 |
| Alpha Counter | 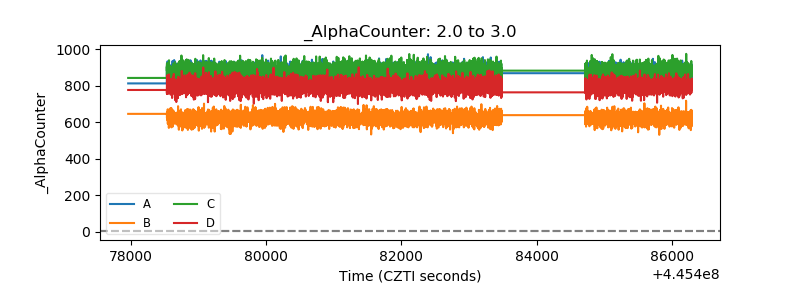 |
| _CPM_Rate | 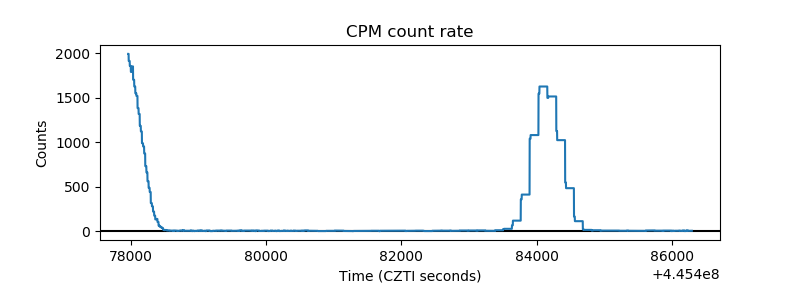 |
| CZT Counter | 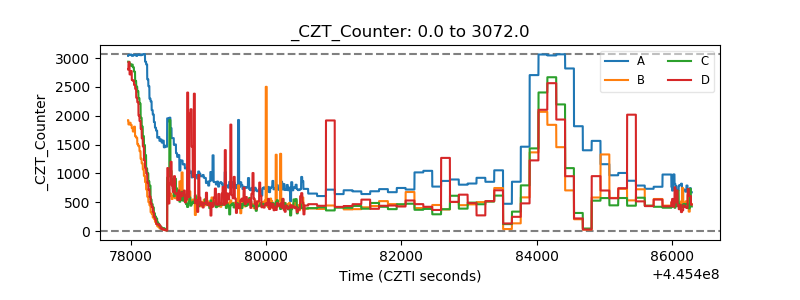 |
| +2.5 Volts monitor | 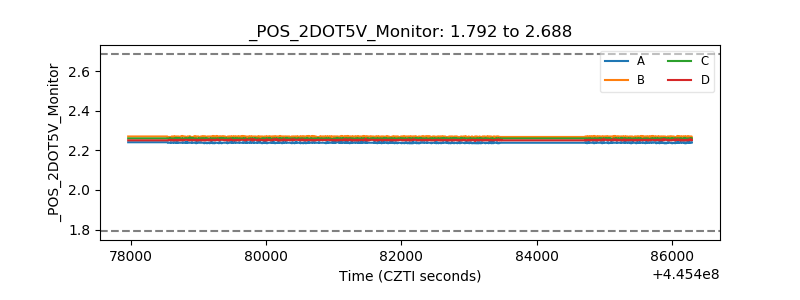 |
| +5 Volts monitor |  |
| _ROLL_ROT | 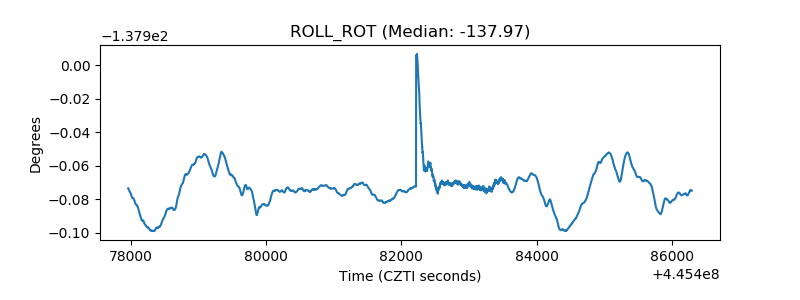 |
| _Roll_DEC | 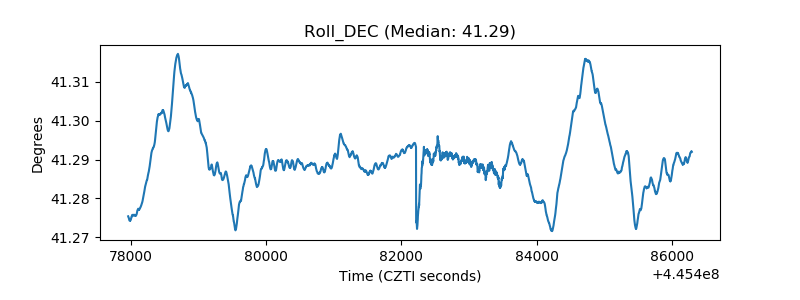 |
| _Roll_RA | 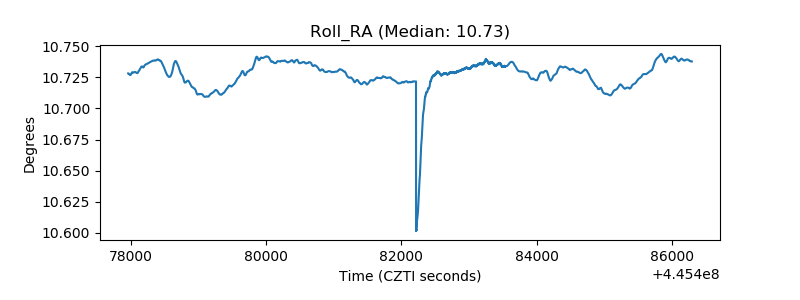 |
| Veto Counter | 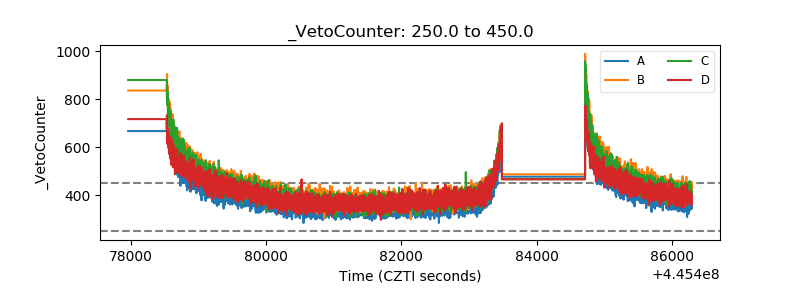 |