| Param | Original file | Final file |
|---|---|---|
| Filename | modeM0/AS1A13_073T04_9000006066_45303cztM0_level2.fits | modeM0/AS1A13_073T04_9000006066_45303cztM0_level2_quad_clean.evt |
| Size (bytes) | 506,649,600 | 110,643,840 |
| Size | 483.2 MB | 105.5 MB |
| Events in quadrant A | 5,548,336 | 731,235 |
| Events in quadrant B | 3,194,193 | 765,715 |
| Events in quadrant C | 3,166,305 | 748,716 |
| Events in quadrant D | 6,313,052 | 626,764 |
| Mode SS | |||
|---|---|---|---|
| Quadrant | BADHDUFLAG | Total packets | Discarded packets |
| A | 0 | 140 | 0 |
| B | 0 | 140 | 0 |
| C | 0 | 140 | 0 |
| D | 0 | 140 | 0 |
| Mode M9 | |||
|---|---|---|---|
| Quadrant | BADHDUFLAG | Total packets | Discarded packets |
| A | 0 | 7 | 0 |
| B | 0 | 7 | 0 |
| C | 0 | 7 | 0 |
| D | 0 | 7 | 0 |
| Mode M0 | |||
|---|---|---|---|
| Quadrant | BADHDUFLAG | Total packets | Discarded packets |
| A | 0 | 21437 | 12 |
| B | 0 | 14344 | 3 |
| C | 0 | 14505 | 9 |
| D | 0 | 23485 | 9 |
| Quadrant | Total seconds | Saturated seconds | Saturation percentage |
|---|---|---|---|
| A | 6861 | 219 | 3.191955% |
| B | 6863 | 149 | 2.171062% |
| C | 6862 | 68 | 0.990965% |
| D | 6862 | 757 | 11.031769% |
Noise dominated data is calculated using 1-second bins in cleaned event files. If a bin has >2000 counts, and if more than 50% of those come from <1% of pixels, then it is considered to be noise-dominated and hence unusable.
| Quadrant | # 1 sec bins | Bins with >0 counts | Bins with >2000 counts | High rate bins dominated by noise | Noise dominated (total time) | Noise dominated (detector-on time) | Marked lightcurve |
|---|---|---|---|---|---|---|---|
| A | 7489 | 6864 | 19 | 19 | 0.25% | 0.28% | 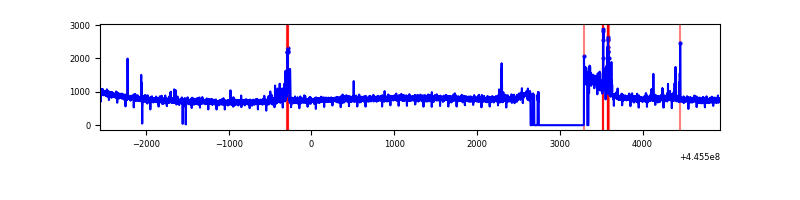 |
| B | 7489 | 6864 | 18 | 18 | 0.24% | 0.26% | 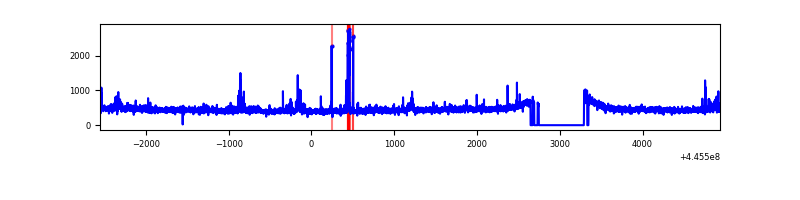 |
| C | 7490 | 6868 | 11 | 11 | 0.15% | 0.16% | 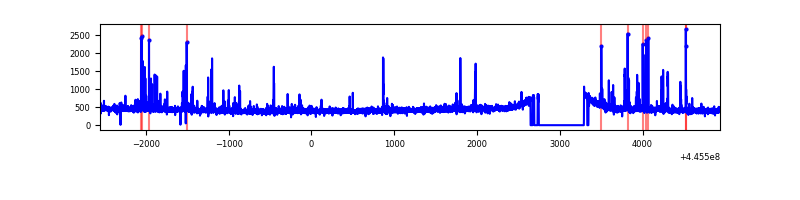 |
| D | 7490 | 6865 | 648 | 648 | 8.65% | 9.44% | 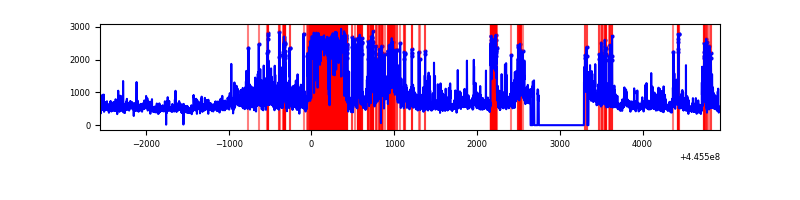 |
Top three noisy pixels from each quadrant. If the there are fewer than three noisy pixels in the level2.evt file, extra rows are filled as -1
| Pixel properties | Quadrant properties | ||||||
|---|---|---|---|---|---|---|---|
| Quadrant | DetID | PixID | Counts | Sigma | Mean | Median | Sigma |
| A | 10 | 83 | 2454366 | 15572.04 | 757 | 741 | 157.6 |
| A | 10 | 248 | 153795 | 971.36 | 757 | 741 | 157.6 |
| A | 0 | 243 | 8872 | 51.6 | 757 | 741 | 157.6 |
| B | 5 | 32 | 75139 | 495.89 | 762 | 738 | 150.0 |
| B | 5 | 255 | 68199 | 449.63 | 762 | 738 | 150.0 |
| B | 12 | 111 | 19211 | 123.12 | 762 | 738 | 150.0 |
| C | 14 | 254 | 170057 | 962.03 | 751 | 755 | 176.0 |
| C | 3 | 233 | 46181 | 258.12 | 751 | 755 | 176.0 |
| C | 1 | 3 | 11742 | 62.43 | 751 | 755 | 176.0 |
| D | 2 | 249 | 1761630 | 9927.83 | 712 | 692 | 177.4 |
| D | 11 | 241 | 1317509 | 7423.96 | 712 | 692 | 177.4 |
| D | 1 | 52 | 250511 | 1408.43 | 712 | 692 | 177.4 |
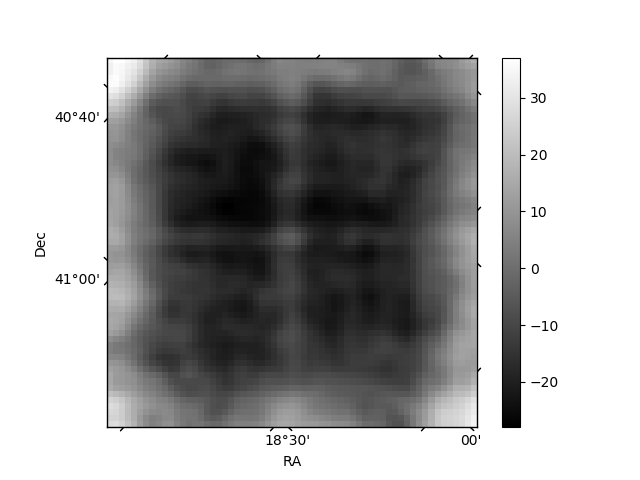
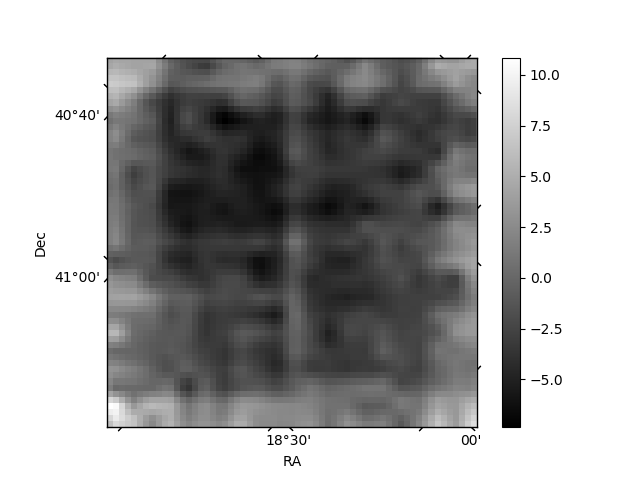
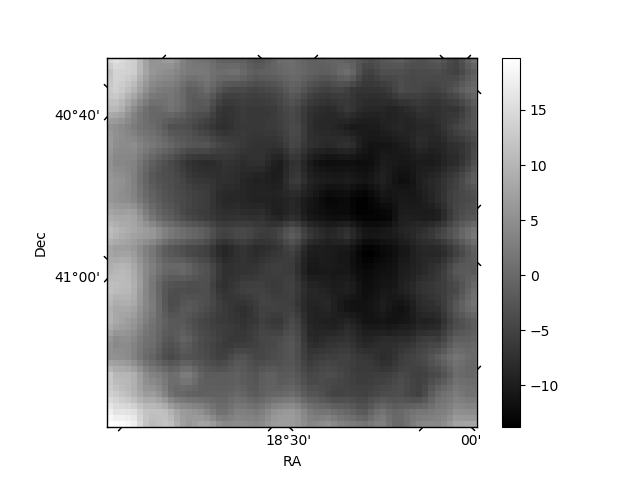
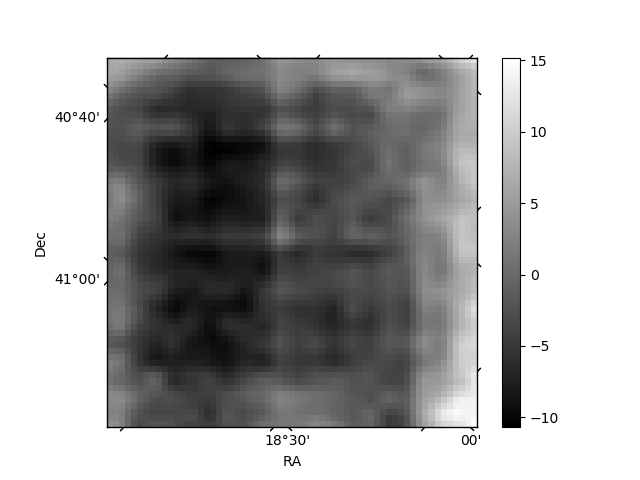
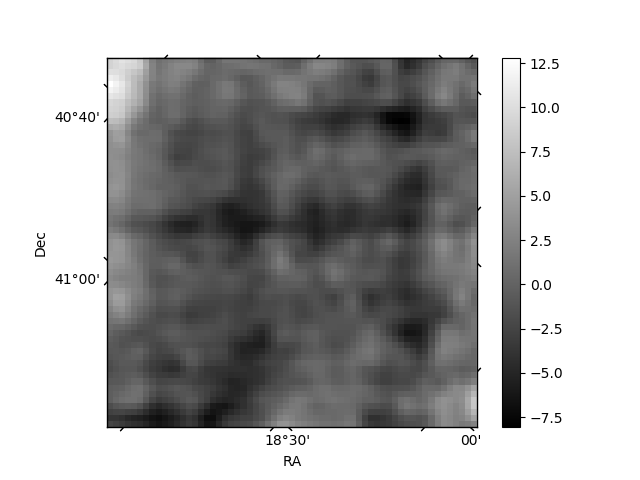
Histogram calculated using DETX and DETY for each event in the final _common_clean file
| Quadrant A | 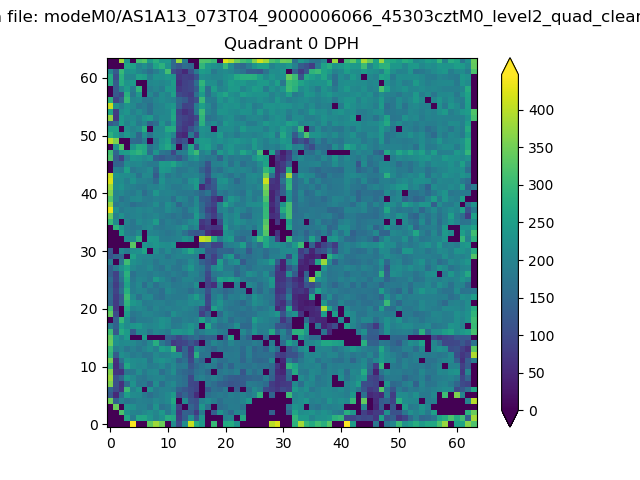 |
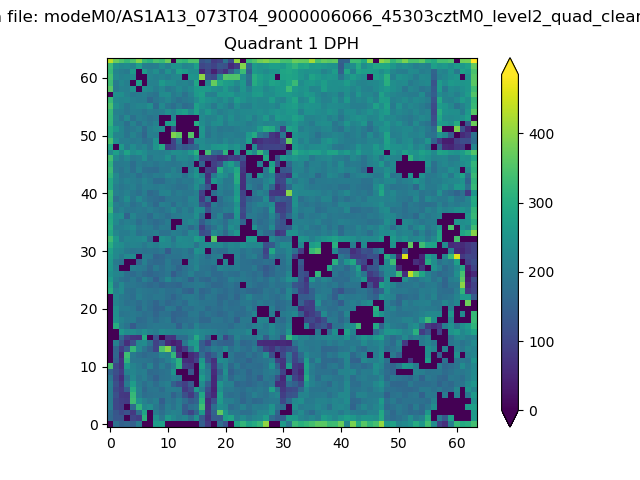 |
Quadrant B |
|---|---|---|---|
| Quadrant D | 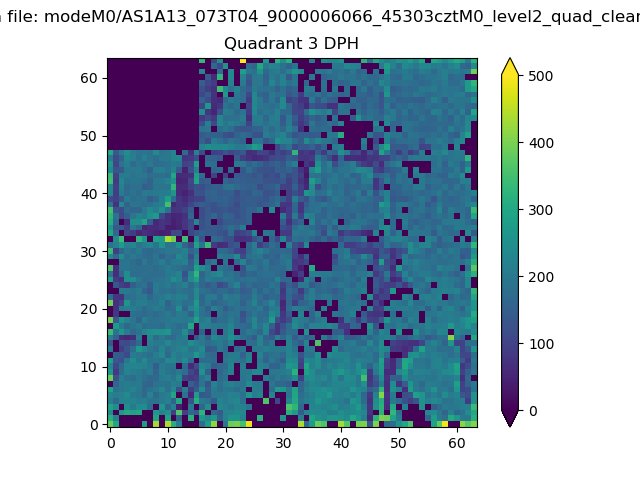 |
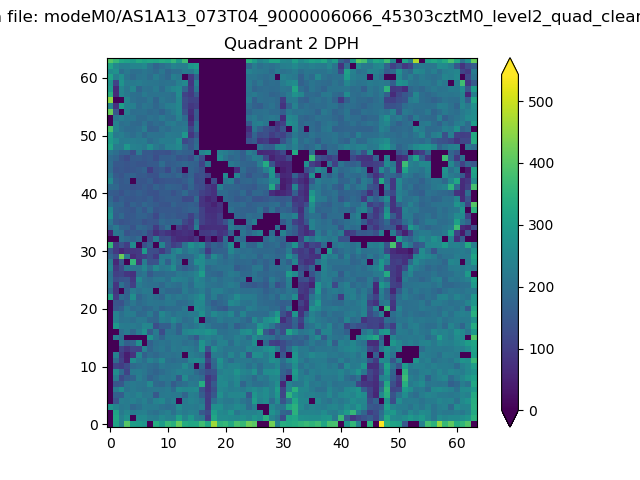 |
Quadrant C |
| Plot type | Count rate plots | Images |
|---|---|---|
| Comparison with Poisson distribution Blue bars denote a histogram of data divided into 1 sec bins. Red curve is a Poisson curve with rate = median count rate of data. |
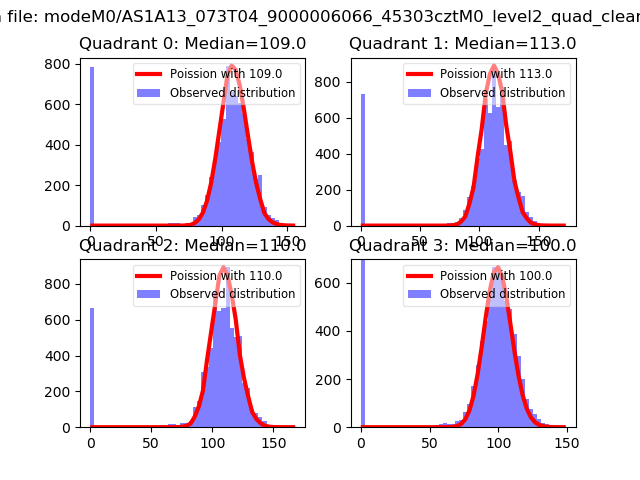 |
 |
| Quadrant-wise count rates Data is divided into 100 sec bins |
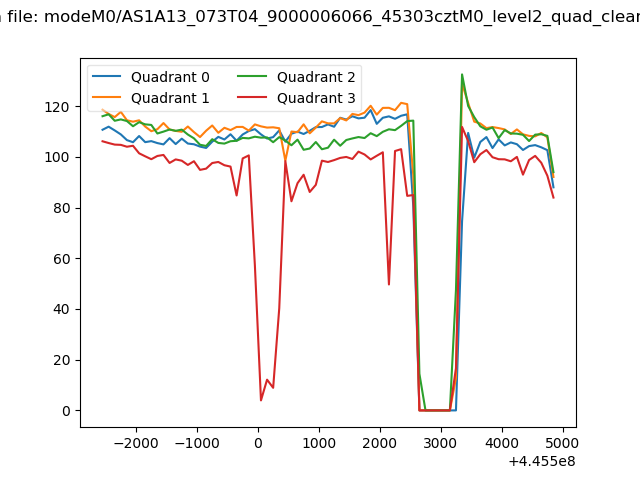 |
|
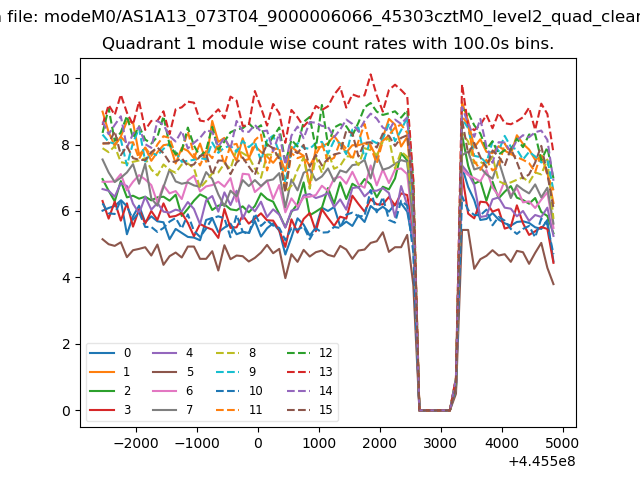
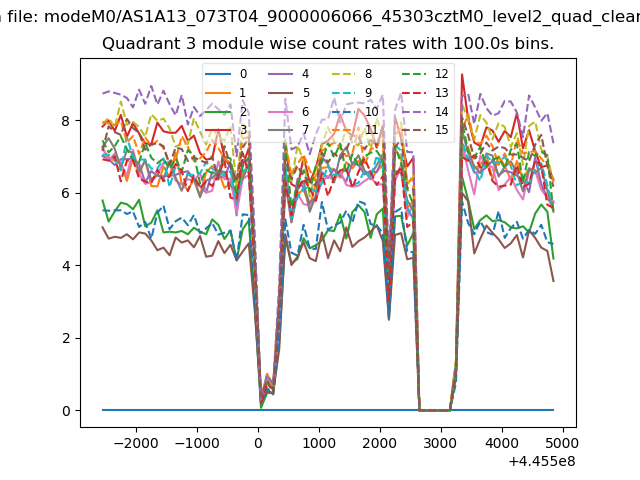
| Module-wise count rates for Quadrant A Data is divided into 100 sec bins |
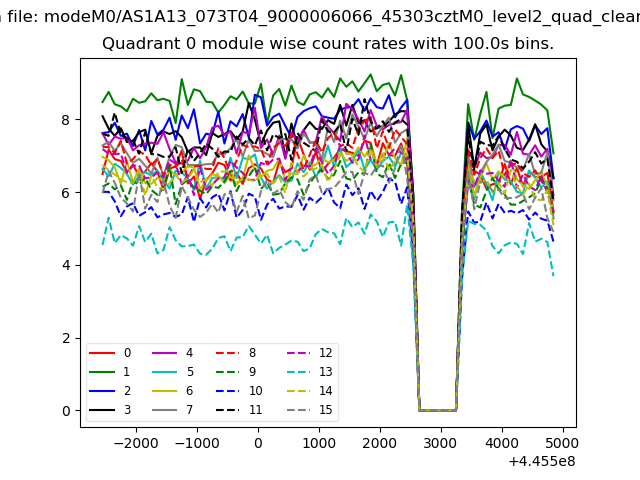 |
 |
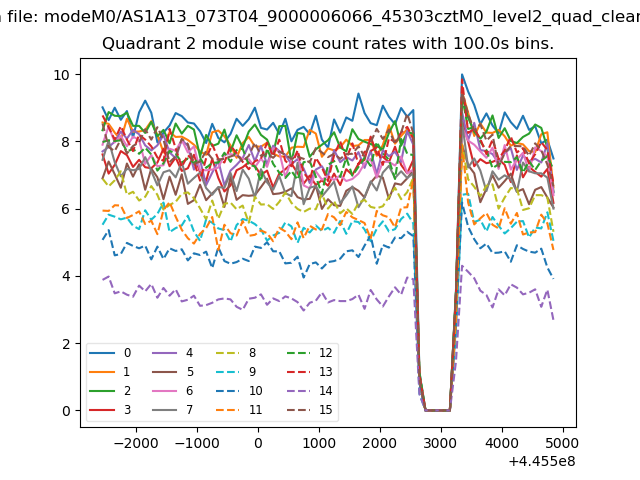
| Module-wise count rates for Quadrant B Data is divided into 100 sec bins |
 |
 |
| Module-wise count rates for Quadrant C Data is divided into 100 sec bins |
 |
 |
| Module-wise count rates for Quadrant D Data is divided into 100 sec bins |
 |
 |
| Parameter | Plot |
|---|---|
| CZT HV Monitor | 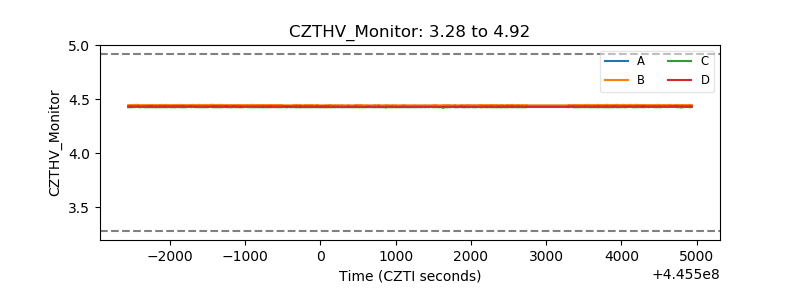 |
| D_VDD | 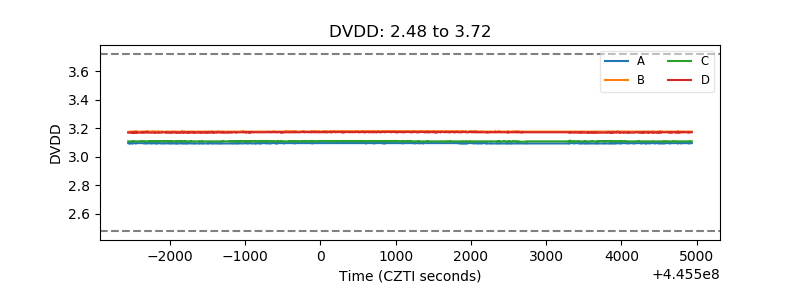 |
| Temperature 1 | 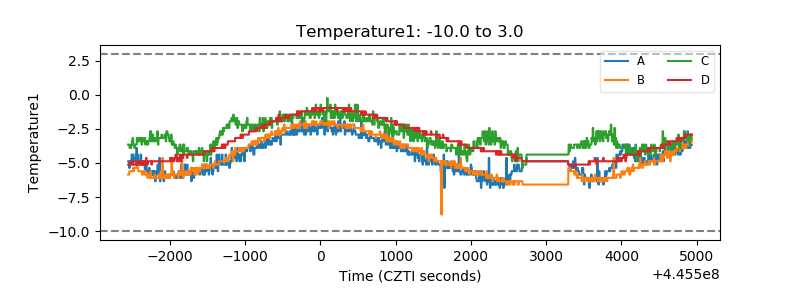 |
| Veto HV Monitor | 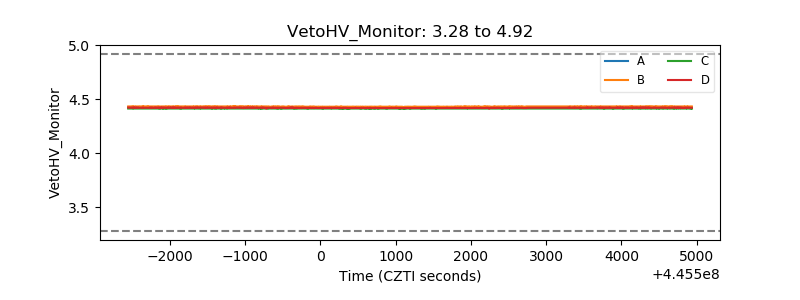 |
| Veto LLD | 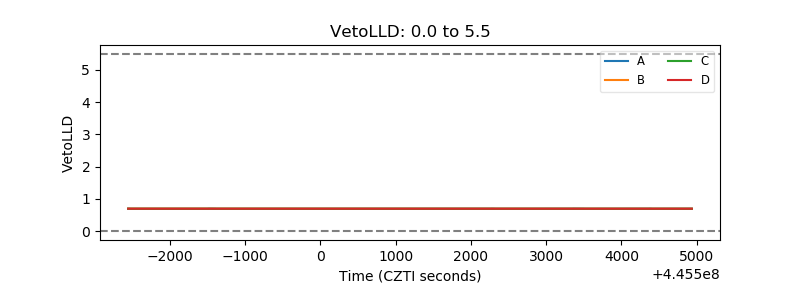 |
| Alpha Counter | 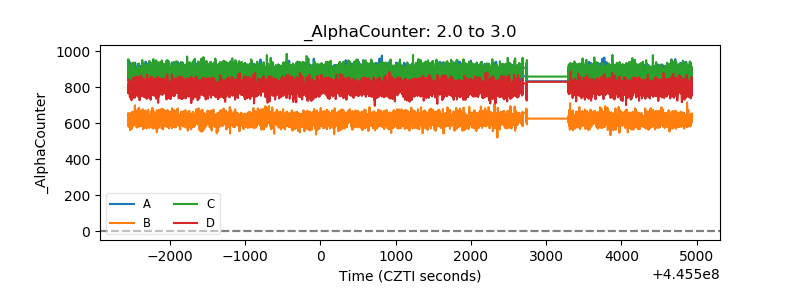 |
| _CPM_Rate | 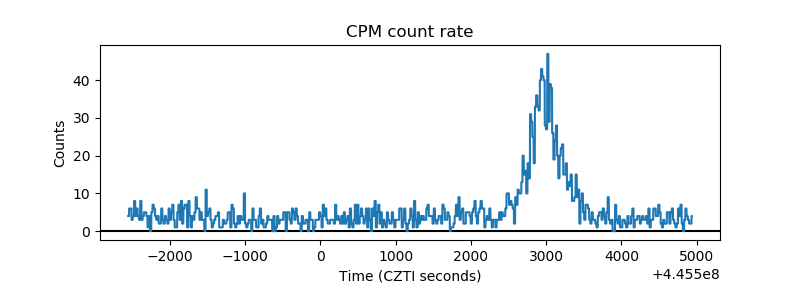 |
| CZT Counter | 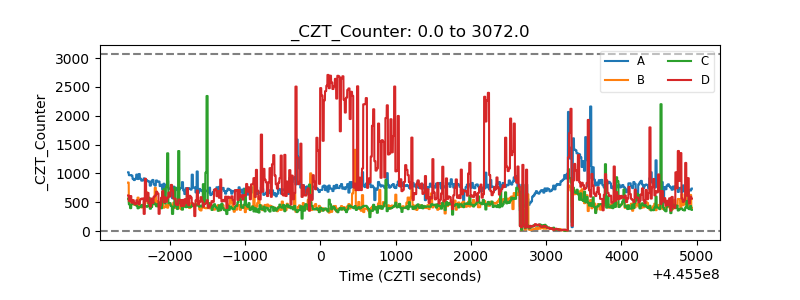 |
| +2.5 Volts monitor | 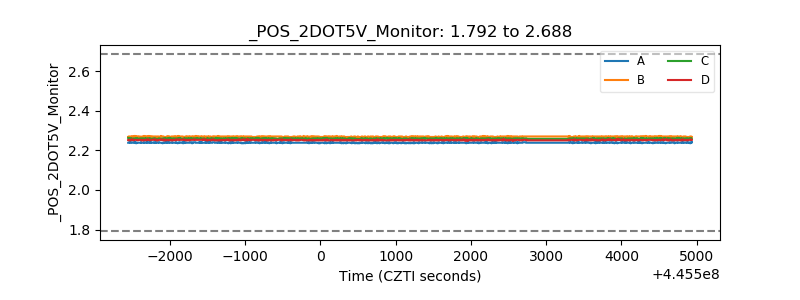 |
| +5 Volts monitor | 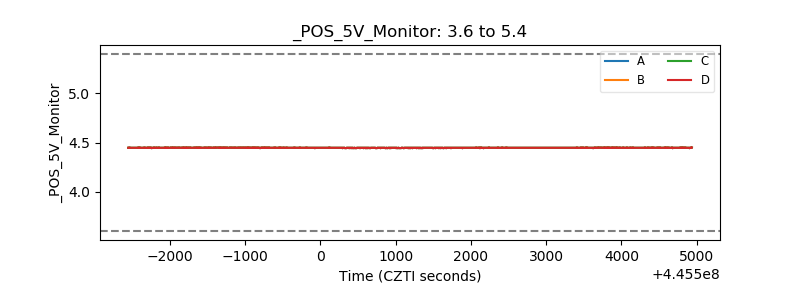 |
| _ROLL_ROT | 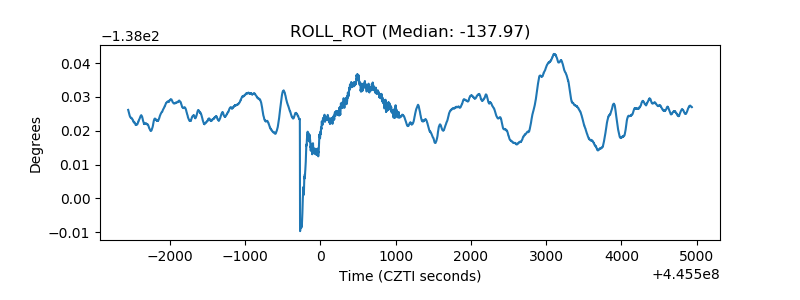 |
| _Roll_DEC | 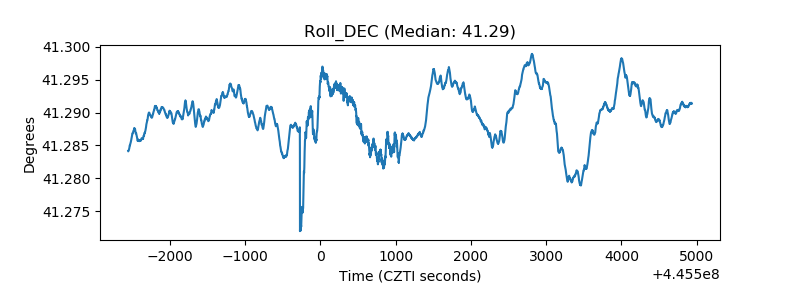 |
| _Roll_RA | 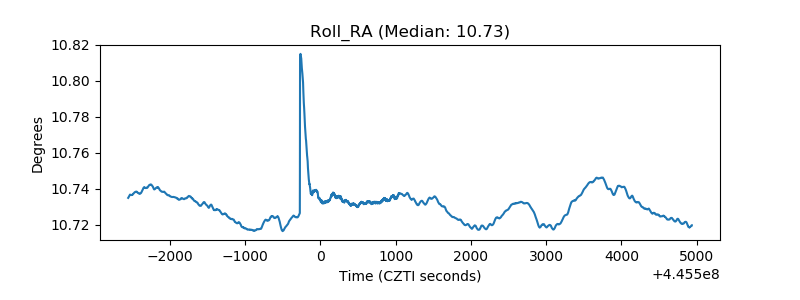 |
| Veto Counter | 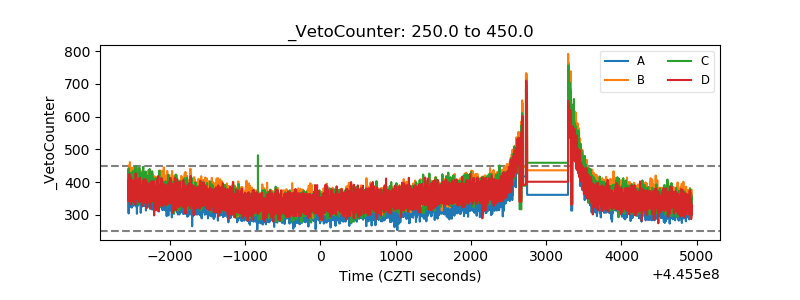 |