| Param | Original file | Final file |
|---|---|---|
| Filename | modeM0/AS1A13_073T04_9000006066_45304cztM0_level2.fits | modeM0/AS1A13_073T04_9000006066_45304cztM0_level2_quad_clean.evt |
| Size (bytes) | 504,887,040 | 117,288,000 |
| Size | 481.5 MB | 111.9 MB |
| Events in quadrant A | 5,625,056 | 772,367 |
| Events in quadrant B | 3,453,711 | 801,450 |
| Events in quadrant C | 3,525,111 | 769,711 |
| Events in quadrant D | 5,527,076 | 706,789 |
| Mode SS | |||
|---|---|---|---|
| Quadrant | BADHDUFLAG | Total packets | Discarded packets |
| A | 0 | 144 | 0 |
| B | 0 | 144 | 0 |
| C | 0 | 144 | 0 |
| D | 0 | 144 | 0 |
| Mode M0 | |||
|---|---|---|---|
| Quadrant | BADHDUFLAG | Total packets | Discarded packets |
| A | 0 | 22028 | 0 |
| B | 0 | 15527 | 0 |
| C | 0 | 15974 | 0 |
| D | 0 | 21373 | 0 |
| Quadrant | Total seconds | Saturated seconds | Saturation percentage |
|---|---|---|---|
| A | 7196 | 130 | 1.806559% |
| B | 7195 | 114 | 1.584434% |
| C | 7196 | 122 | 1.695386% |
| D | 7196 | 185 | 2.570873% |
Noise dominated data is calculated using 1-second bins in cleaned event files. If a bin has >2000 counts, and if more than 50% of those come from <1% of pixels, then it is considered to be noise-dominated and hence unusable.
| Quadrant | # 1 sec bins | Bins with >0 counts | Bins with >2000 counts | High rate bins dominated by noise | Noise dominated (total time) | Noise dominated (detector-on time) | Marked lightcurve |
|---|---|---|---|---|---|---|---|
| A | 7196 | 7196 | 1 | 1 | 0.01% | 0.01% | 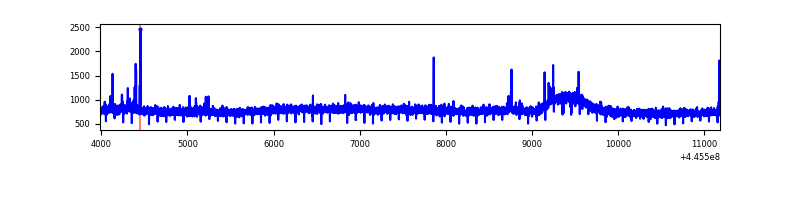 |
| B | 7195 | 7195 | 30 | 30 | 0.42% | 0.42% | 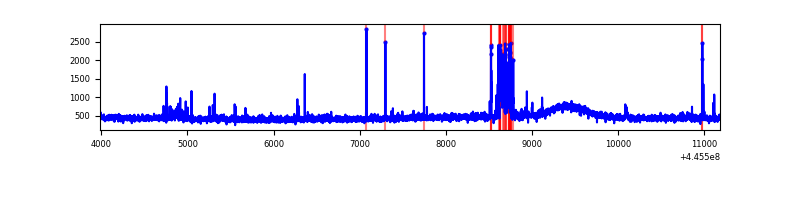 |
| C | 7196 | 7196 | 99 | 99 | 1.38% | 1.38% | 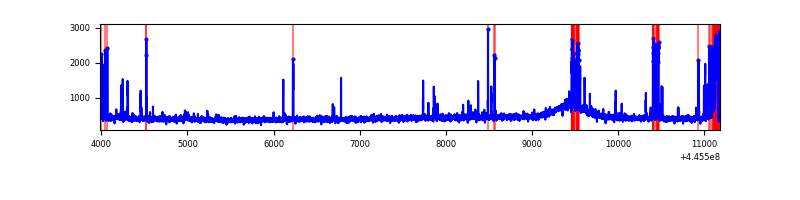 |
| D | 7196 | 7196 | 185 | 185 | 2.57% | 2.57% | 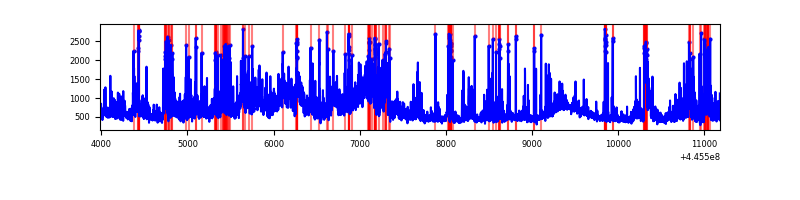 |
Top three noisy pixels from each quadrant. If the there are fewer than three noisy pixels in the level2.evt file, extra rows are filled as -1
| Pixel properties | Quadrant properties | ||||||
|---|---|---|---|---|---|---|---|
| Quadrant | DetID | PixID | Counts | Sigma | Mean | Median | Sigma |
| A | 10 | 83 | 2425851 | 14229.79 | 809 | 788 | 170.4 |
| A | 10 | 248 | 62345 | 361.2 | 809 | 788 | 170.4 |
| A | 3 | 137 | 9555 | 51.44 | 809 | 788 | 170.4 |
| B | 5 | 255 | 178671 | 1113.27 | 804 | 779 | 159.8 |
| B | 5 | 172 | 21891 | 132.12 | 804 | 779 | 159.8 |
| B | 12 | 111 | 20526 | 123.58 | 804 | 779 | 159.8 |
| C | 14 | 254 | 244078 | 1326.76 | 784 | 789 | 183.4 |
| C | 12 | 250 | 195292 | 1060.71 | 784 | 789 | 183.4 |
| C | 1 | 3 | 13426 | 68.91 | 784 | 789 | 183.4 |
| D | 11 | 241 | 998603 | 5139.36 | 788 | 766 | 194.2 |
| D | 1 | 52 | 636661 | 3275.18 | 788 | 766 | 194.2 |
| D | 2 | 249 | 389249 | 2000.88 | 788 | 766 | 194.2 |
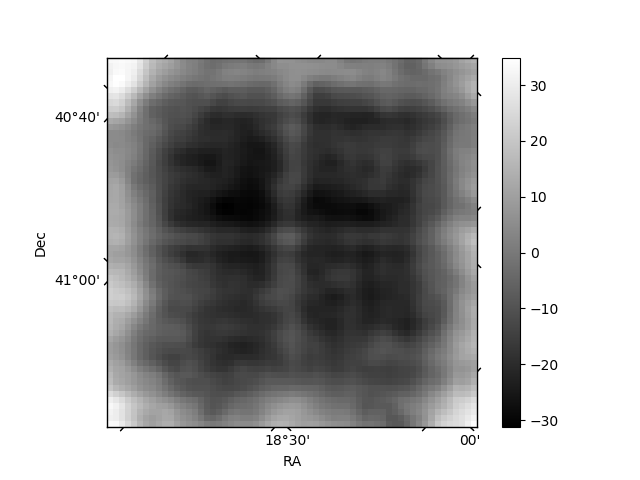
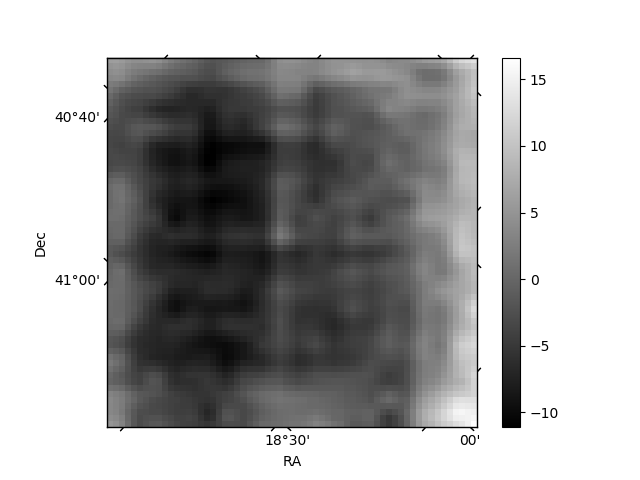
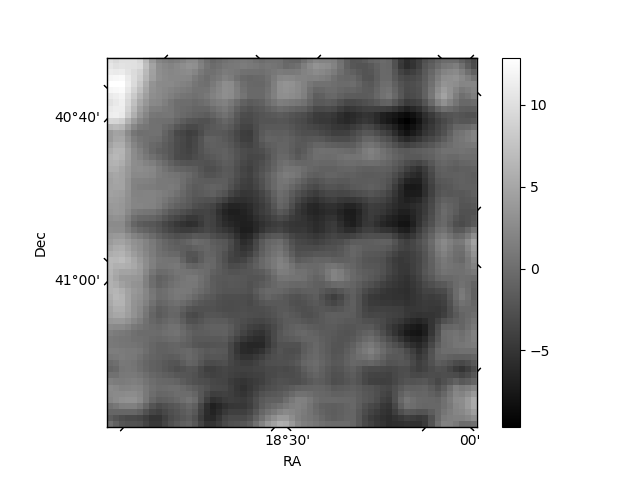
Histogram calculated using DETX and DETY for each event in the final _common_clean file
| Quadrant A | 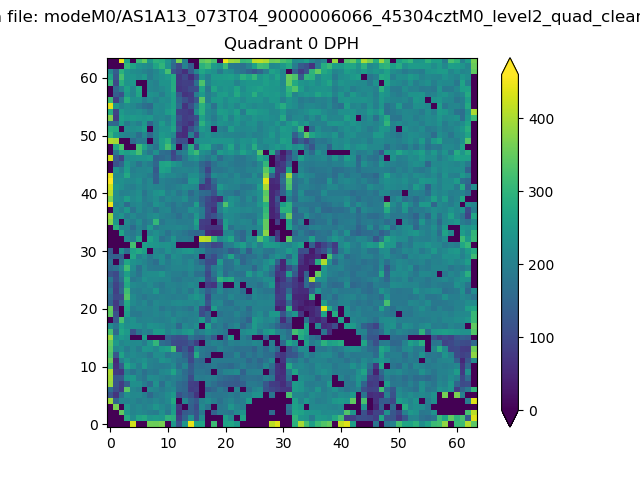 |
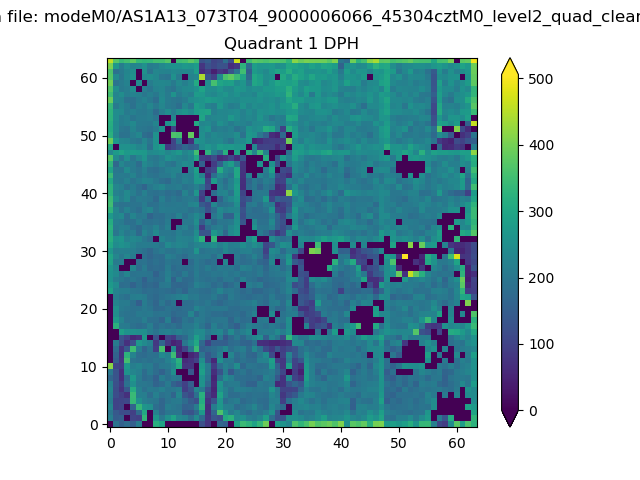 |
Quadrant B |
|---|---|---|---|
| Quadrant D | 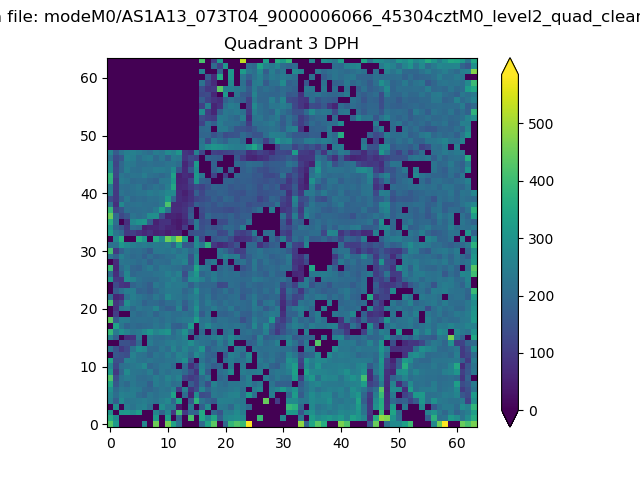 |
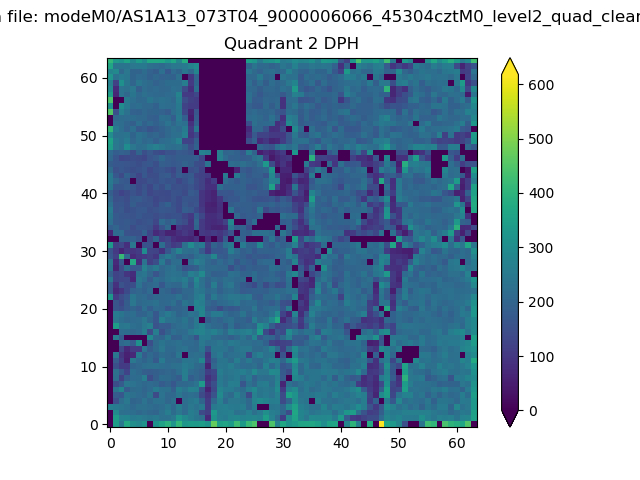 |
Quadrant C |
| Plot type | Count rate plots | Images |
|---|---|---|
| Comparison with Poisson distribution Blue bars denote a histogram of data divided into 1 sec bins. Red curve is a Poisson curve with rate = median count rate of data. |
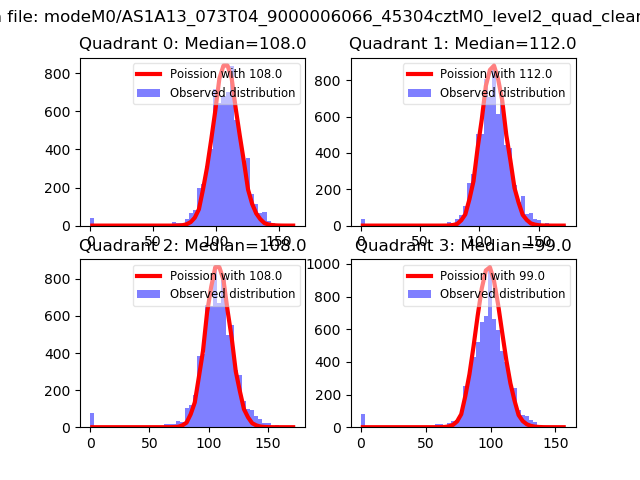 |
 |
| Quadrant-wise count rates Data is divided into 100 sec bins |
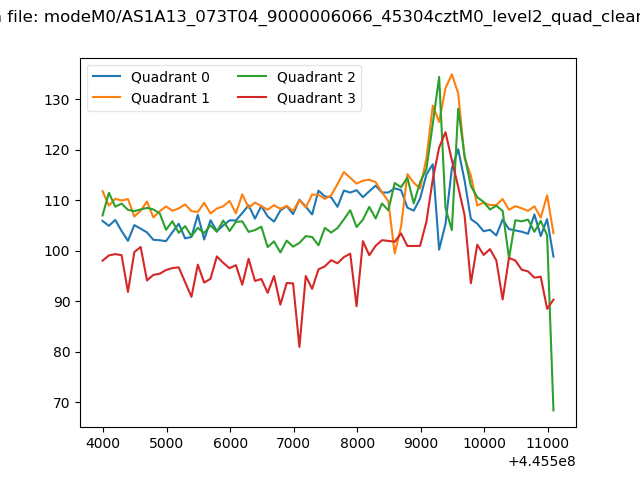 |
|
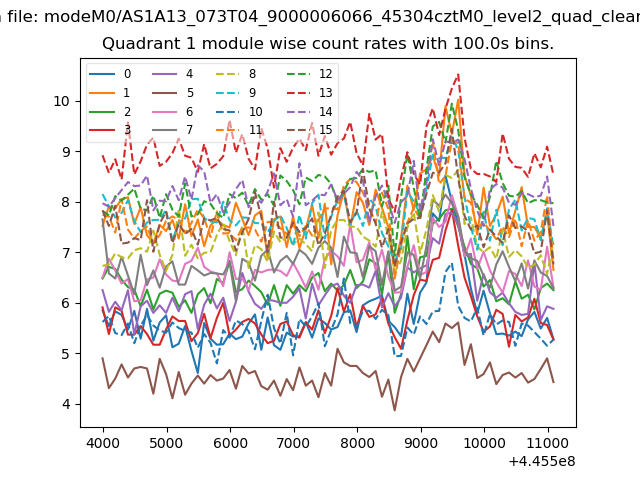
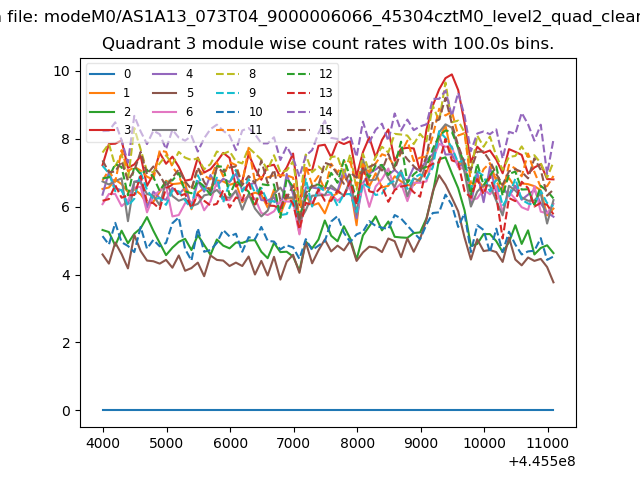
| Module-wise count rates for Quadrant A Data is divided into 100 sec bins |
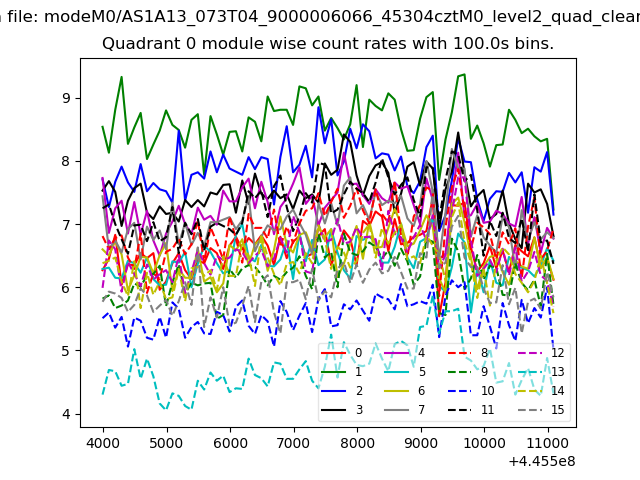 |
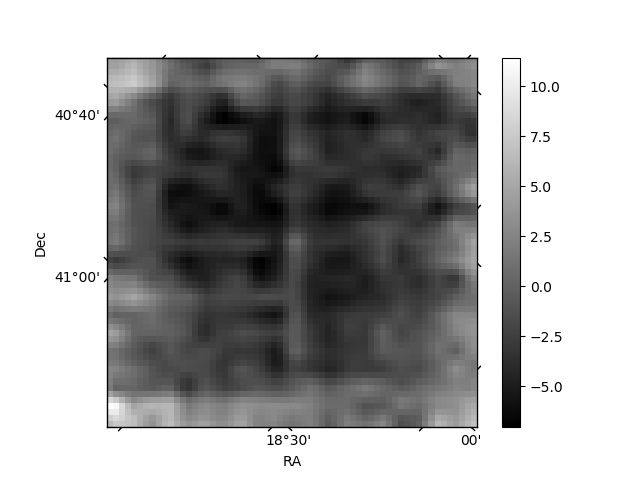 |
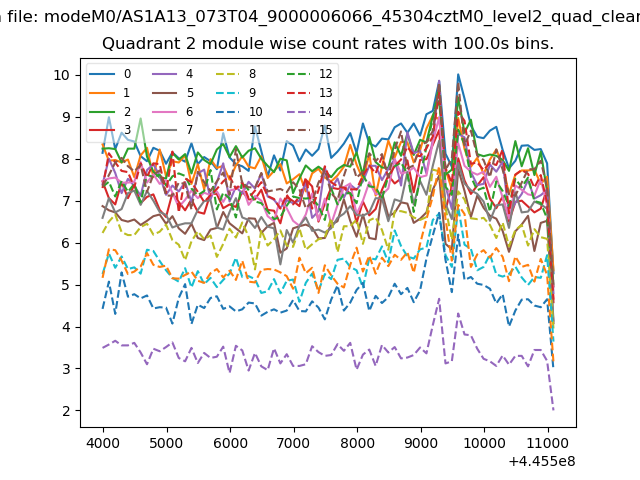
| Module-wise count rates for Quadrant B Data is divided into 100 sec bins |
 |
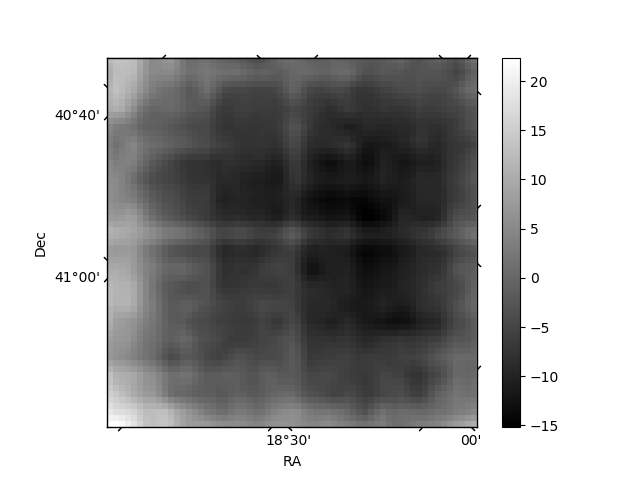 |
| Module-wise count rates for Quadrant C Data is divided into 100 sec bins |
 |
 |
| Module-wise count rates for Quadrant D Data is divided into 100 sec bins |
 |
 |
| Parameter | Plot |
|---|---|
| CZT HV Monitor | 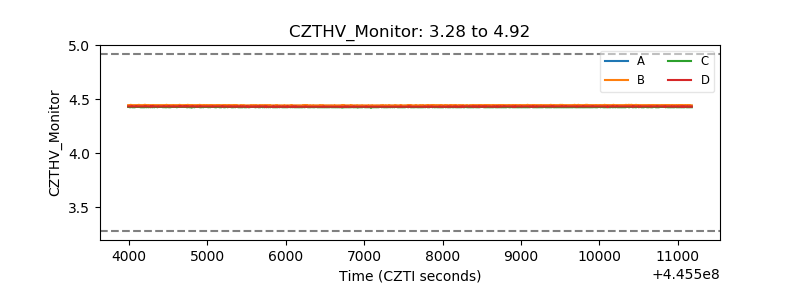 |
| D_VDD | 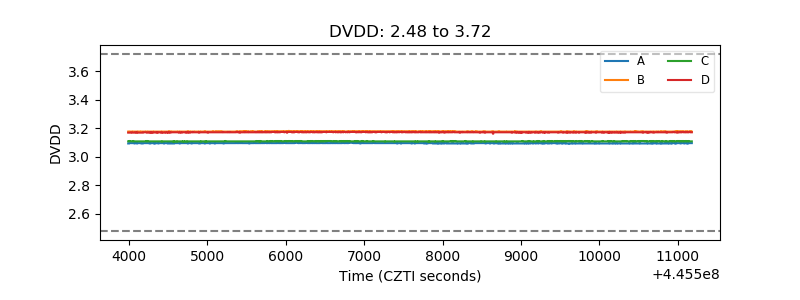 |
| Temperature 1 | 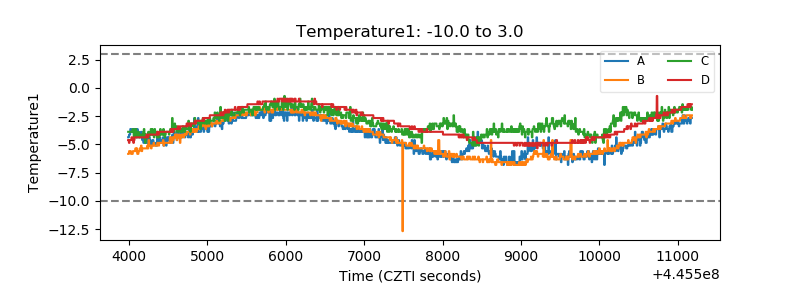 |
| Veto HV Monitor | 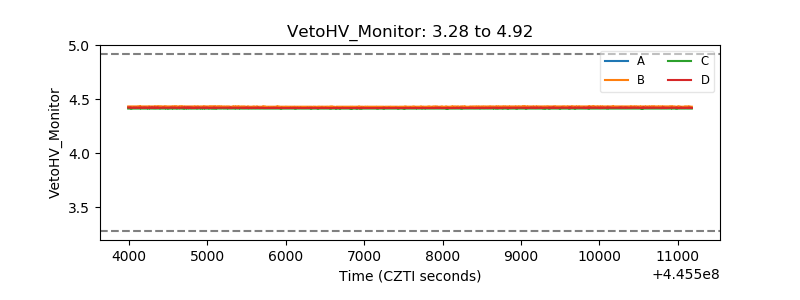 |
| Veto LLD | 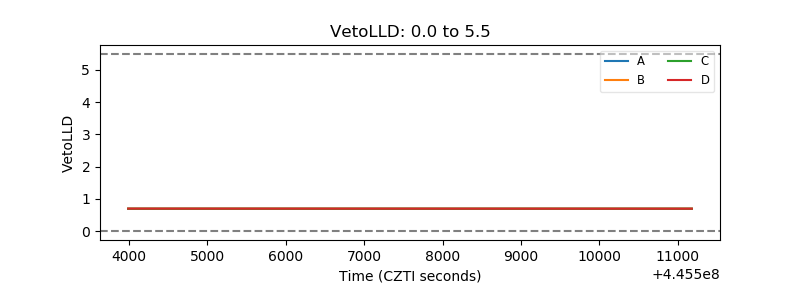 |
| Alpha Counter | 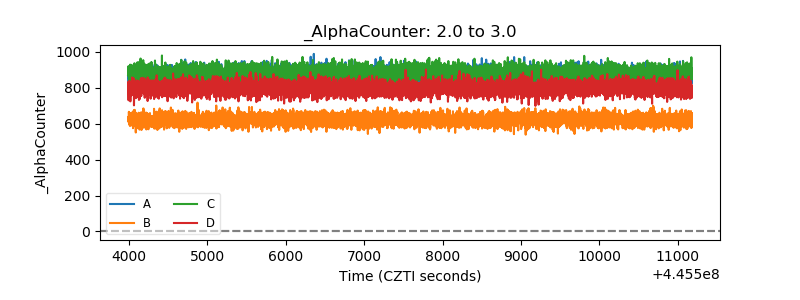 |
| _CPM_Rate | 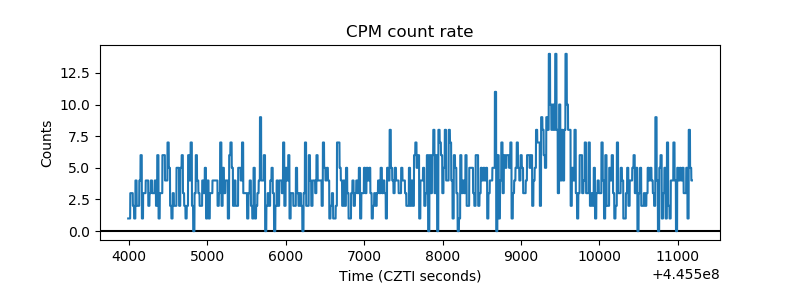 |
| CZT Counter | 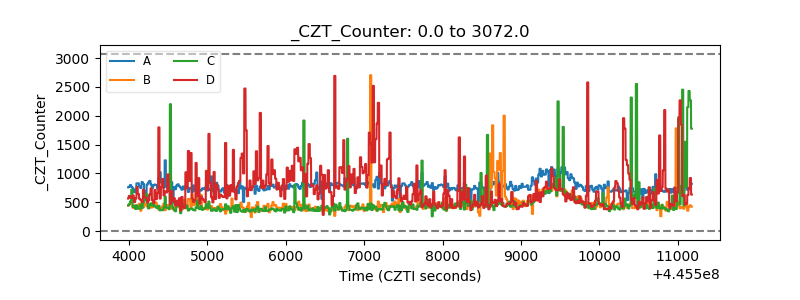 |
| +2.5 Volts monitor | 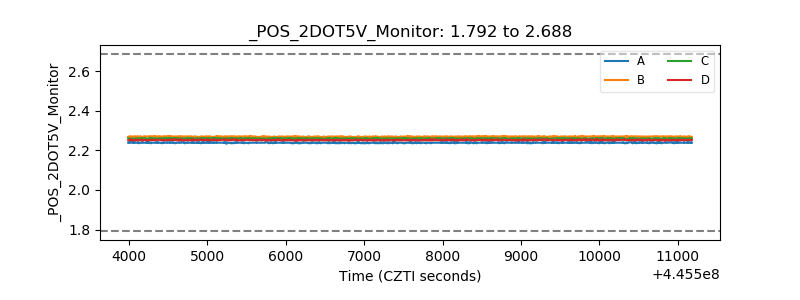 |
| +5 Volts monitor | 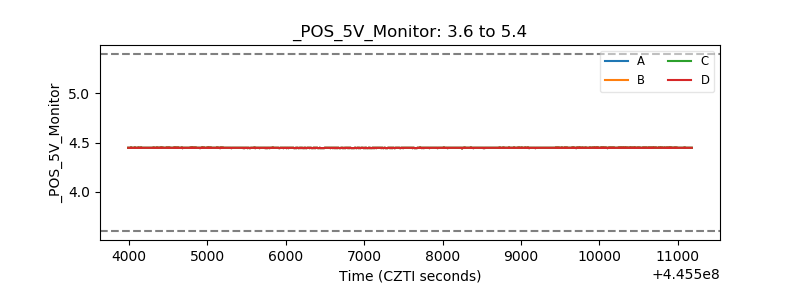 |
| _ROLL_ROT | 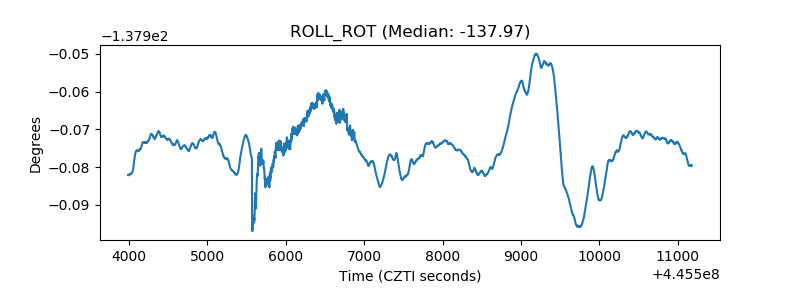 |
| _Roll_DEC | 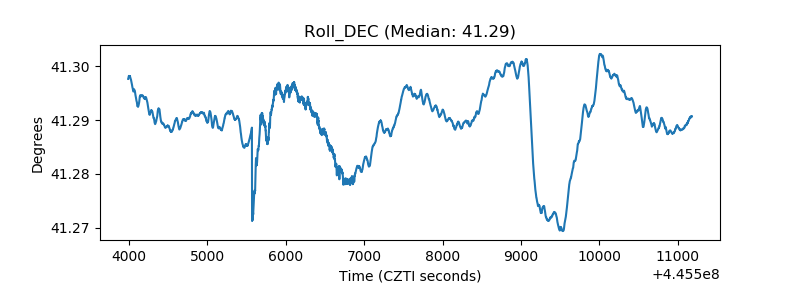 |
| _Roll_RA | 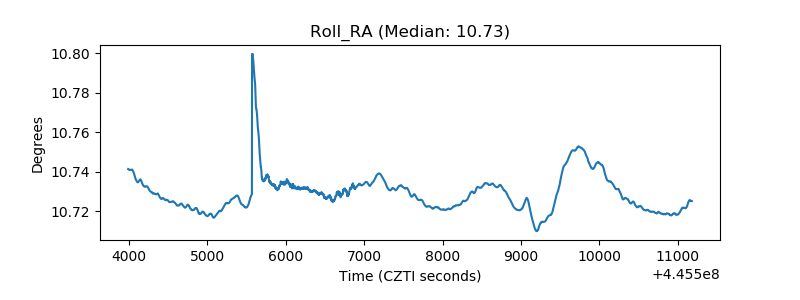 |
| Veto Counter | 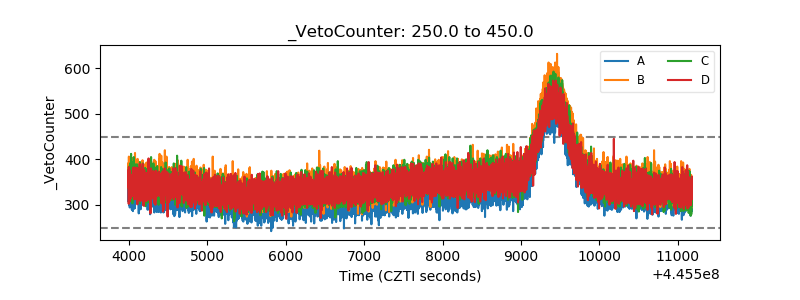 |