| Param | Original file | Final file |
|---|---|---|
| Filename | modeM0/AS1A13_073T04_9000006066_45305cztM0_level2.fits | modeM0/AS1A13_073T04_9000006066_45305cztM0_level2_quad_clean.evt |
| Size (bytes) | 510,719,040 | 115,793,280 |
| Size | 487.1 MB | 110.4 MB |
| Events in quadrant A | 5,922,258 | 766,489 |
| Events in quadrant B | 3,256,625 | 795,415 |
| Events in quadrant C | 4,033,468 | 749,313 |
| Events in quadrant D | 5,133,934 | 693,111 |
| Mode SS | |||
|---|---|---|---|
| Quadrant | BADHDUFLAG | Total packets | Discarded packets |
| A | 0 | 144 | 0 |
| B | 0 | 144 | 0 |
| C | 0 | 144 | 0 |
| D | 0 | 144 | 0 |
| Mode M0 | |||
|---|---|---|---|
| Quadrant | BADHDUFLAG | Total packets | Discarded packets |
| A | 0 | 22889 | 0 |
| B | 0 | 14892 | 0 |
| C | 0 | 17351 | 0 |
| D | 0 | 20219 | 0 |
| Quadrant | Total seconds | Saturated seconds | Saturation percentage |
|---|---|---|---|
| A | 7206 | 81 | 1.124063% |
| B | 7207 | 18 | 0.249757% |
| C | 7207 | 233 | 3.232968% |
| D | 7207 | 243 | 3.371722% |
Noise dominated data is calculated using 1-second bins in cleaned event files. If a bin has >2000 counts, and if more than 50% of those come from <1% of pixels, then it is considered to be noise-dominated and hence unusable.
| Quadrant | # 1 sec bins | Bins with >0 counts | Bins with >2000 counts | High rate bins dominated by noise | Noise dominated (total time) | Noise dominated (detector-on time) | Marked lightcurve |
|---|---|---|---|---|---|---|---|
| A | 7206 | 7206 | 67 | 67 | 0.93% | 0.93% | 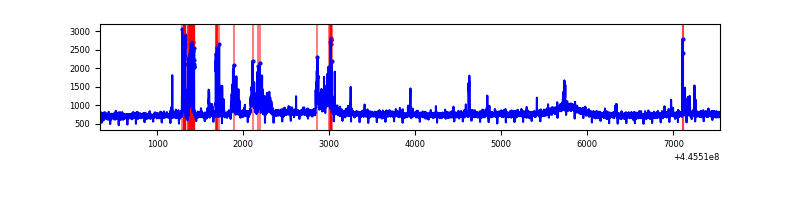 |
| B | 7207 | 7207 | 2 | 2 | 0.03% | 0.03% | 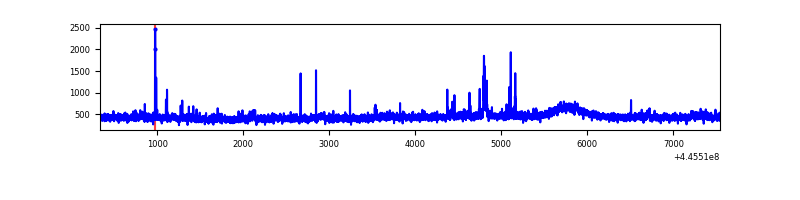 |
| C | 7207 | 7207 | 258 | 258 | 3.58% | 3.58% | 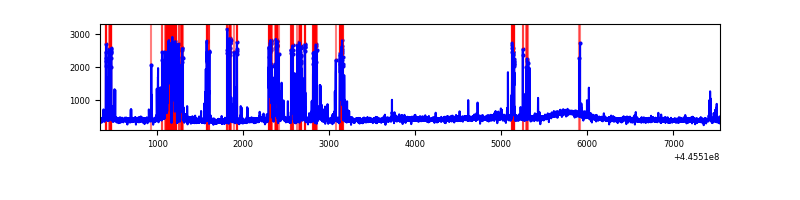 |
| D | 7207 | 7207 | 241 | 241 | 3.34% | 3.34% | 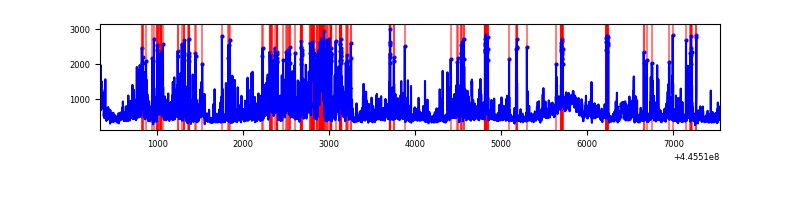 |
Top three noisy pixels from each quadrant. If the there are fewer than three noisy pixels in the level2.evt file, extra rows are filled as -1
| Pixel properties | Quadrant properties | ||||||
|---|---|---|---|---|---|---|---|
| Quadrant | DetID | PixID | Counts | Sigma | Mean | Median | Sigma |
| A | 10 | 83 | 2420884 | 14669.74 | 787 | 768 | 165.0 |
| A | 10 | 248 | 447496 | 2707.88 | 787 | 768 | 165.0 |
| A | 0 | 243 | 14498 | 83.23 | 787 | 768 | 165.0 |
| B | 0 | 183 | 48877 | 314.53 | 786 | 763 | 153.0 |
| B | 0 | 246 | 24942 | 158.06 | 786 | 763 | 153.0 |
| B | 12 | 111 | 19837 | 124.69 | 786 | 763 | 153.0 |
| C | 14 | 254 | 621869 | 3438.28 | 764 | 766 | 180.6 |
| C | 12 | 250 | 393259 | 2172.75 | 764 | 766 | 180.6 |
| C | 3 | 233 | 22764 | 121.78 | 764 | 766 | 180.6 |
| D | 1 | 52 | 1087399 | 5706.89 | 767 | 744 | 190.4 |
| D | 2 | 249 | 435028 | 2280.77 | 767 | 744 | 190.4 |
| D | 13 | 249 | 176555 | 923.32 | 767 | 744 | 190.4 |
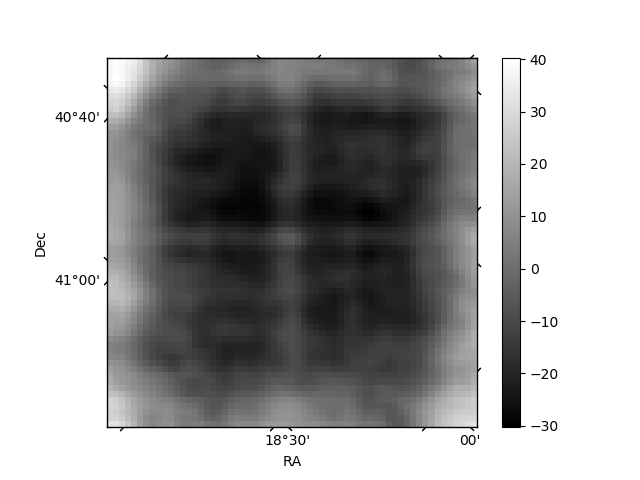
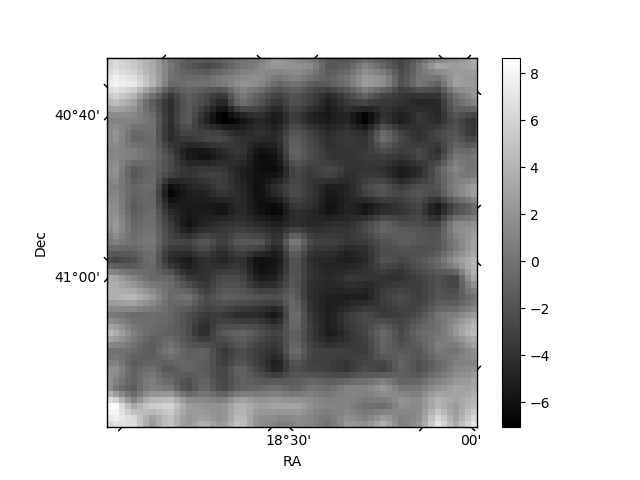
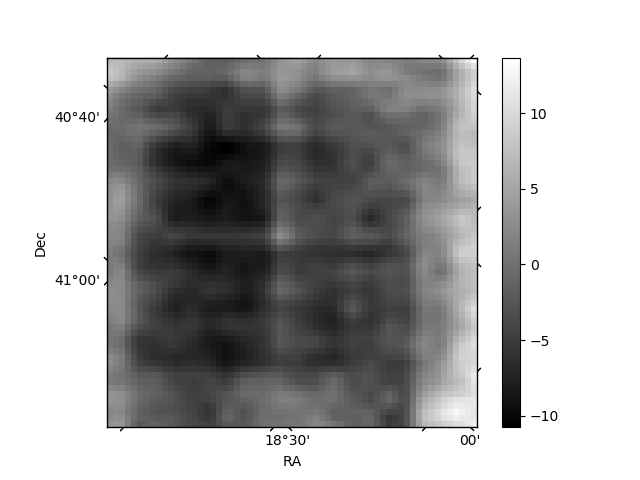
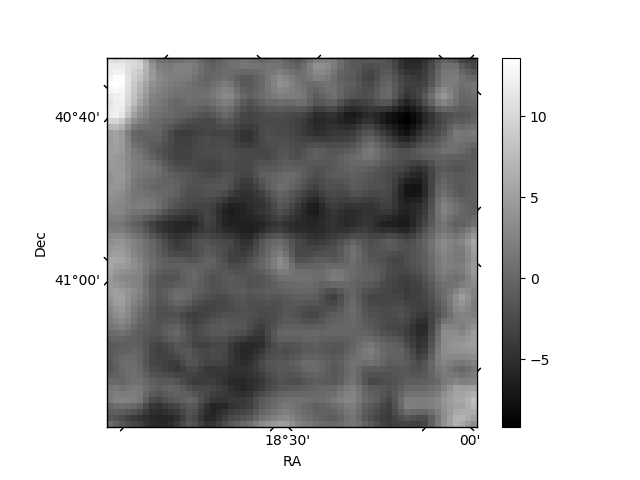
Histogram calculated using DETX and DETY for each event in the final _common_clean file
| Quadrant A | 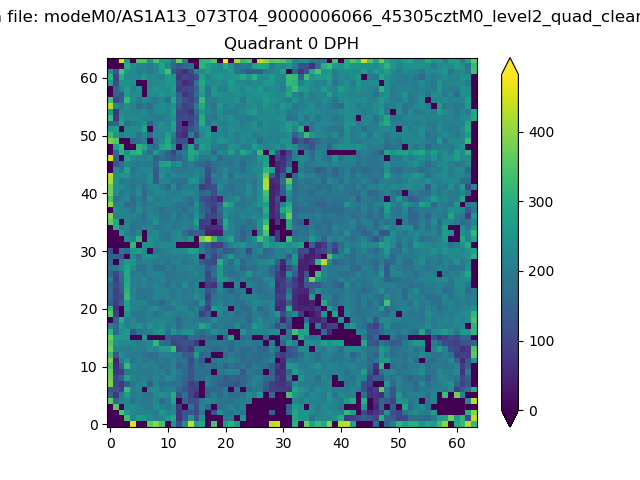 |
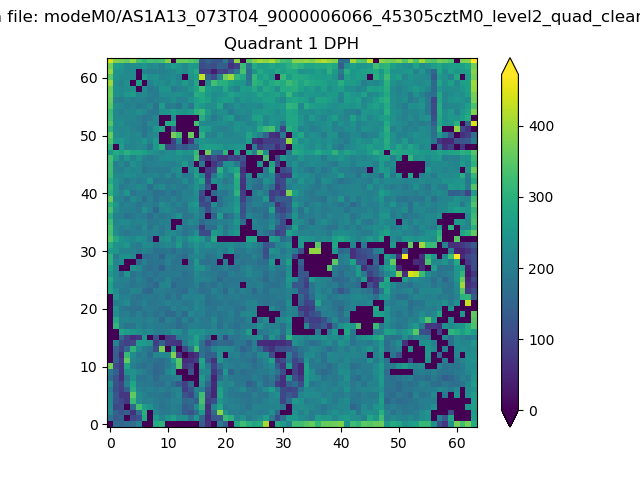 |
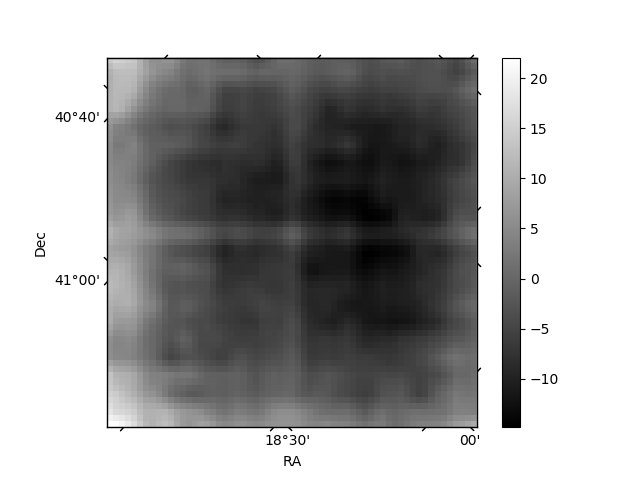
Quadrant B |
|---|---|---|---|
| Quadrant D | 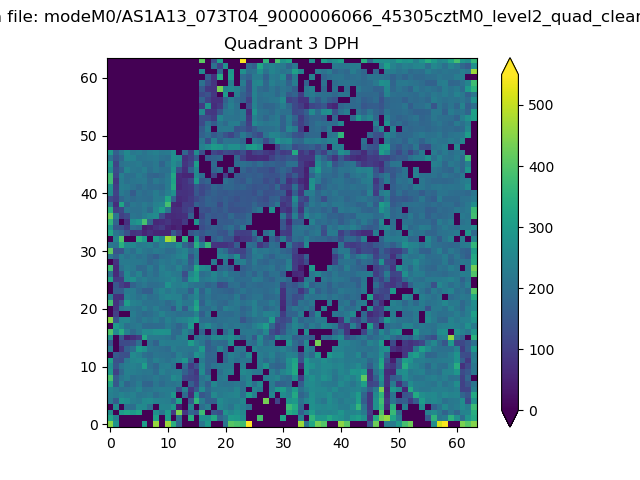 |
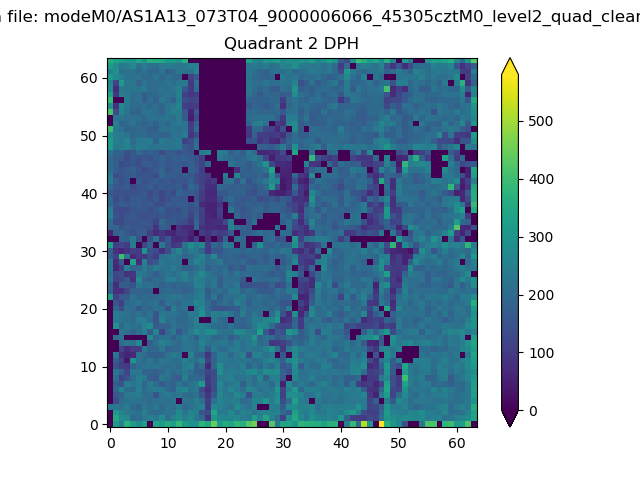 |
Quadrant C |
| Plot type | Count rate plots | Images |
|---|---|---|
| Comparison with Poisson distribution Blue bars denote a histogram of data divided into 1 sec bins. Red curve is a Poisson curve with rate = median count rate of data. |
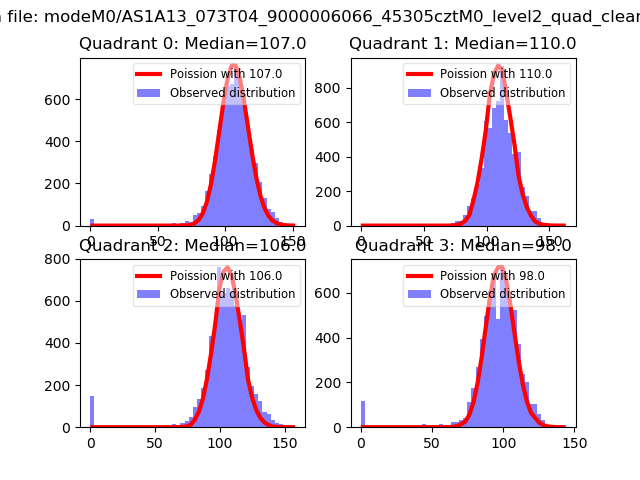 |
 |
| Quadrant-wise count rates Data is divided into 100 sec bins |
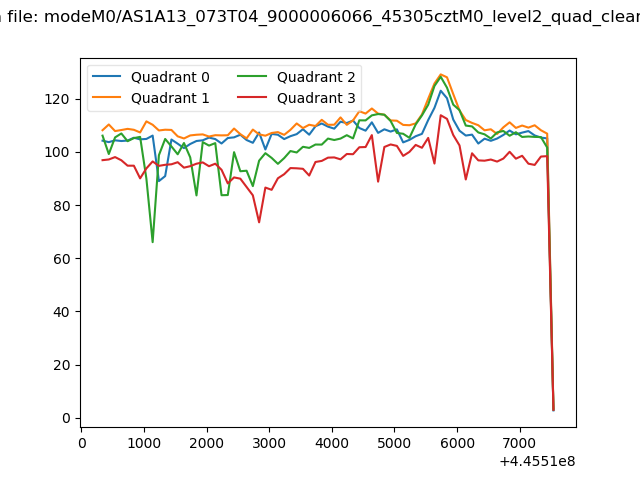 |
|
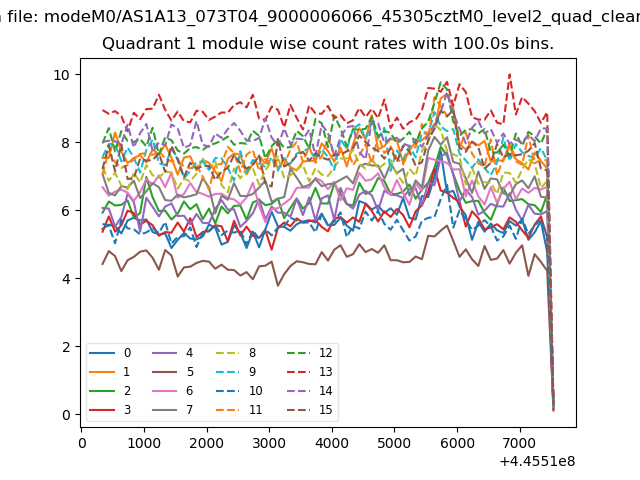
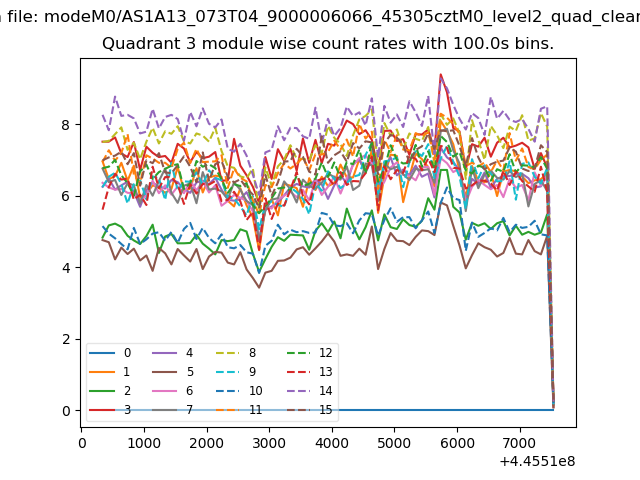
| Module-wise count rates for Quadrant A Data is divided into 100 sec bins |
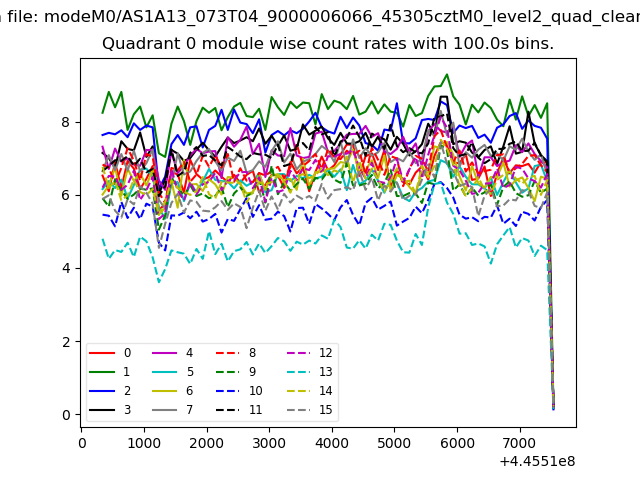 |
 |
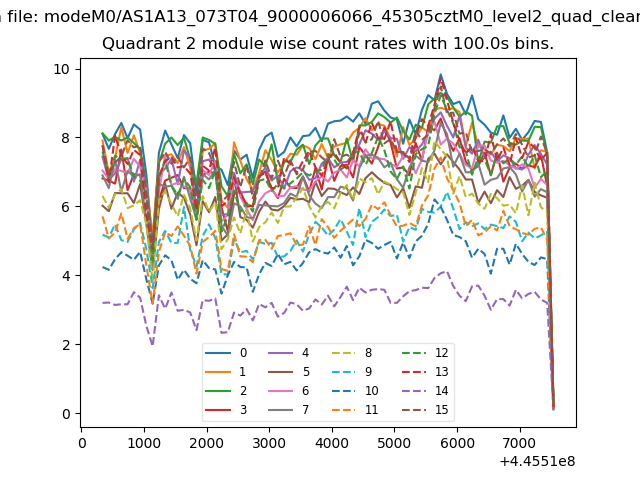
| Module-wise count rates for Quadrant B Data is divided into 100 sec bins |
 |
 |
| Module-wise count rates for Quadrant C Data is divided into 100 sec bins |
 |
 |
| Module-wise count rates for Quadrant D Data is divided into 100 sec bins |
 |
 |
| Parameter | Plot |
|---|---|
| CZT HV Monitor | 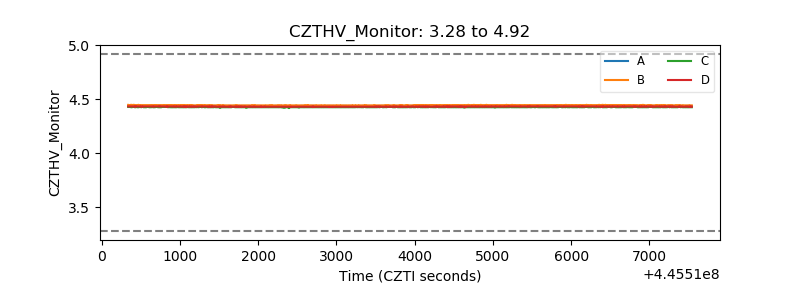 |
| D_VDD | 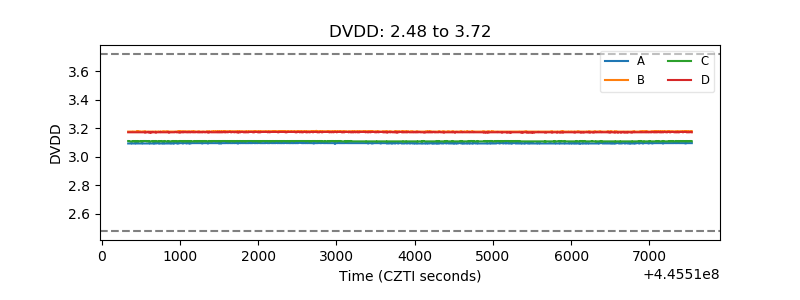 |
| Temperature 1 | 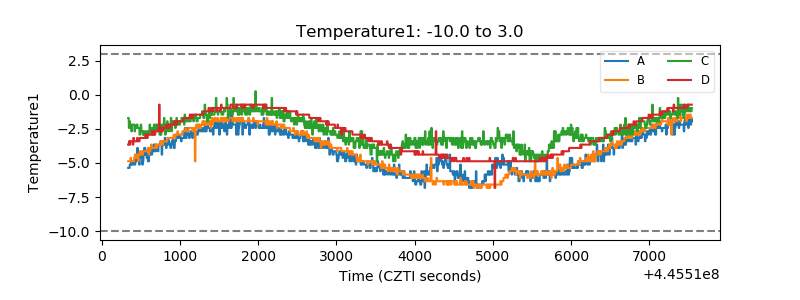 |
| Veto HV Monitor | 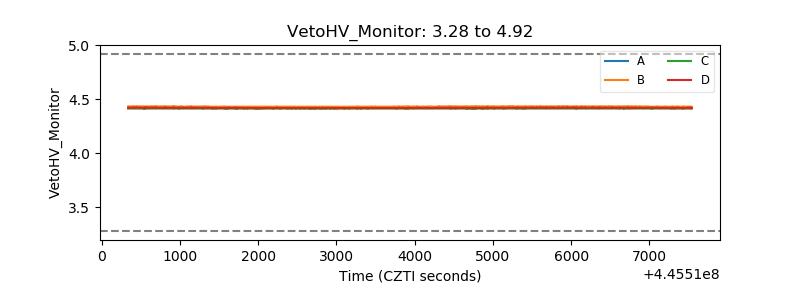 |
| Veto LLD | 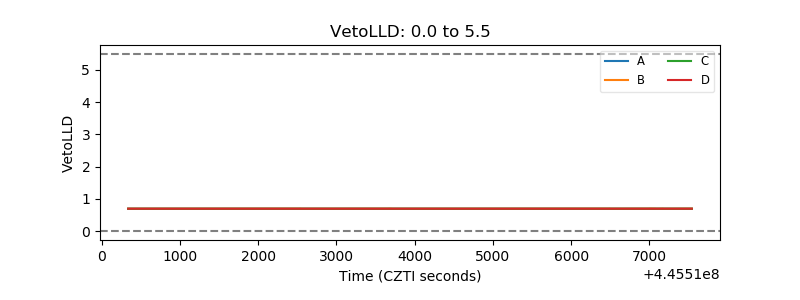 |
| Alpha Counter |  |
| _CPM_Rate | 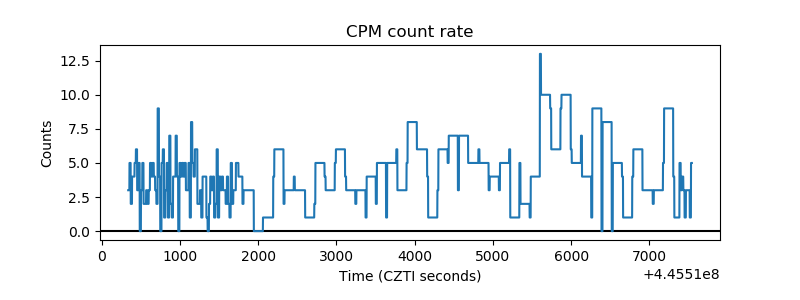 |
| CZT Counter | 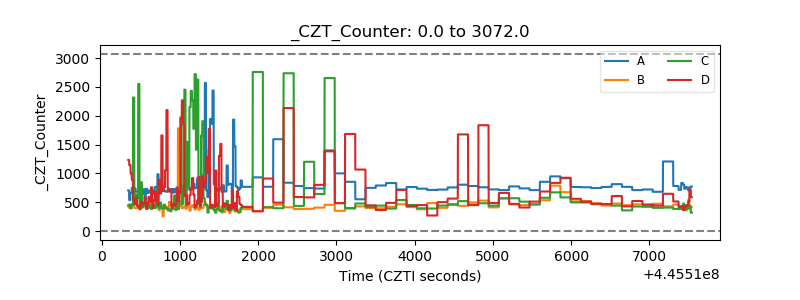 |
| +2.5 Volts monitor | 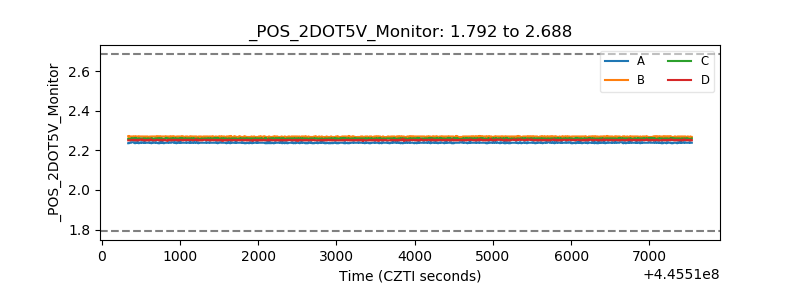 |
| +5 Volts monitor | 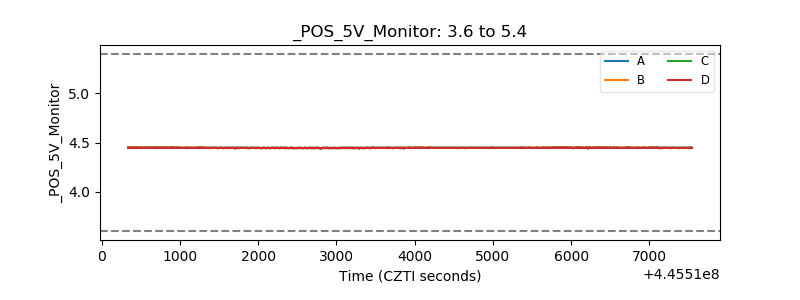 |
| _ROLL_ROT | 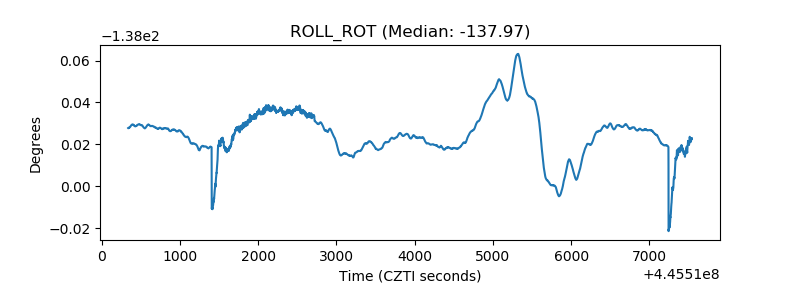 |
| _Roll_DEC | 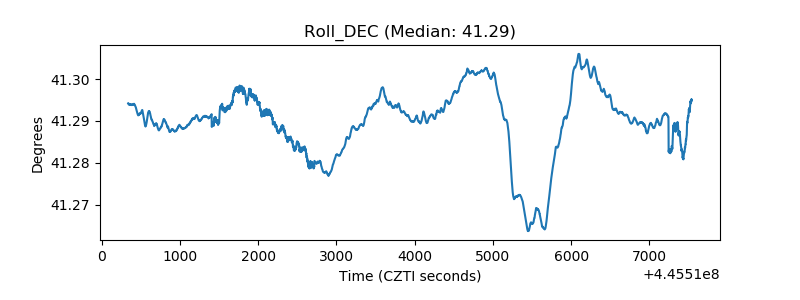 |
| _Roll_RA | 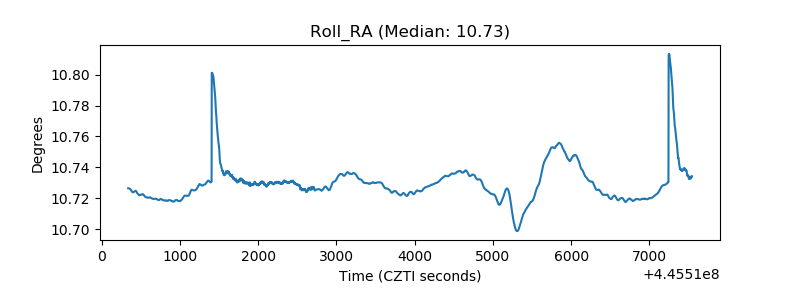 |
| Veto Counter | 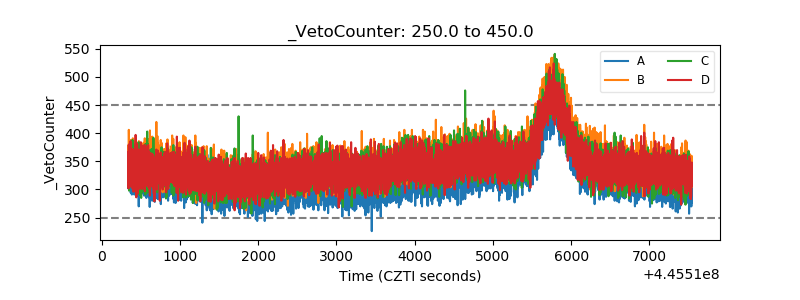 |