| Param | Original file | Final file |
|---|---|---|
| Filename | modeM0/AS1A13_073T04_9000006066_45306cztM0_level2.fits | modeM0/AS1A13_073T04_9000006066_45306cztM0_level2_quad_clean.evt |
| Size (bytes) | 486,817,920 | 115,643,520 |
| Size | 464.3 MB | 110.3 MB |
| Events in quadrant A | 5,731,628 | 765,973 |
| Events in quadrant B | 3,266,001 | 790,788 |
| Events in quadrant C | 3,430,123 | 758,828 |
| Events in quadrant D | 5,037,096 | 687,689 |
| Mode SS | |||
|---|---|---|---|
| Quadrant | BADHDUFLAG | Total packets | Discarded packets |
| A | 0 | 142 | 0 |
| B | 0 | 142 | 0 |
| C | 0 | 142 | 0 |
| D | 0 | 142 | 0 |
| Mode M0 | |||
|---|---|---|---|
| Quadrant | BADHDUFLAG | Total packets | Discarded packets |
| A | 0 | 22108 | 4 |
| B | 0 | 14834 | 0 |
| C | 0 | 15666 | 0 |
| D | 0 | 19931 | 0 |
| Quadrant | Total seconds | Saturated seconds | Saturation percentage |
|---|---|---|---|
| A | 7158 | 84 | 1.173512% |
| B | 7159 | 46 | 0.642548% |
| C | 7160 | 76 | 1.061453% |
| D | 7160 | 270 | 3.770950% |
Noise dominated data is calculated using 1-second bins in cleaned event files. If a bin has >2000 counts, and if more than 50% of those come from <1% of pixels, then it is considered to be noise-dominated and hence unusable.
| Quadrant | # 1 sec bins | Bins with >0 counts | Bins with >2000 counts | High rate bins dominated by noise | Noise dominated (total time) | Noise dominated (detector-on time) | Marked lightcurve |
|---|---|---|---|---|---|---|---|
| A | 7159 | 7159 | 14 | 14 | 0.20% | 0.20% | 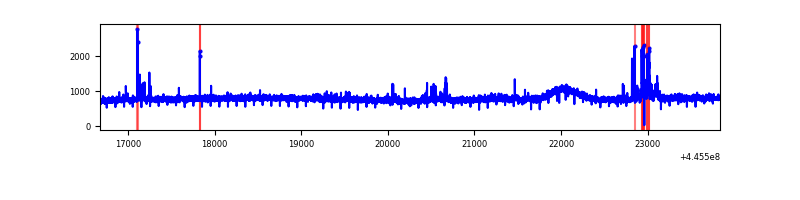 |
| B | 7159 | 7159 | 5 | 5 | 0.07% | 0.07% | 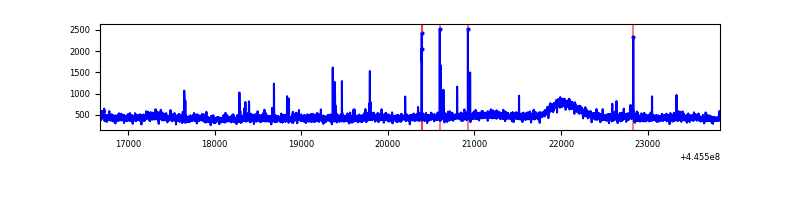 |
| C | 7160 | 7160 | 68 | 68 | 0.95% | 0.95% |  |
| D | 7160 | 7160 | 277 | 277 | 3.87% | 3.87% | 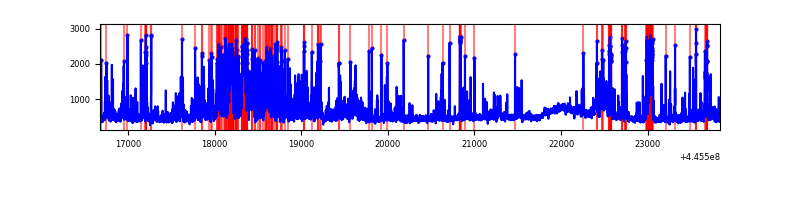 |
Top three noisy pixels from each quadrant. If the there are fewer than three noisy pixels in the level2.evt file, extra rows are filled as -1
| Pixel properties | Quadrant properties | ||||||
|---|---|---|---|---|---|---|---|
| Quadrant | DetID | PixID | Counts | Sigma | Mean | Median | Sigma |
| A | 10 | 83 | 2490379 | 14849.82 | 797 | 778 | 167.7 |
| A | 10 | 248 | 140555 | 833.73 | 797 | 778 | 167.7 |
| A | 0 | 243 | 16529 | 93.95 | 797 | 778 | 167.7 |
| B | 0 | 183 | 56524 | 356.41 | 793 | 768 | 156.4 |
| B | 5 | 255 | 26424 | 164.0 | 793 | 768 | 156.4 |
| B | 12 | 111 | 19744 | 121.3 | 793 | 768 | 156.4 |
| C | 14 | 254 | 323131 | 1754.94 | 776 | 782 | 183.7 |
| C | 3 | 233 | 62369 | 335.29 | 776 | 782 | 183.7 |
| C | 11 | 16 | 15094 | 77.92 | 776 | 782 | 183.7 |
| D | 1 | 52 | 895061 | 4586.99 | 775 | 753 | 195.0 |
| D | 13 | 249 | 313900 | 1606.16 | 775 | 753 | 195.0 |
| D | 2 | 249 | 220206 | 1125.6 | 775 | 753 | 195.0 |
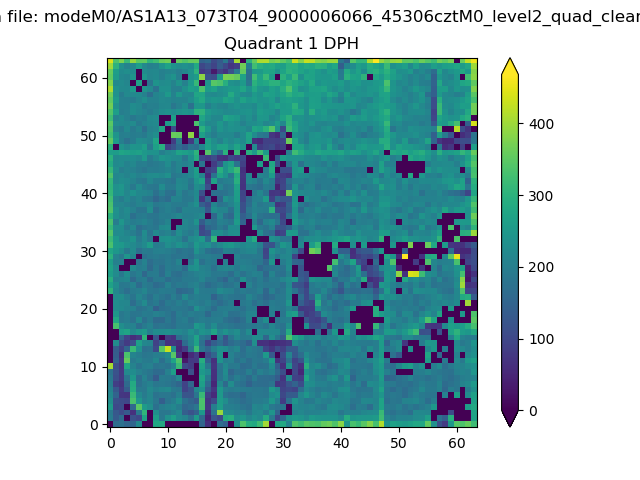
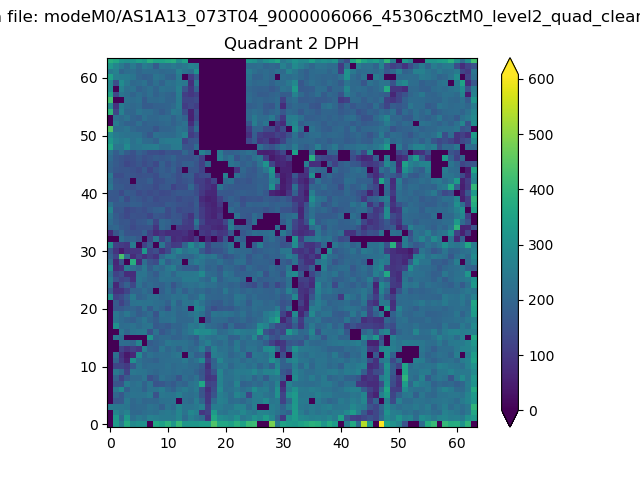
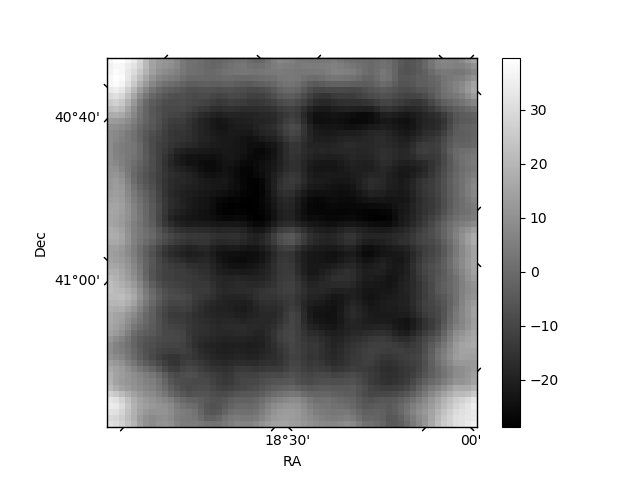
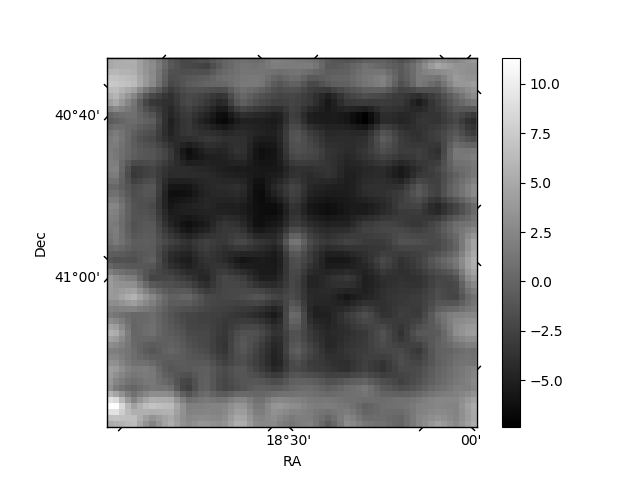
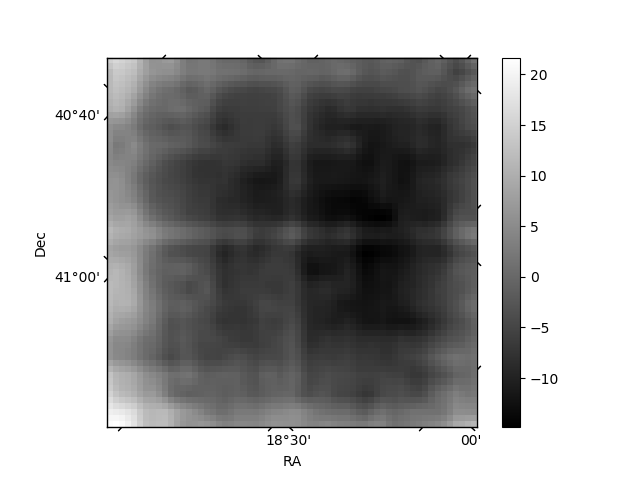
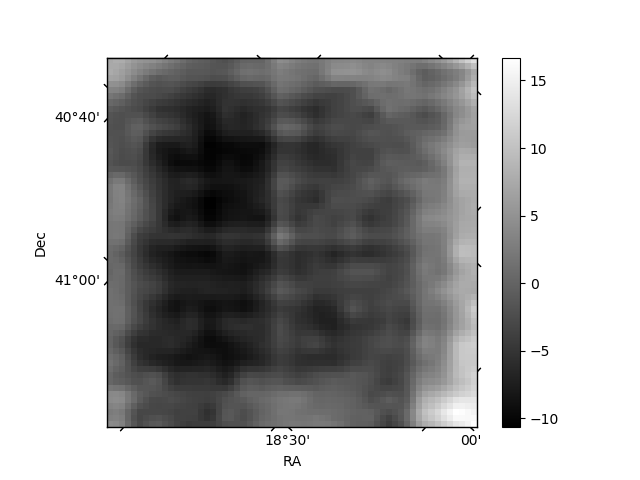
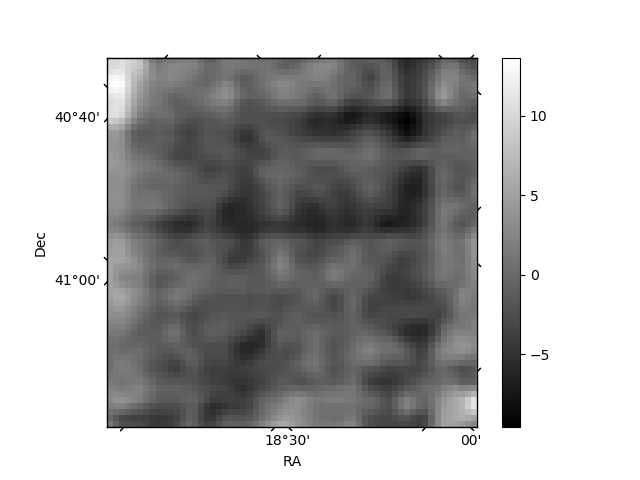
Histogram calculated using DETX and DETY for each event in the final _common_clean file
| Quadrant A | 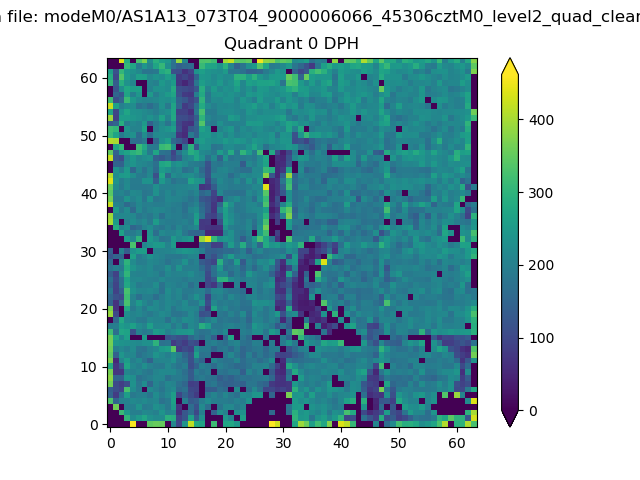 |
 |
Quadrant B |
|---|---|---|---|
| Quadrant D | 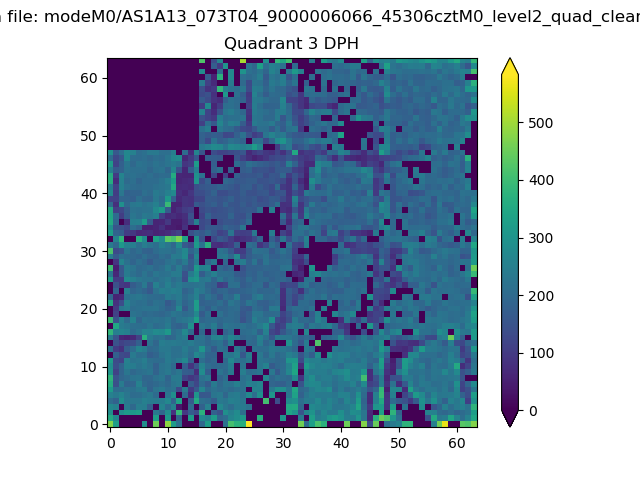 |
 |
Quadrant C |
| Plot type | Count rate plots | Images |
|---|---|---|
| Comparison with Poisson distribution Blue bars denote a histogram of data divided into 1 sec bins. Red curve is a Poisson curve with rate = median count rate of data. |
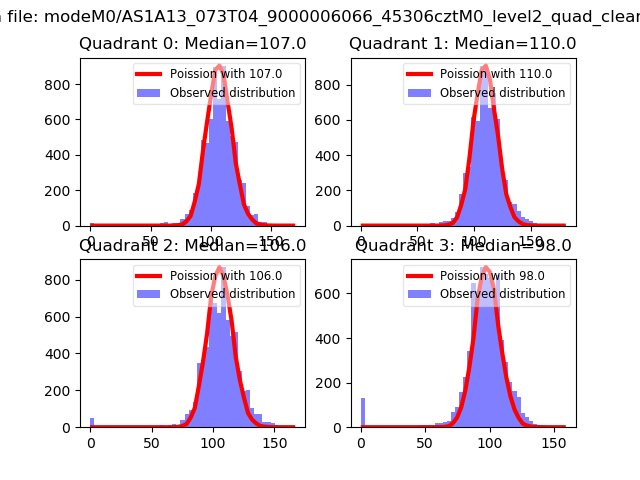 |
 |
| Quadrant-wise count rates Data is divided into 100 sec bins |
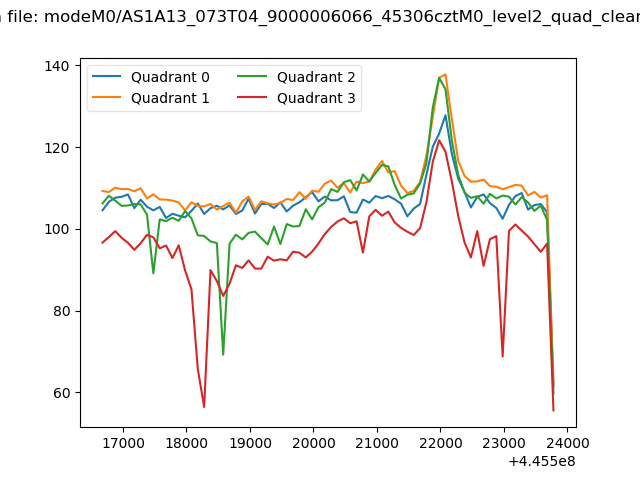 |
|
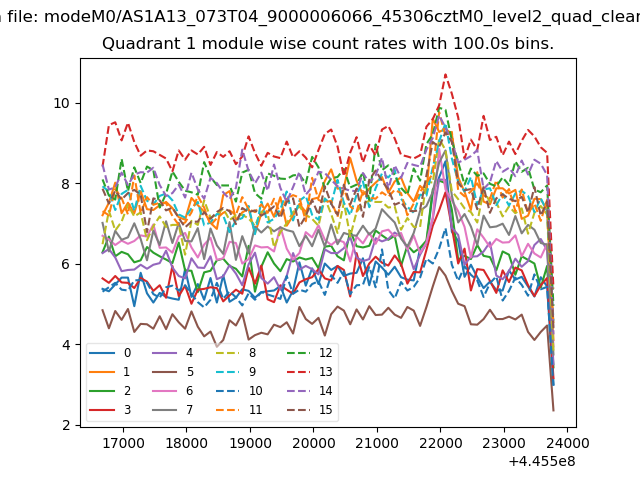
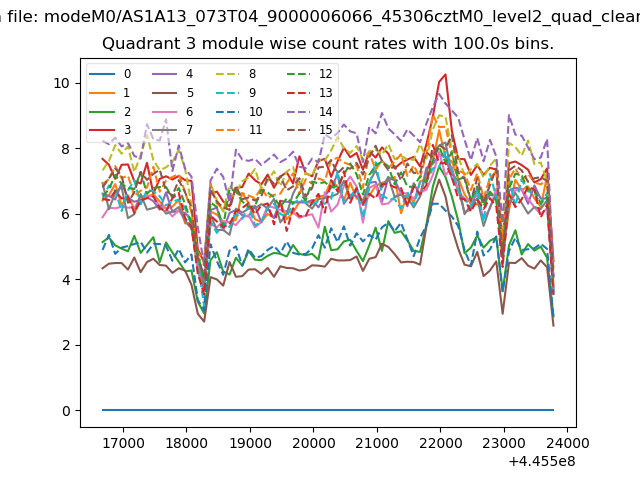
| Module-wise count rates for Quadrant A Data is divided into 100 sec bins |
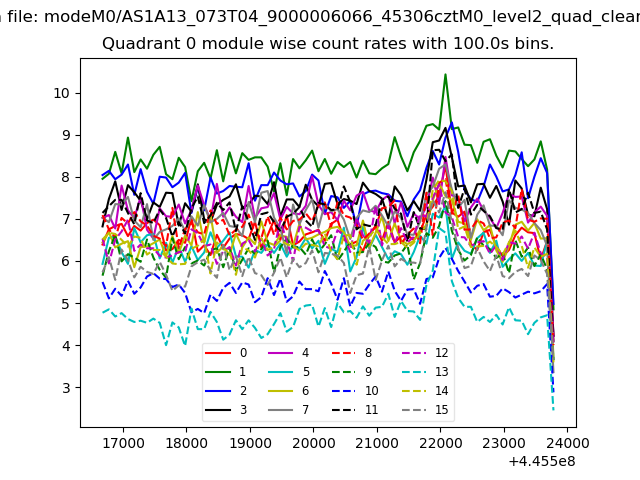 |
 |
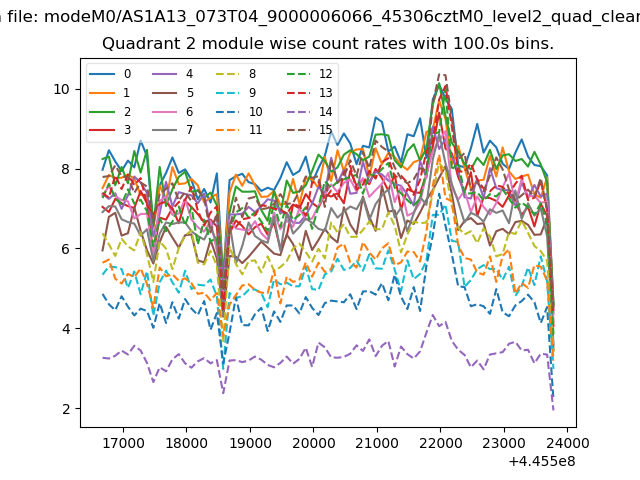
| Module-wise count rates for Quadrant B Data is divided into 100 sec bins |
 |
 |
| Module-wise count rates for Quadrant C Data is divided into 100 sec bins |
 |
 |
| Module-wise count rates for Quadrant D Data is divided into 100 sec bins |
 |
 |
| Parameter | Plot |
|---|---|
| CZT HV Monitor | 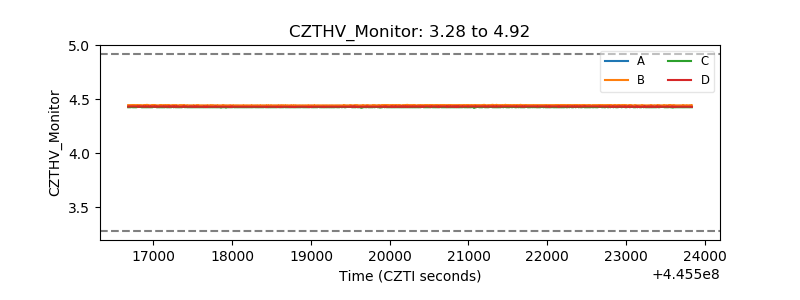 |
| D_VDD | 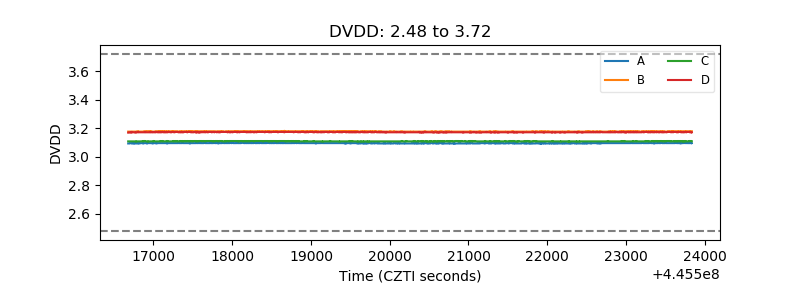 |
| Temperature 1 | 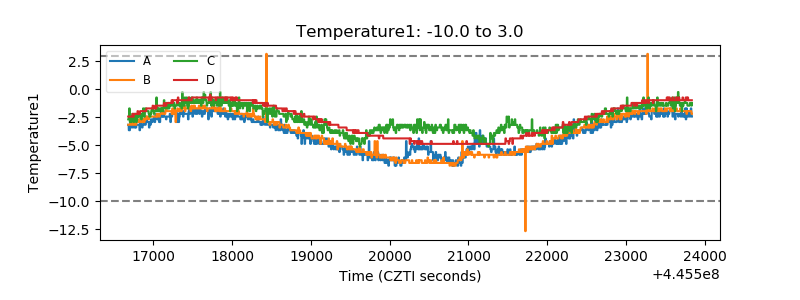 |
| Veto HV Monitor | 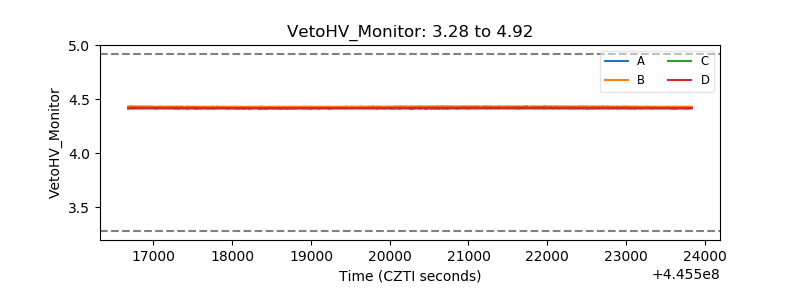 |
| Veto LLD | 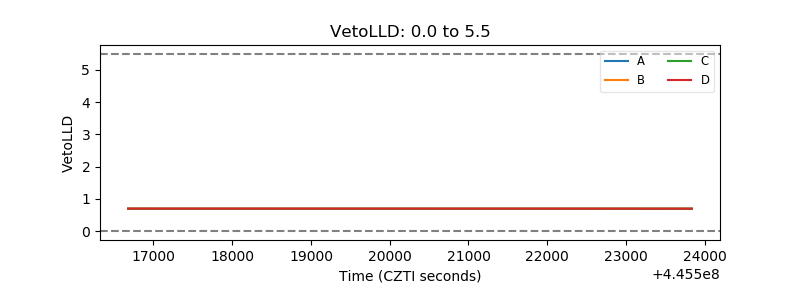 |
| Alpha Counter | 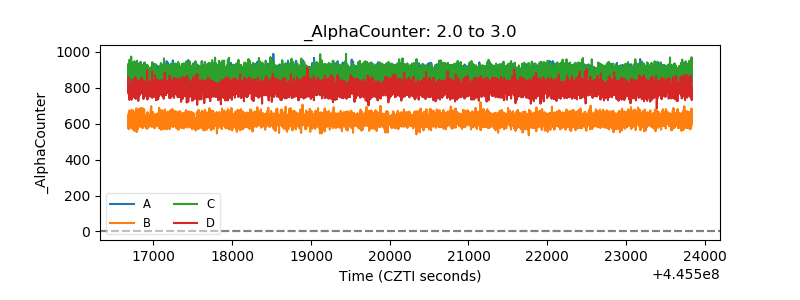 |
| _CPM_Rate | 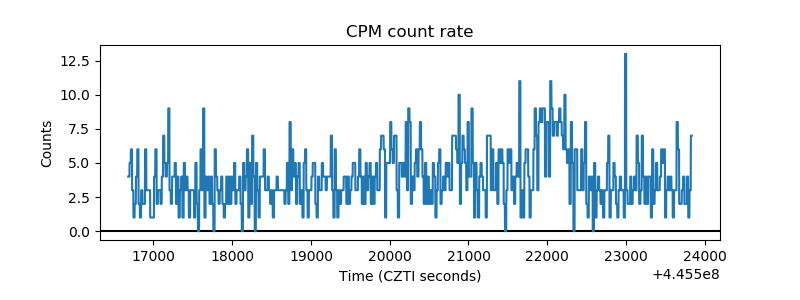 |
| CZT Counter | 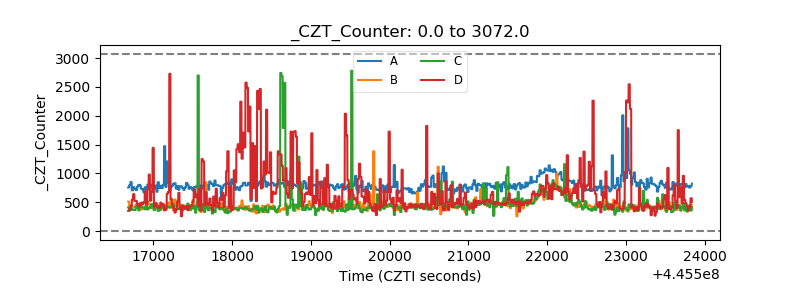 |
| +2.5 Volts monitor | 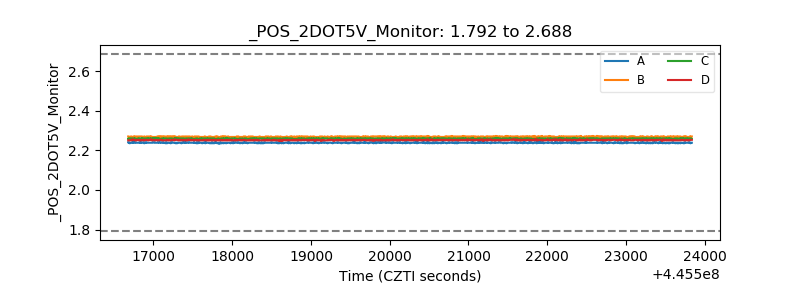 |
| +5 Volts monitor | 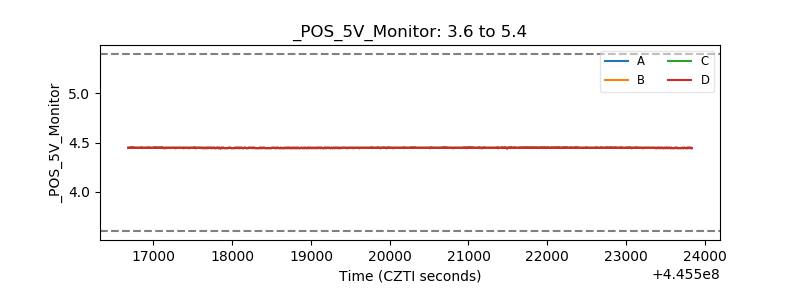 |
| _ROLL_ROT | 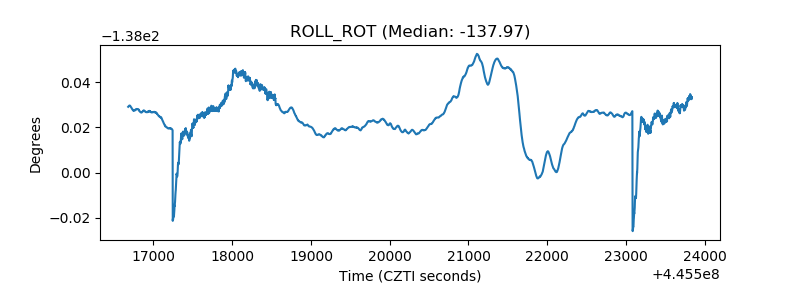 |
| _Roll_DEC | 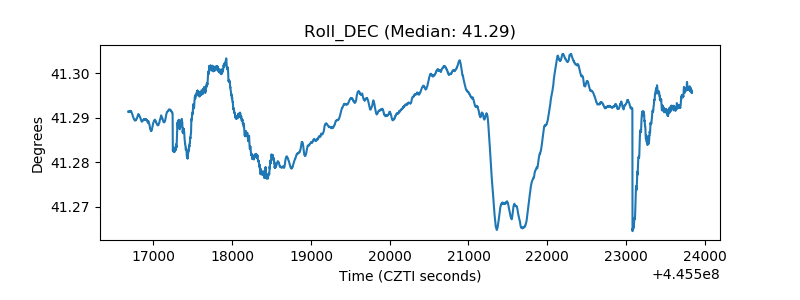 |
| _Roll_RA | 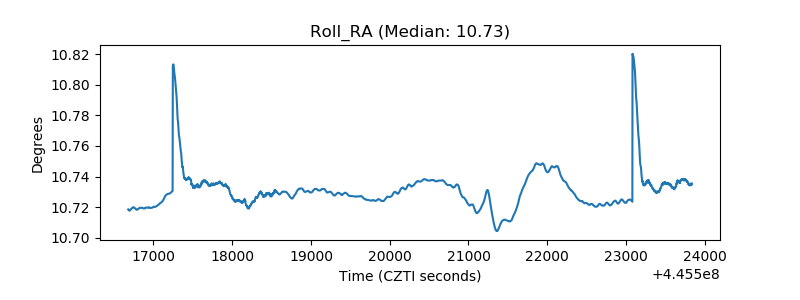 |
| Veto Counter | 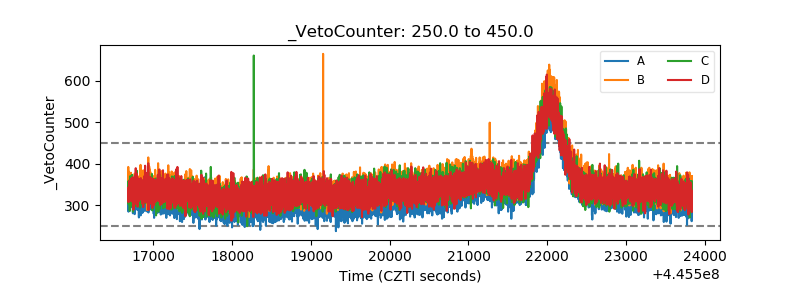 |