| Param | Original file | Final file |
|---|---|---|
| Filename | modeM0/AS1A13_073T04_9000006066_45308cztM0_level2.fits | modeM0/AS1A13_073T04_9000006066_45308cztM0_level2_quad_clean.evt |
| Size (bytes) | 750,450,240 | 185,604,480 |
| Size | 715.7 MB | 177.0 MB |
| Events in quadrant A | 9,363,827 | 1,213,443 |
| Events in quadrant B | 5,366,714 | 1,259,889 |
| Events in quadrant C | 5,422,652 | 1,224,848 |
| Events in quadrant D | 6,721,959 | 1,114,387 |
| Mode SS | |||
|---|---|---|---|
| Quadrant | BADHDUFLAG | Total packets | Discarded packets |
| A | 0 | 236 | 0 |
| B | 0 | 236 | 0 |
| C | 0 | 236 | 0 |
| D | 0 | 236 | 0 |
| Mode M9 | |||
|---|---|---|---|
| Quadrant | BADHDUFLAG | Total packets | Discarded packets |
| A | 0 | 9 | 0 |
| B | 0 | 9 | 0 |
| C | 0 | 9 | 0 |
| D | 0 | 9 | 0 |
| Mode M0 | |||
|---|---|---|---|
| Quadrant | BADHDUFLAG | Total packets | Discarded packets |
| A | 0 | 36098 | 2 |
| B | 0 | 24226 | 2 |
| C | 0 | 24859 | 2 |
| D | 0 | 28217 | 2 |
| Quadrant | Total seconds | Saturated seconds | Saturation percentage |
|---|---|---|---|
| A | 11667 | 214 | 1.834233% |
| B | 11668 | 138 | 1.182722% |
| C | 11668 | 116 | 0.994172% |
| D | 11668 | 372 | 3.188207% |
Noise dominated data is calculated using 1-second bins in cleaned event files. If a bin has >2000 counts, and if more than 50% of those come from <1% of pixels, then it is considered to be noise-dominated and hence unusable.
| Quadrant | # 1 sec bins | Bins with >0 counts | Bins with >2000 counts | High rate bins dominated by noise | Noise dominated (total time) | Noise dominated (detector-on time) | Marked lightcurve |
|---|---|---|---|---|---|---|---|
| A | 12547 | 11667 | 20 | 20 | 0.16% | 0.17% | 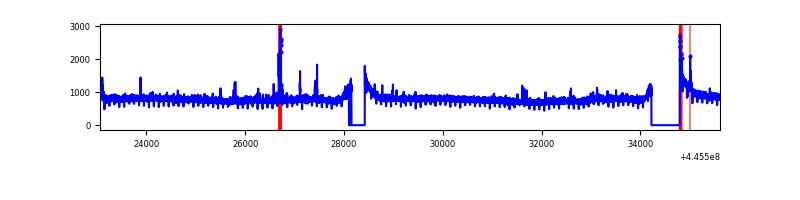 |
| B | 12548 | 11669 | 16 | 16 | 0.13% | 0.14% | 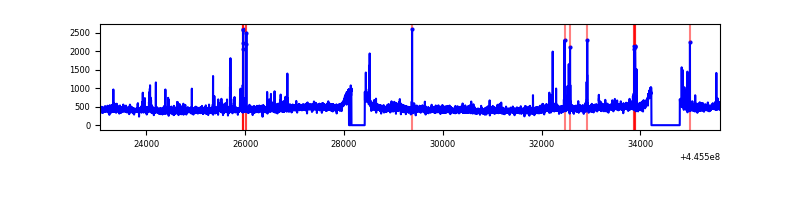 |
| C | 12548 | 11670 | 70 | 70 | 0.56% | 0.60% | 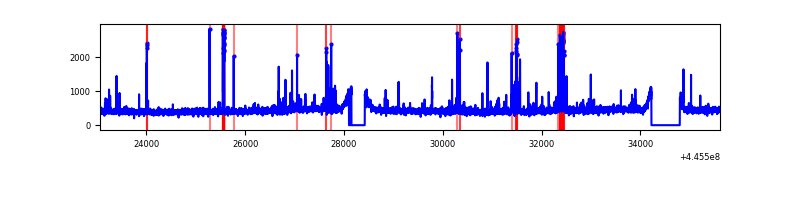 |
| D | 12548 | 11669 | 315 | 315 | 2.51% | 2.70% | 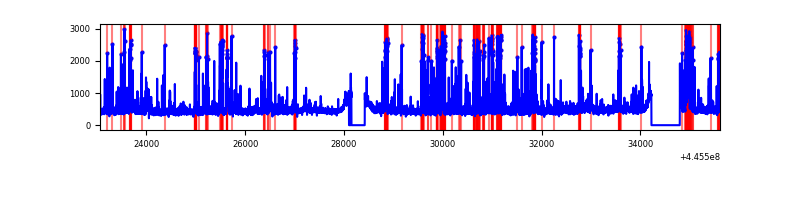 |
Top three noisy pixels from each quadrant. If the there are fewer than three noisy pixels in the level2.evt file, extra rows are filled as -1
| Pixel properties | Quadrant properties | ||||||
|---|---|---|---|---|---|---|---|
| Quadrant | DetID | PixID | Counts | Sigma | Mean | Median | Sigma |
| A | 10 | 83 | 4277763 | 16079.21 | 1278 | 1250 | 266.0 |
| A | 10 | 248 | 94734 | 351.49 | 1278 | 1250 | 266.0 |
| A | 7 | 16 | 28203 | 101.34 | 1278 | 1250 | 266.0 |
| B | 0 | 183 | 112647 | 444.81 | 1279 | 1240 | 250.5 |
| B | 5 | 172 | 72835 | 285.85 | 1279 | 1240 | 250.5 |
| B | 5 | 255 | 40897 | 158.34 | 1279 | 1240 | 250.5 |
| C | 14 | 254 | 359290 | 1203.91 | 1265 | 1275 | 297.4 |
| C | 3 | 233 | 80994 | 268.07 | 1265 | 1275 | 297.4 |
| C | 12 | 250 | 25796 | 82.46 | 1265 | 1275 | 297.4 |
| D | 13 | 249 | 523429 | 1660.08 | 1260 | 1224 | 314.6 |
| D | 5 | 222 | 404351 | 1281.53 | 1260 | 1224 | 314.6 |
| D | 13 | 171 | 262678 | 831.16 | 1260 | 1224 | 314.6 |
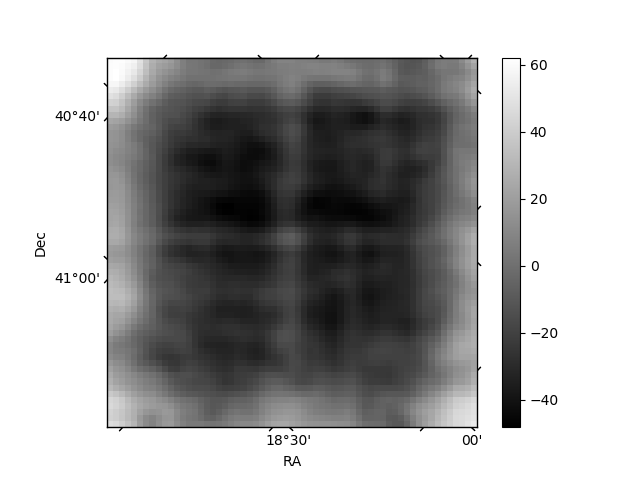
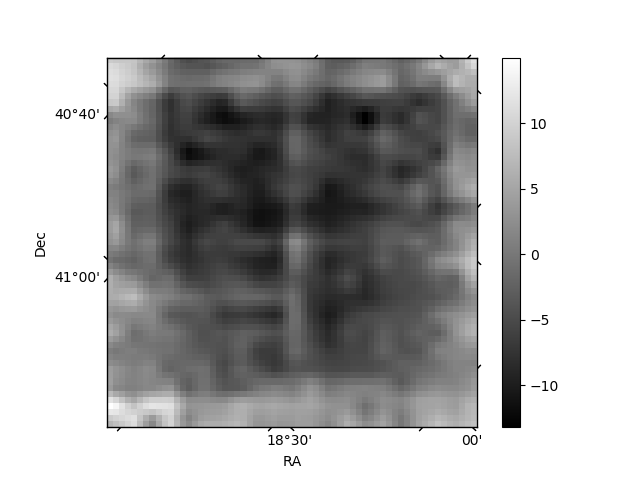
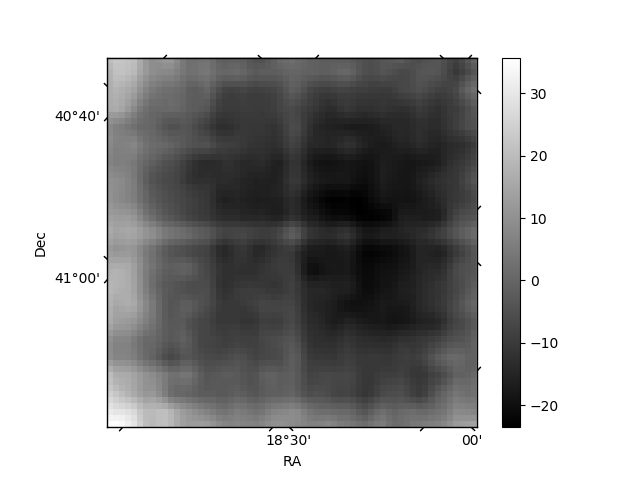
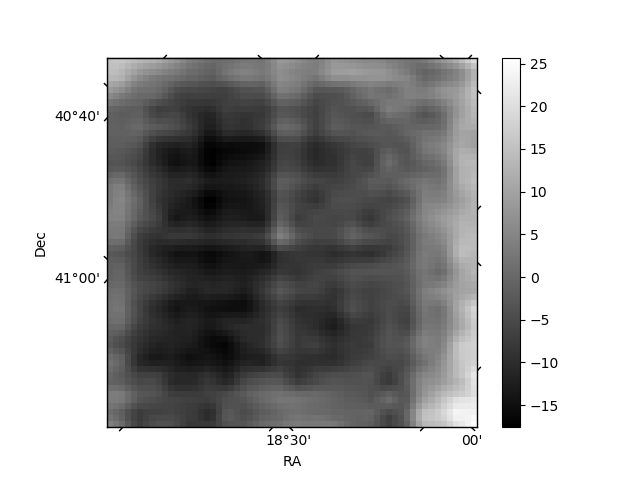
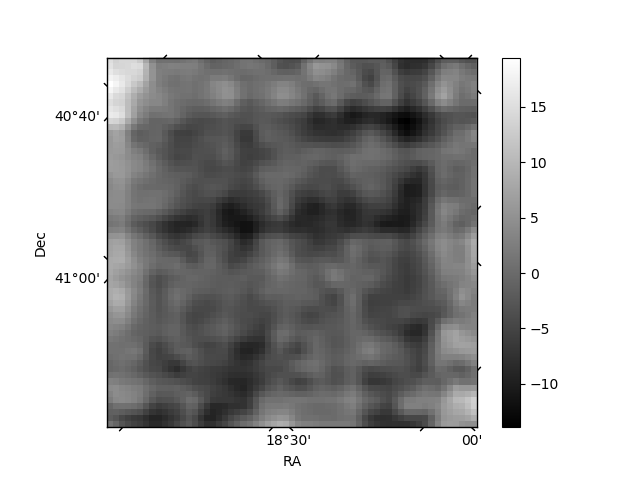
Histogram calculated using DETX and DETY for each event in the final _common_clean file
| Quadrant A | 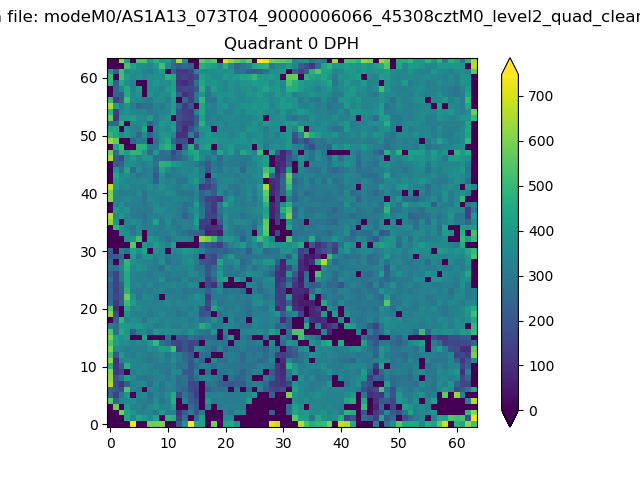 |
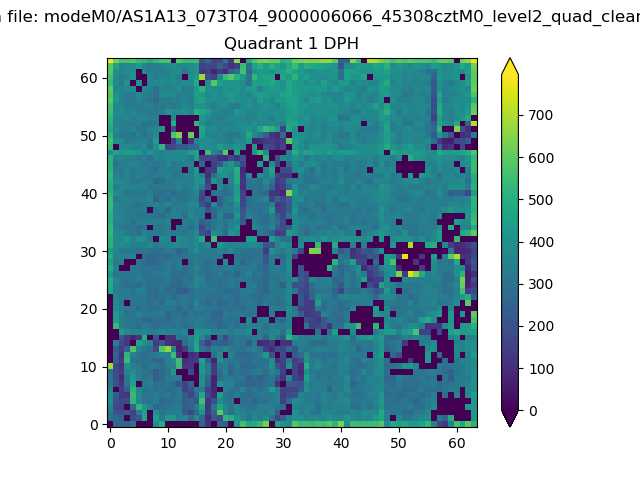 |
Quadrant B |
|---|---|---|---|
| Quadrant D | 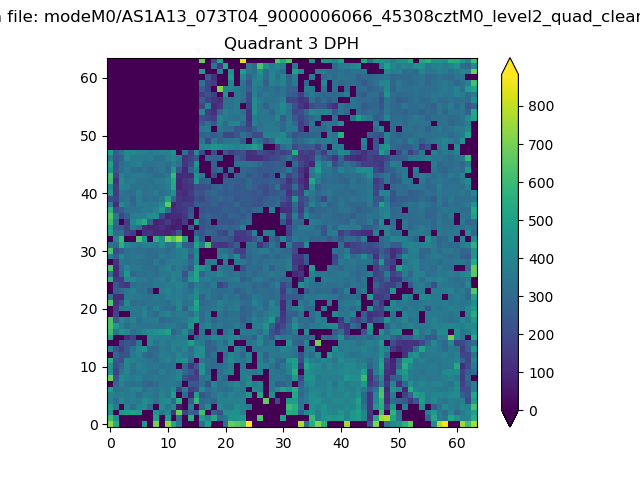 |
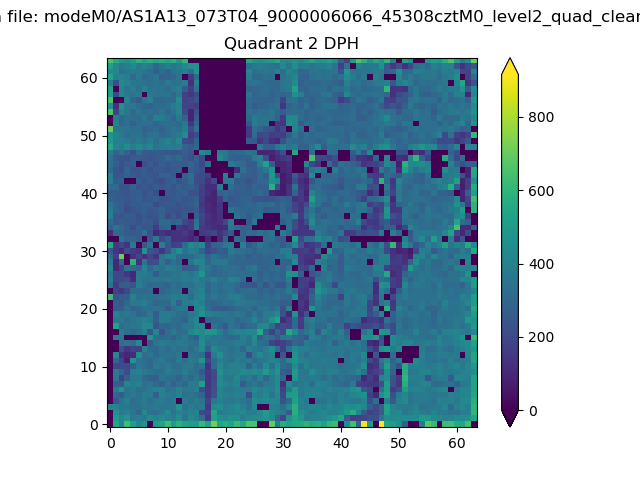 |
Quadrant C |
| Plot type | Count rate plots | Images |
|---|---|---|
| Comparison with Poisson distribution Blue bars denote a histogram of data divided into 1 sec bins. Red curve is a Poisson curve with rate = median count rate of data. |
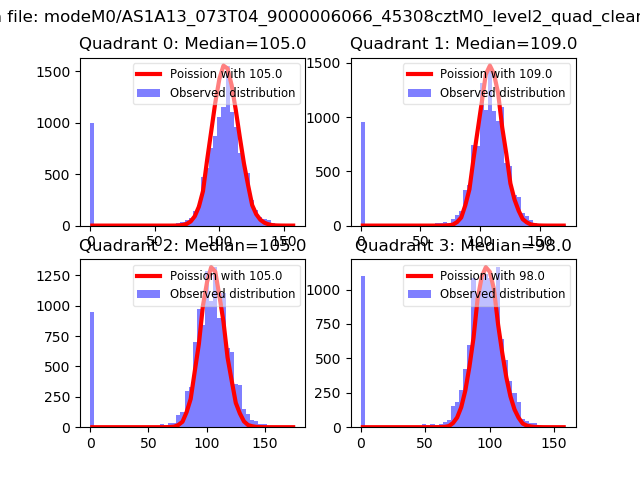 |
 |
| Quadrant-wise count rates Data is divided into 100 sec bins |
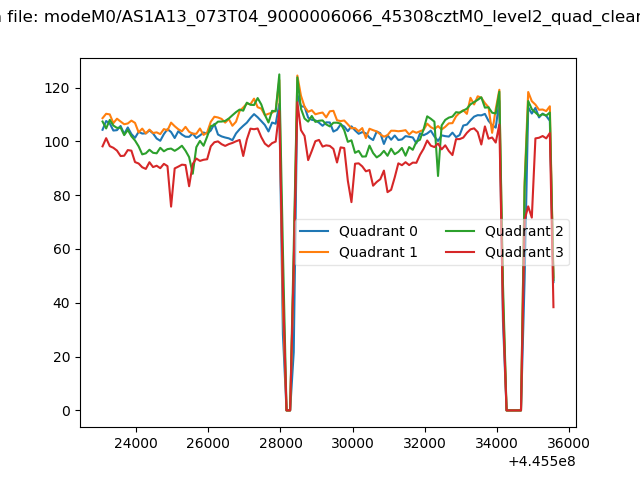 |
|
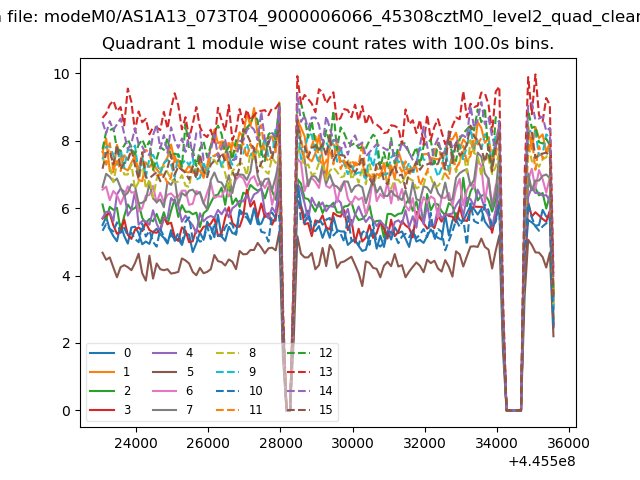
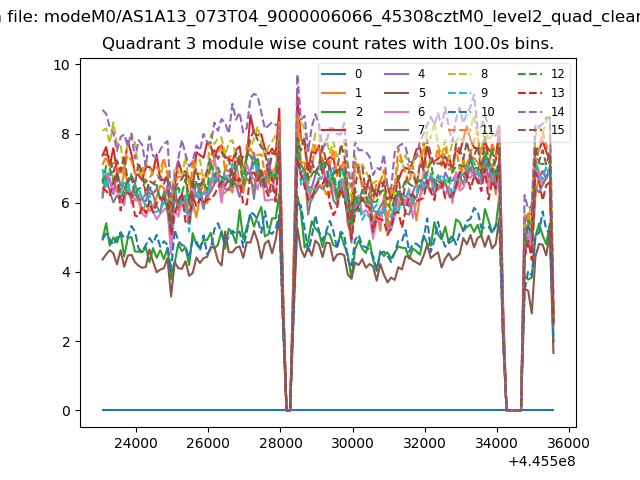
| Module-wise count rates for Quadrant A Data is divided into 100 sec bins |
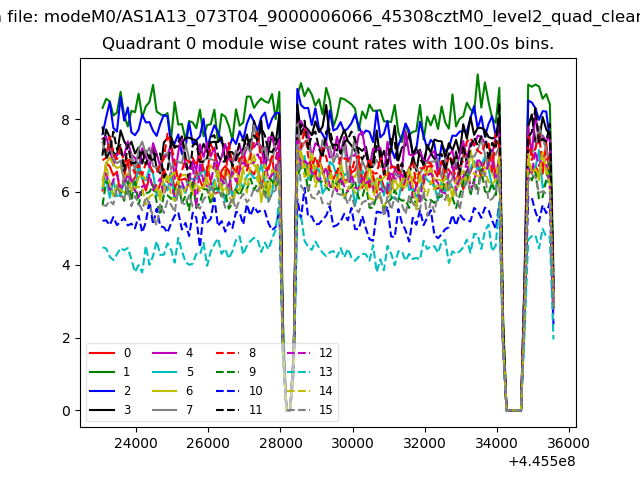 |
 |
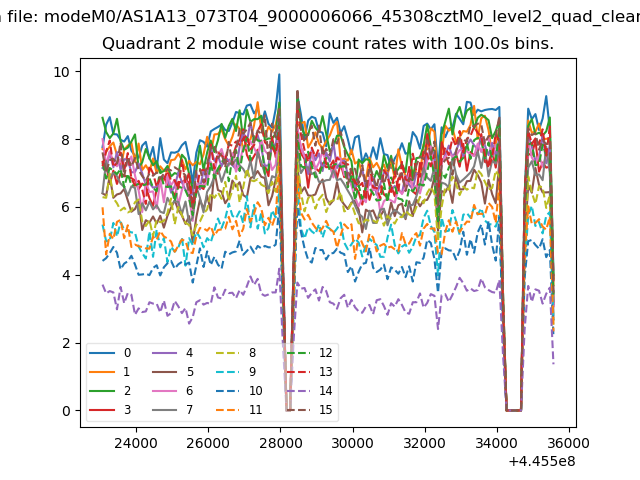
| Module-wise count rates for Quadrant B Data is divided into 100 sec bins |
 |
 |
| Module-wise count rates for Quadrant C Data is divided into 100 sec bins |
 |
 |
| Module-wise count rates for Quadrant D Data is divided into 100 sec bins |
 |
 |
| Parameter | Plot |
|---|---|
| CZT HV Monitor | 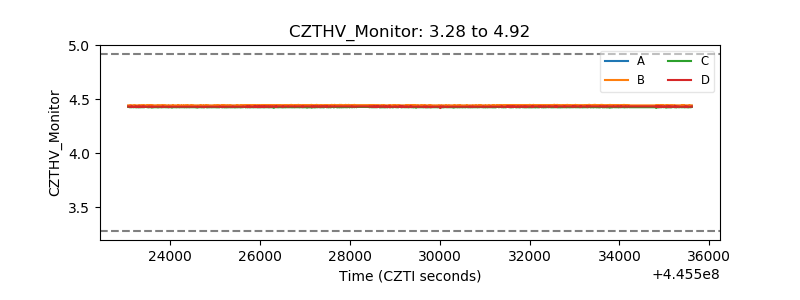 |
| D_VDD | 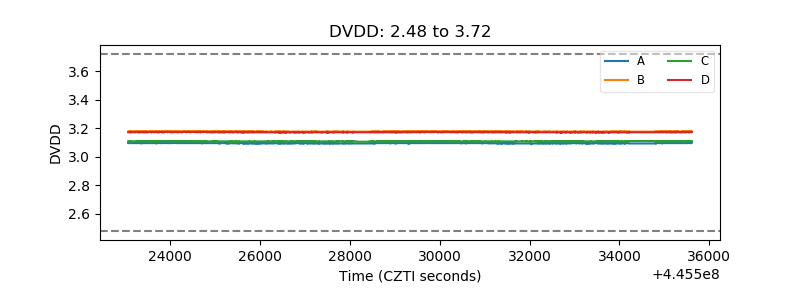 |
| Temperature 1 | 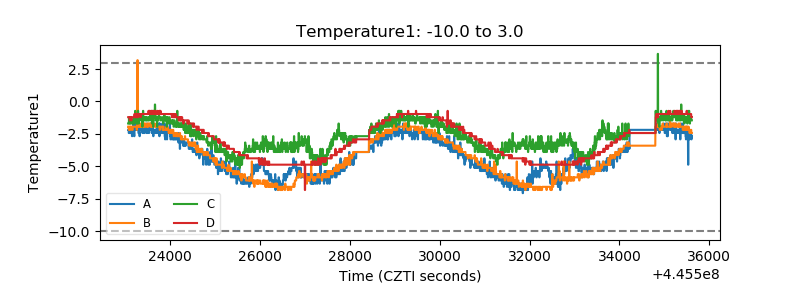 |
| Veto HV Monitor | 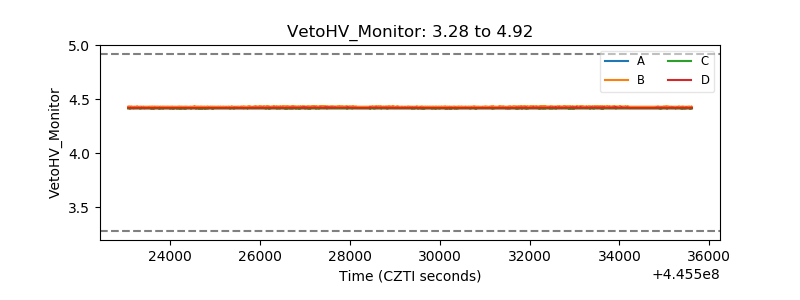 |
| Veto LLD | 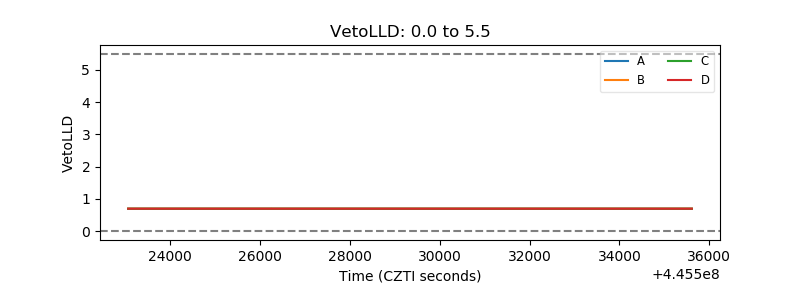 |
| Alpha Counter | 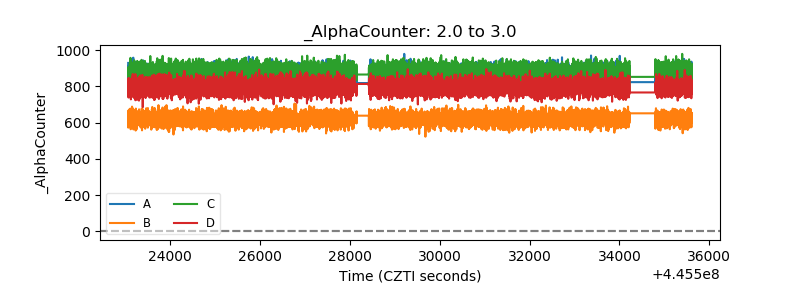 |
| _CPM_Rate | 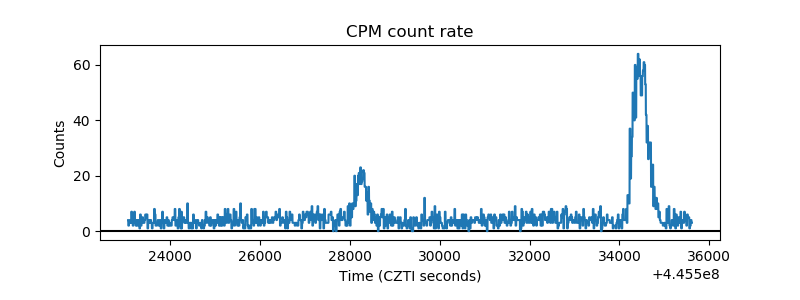 |
| CZT Counter | 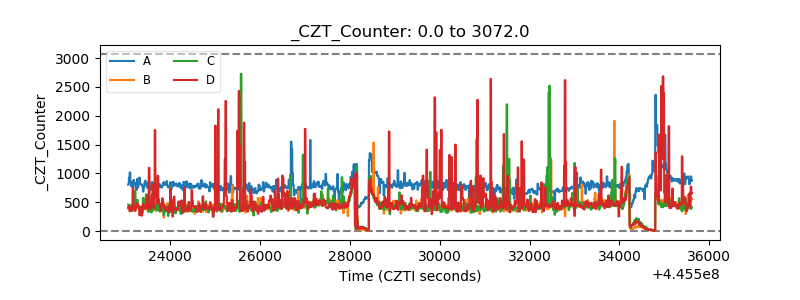 |
| +2.5 Volts monitor | 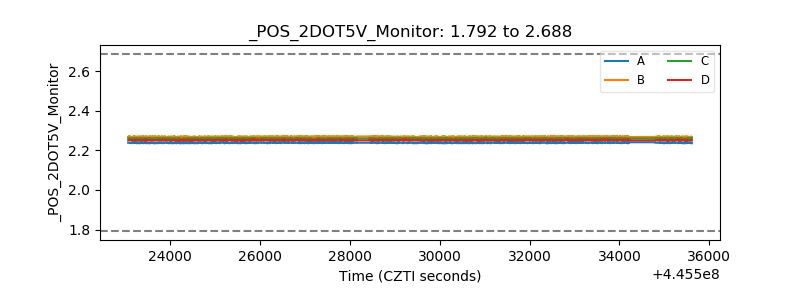 |
| +5 Volts monitor | 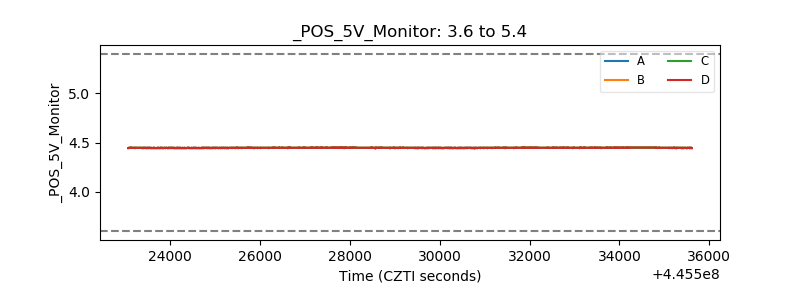 |
| _ROLL_ROT | 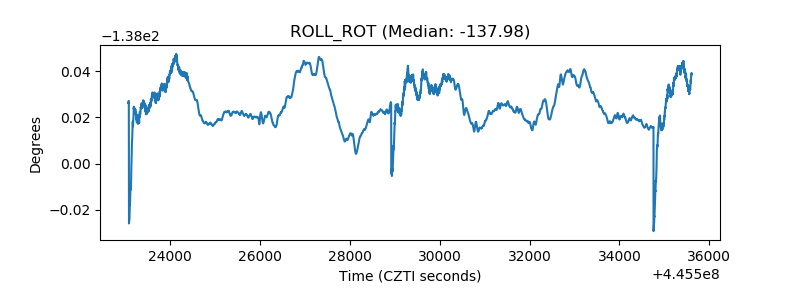 |
| _Roll_DEC | 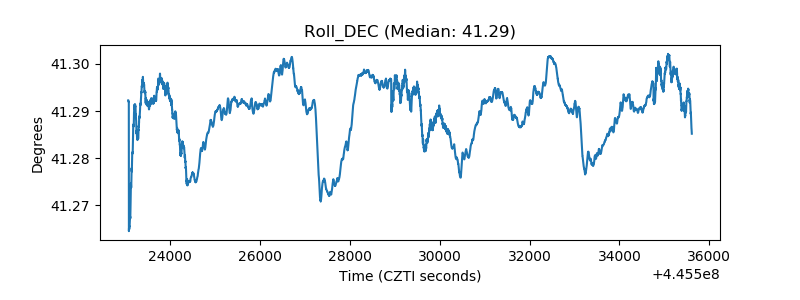 |
| _Roll_RA | 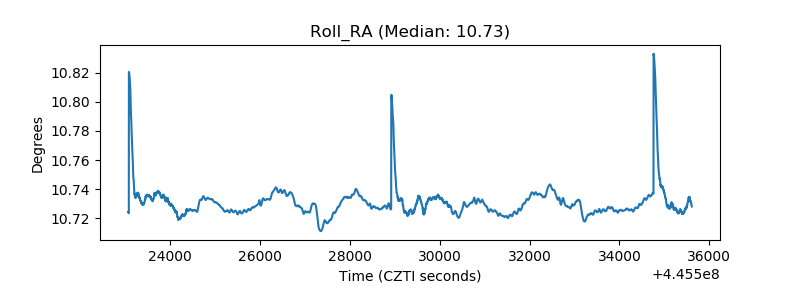 |
| Veto Counter | 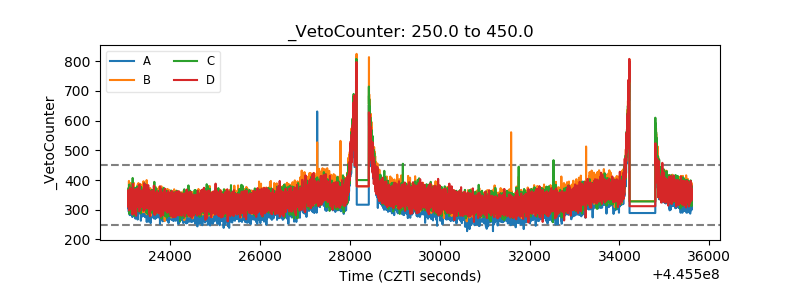 |