| Param | Original file | Final file |
|---|---|---|
| Filename | modeM0/AS1A13_073T04_9000006066_45309cztM0_level2.fits | modeM0/AS1A13_073T04_9000006066_45309cztM0_level2_quad_clean.evt |
| Size (bytes) | 78,076,800 | 19,854,720 |
| Size | 74.5 MB | 18.9 MB |
| Events in quadrant A | 1,011,167 | 133,016 |
| Events in quadrant B | 589,577 | 133,784 |
| Events in quadrant C | 594,564 | 123,022 |
| Events in quadrant D | 595,095 | 117,783 |
| Mode SS | |||
|---|---|---|---|
| Quadrant | BADHDUFLAG | Total packets | Discarded packets |
| A | 0 | 26 | 0 |
| B | 0 | 26 | 0 |
| C | 0 | 26 | 0 |
| D | 0 | 26 | 0 |
| Mode M0 | |||
|---|---|---|---|
| Quadrant | BADHDUFLAG | Total packets | Discarded packets |
| A | 0 | 3746 | 0 |
| B | 0 | 2605 | 0 |
| C | 0 | 2713 | 0 |
| D | 0 | 2674 | 0 |
| Quadrant | Total seconds | Saturated seconds | Saturation percentage |
|---|---|---|---|
| A | 1240 | 2 | 0.161290% |
| B | 1241 | 7 | 0.564061% |
| C | 1241 | 36 | 2.900886% |
| D | 1241 | 11 | 0.886382% |
Noise dominated data is calculated using 1-second bins in cleaned event files. If a bin has >2000 counts, and if more than 50% of those come from <1% of pixels, then it is considered to be noise-dominated and hence unusable.
| Quadrant | # 1 sec bins | Bins with >0 counts | Bins with >2000 counts | High rate bins dominated by noise | Noise dominated (total time) | Noise dominated (detector-on time) | Marked lightcurve |
|---|---|---|---|---|---|---|---|
| A | 1240 | 1240 | 0 | 0 | 0.00% | 0.00% | 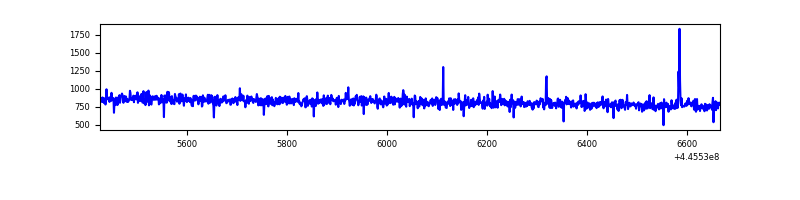 |
| B | 1241 | 1241 | 6 | 6 | 0.48% | 0.48% | 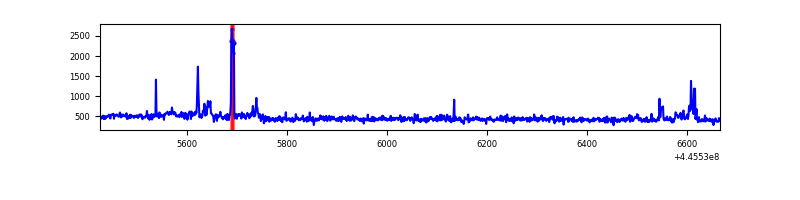 |
| C | 1241 | 1241 | 24 | 24 | 1.93% | 1.93% | 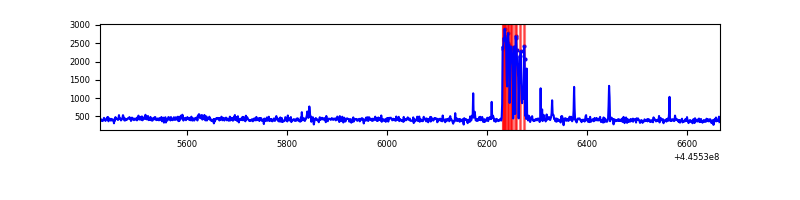 |
| D | 1241 | 1241 | 8 | 8 | 0.64% | 0.64% | 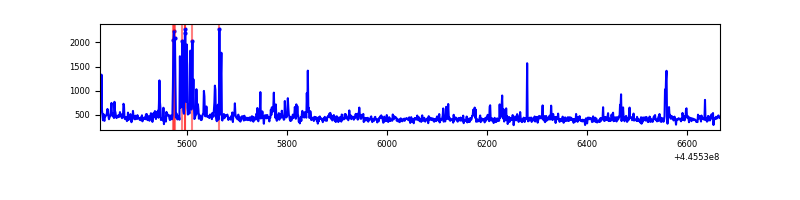 |
Top three noisy pixels from each quadrant. If the there are fewer than three noisy pixels in the level2.evt file, extra rows are filled as -1
| Pixel properties | Quadrant properties | ||||||
|---|---|---|---|---|---|---|---|
| Quadrant | DetID | PixID | Counts | Sigma | Mean | Median | Sigma |
| A | 10 | 83 | 495768 | 16746.54 | 132 | 129 | 29.6 |
| A | 4 | 208 | 2674 | 85.99 | 132 | 129 | 29.6 |
| A | 3 | 137 | 1520 | 47.0 | 132 | 129 | 29.6 |
| B | 5 | 255 | 30658 | 1075.27 | 131 | 127 | 28.4 |
| B | 0 | 183 | 29000 | 1016.88 | 131 | 127 | 28.4 |
| B | 0 | 186 | 6344 | 218.96 | 131 | 127 | 28.4 |
| C | 14 | 254 | 87033 | 2706.1 | 127 | 128 | 32.1 |
| C | 3 | 233 | 3700 | 111.23 | 127 | 128 | 32.1 |
| C | 11 | 16 | 3484 | 104.5 | 127 | 128 | 32.1 |
| D | 13 | 171 | 35079 | 1018.3 | 131 | 127 | 34.3 |
| D | 2 | 120 | 21977 | 636.59 | 131 | 127 | 34.3 |
| D | 5 | 222 | 8803 | 252.77 | 131 | 127 | 34.3 |
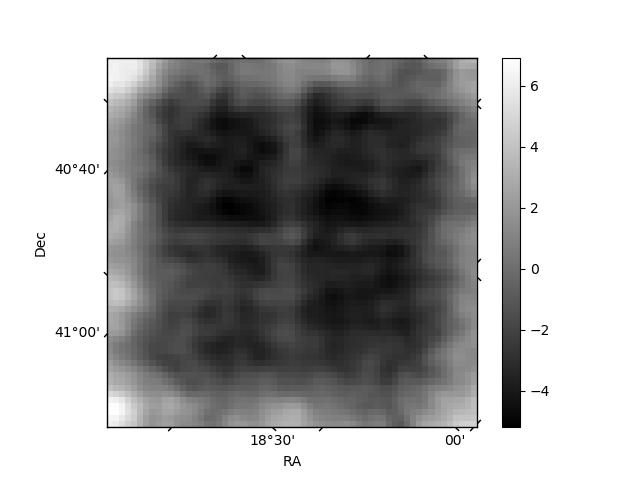
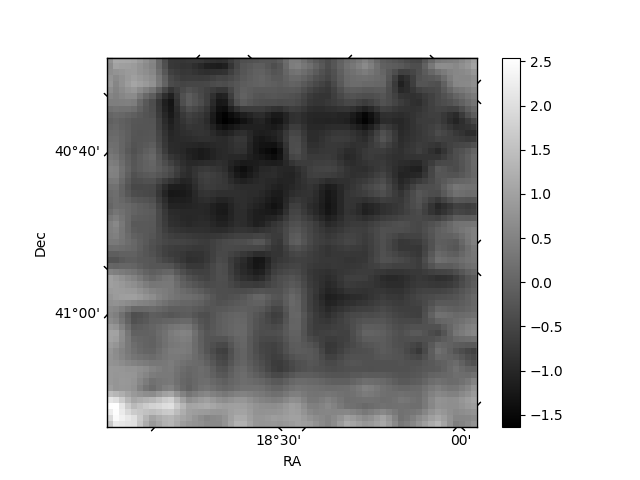
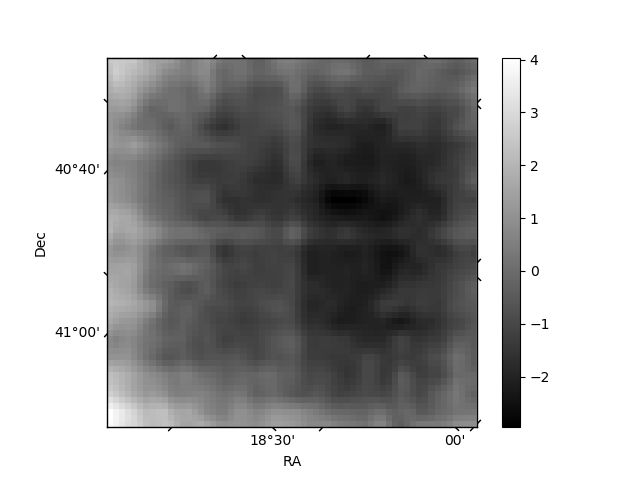
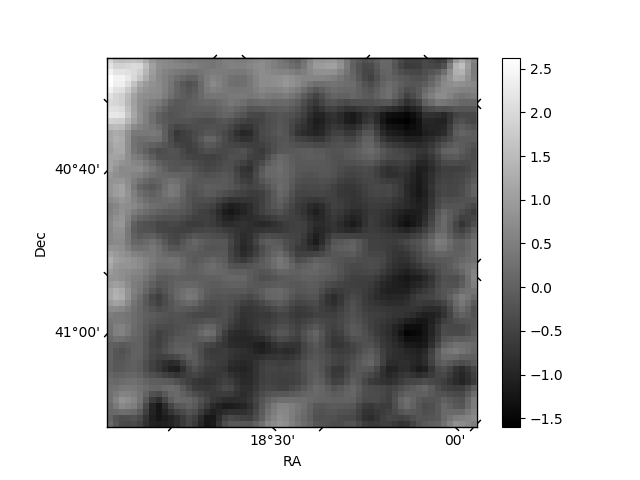
Histogram calculated using DETX and DETY for each event in the final _common_clean file
| Quadrant A | 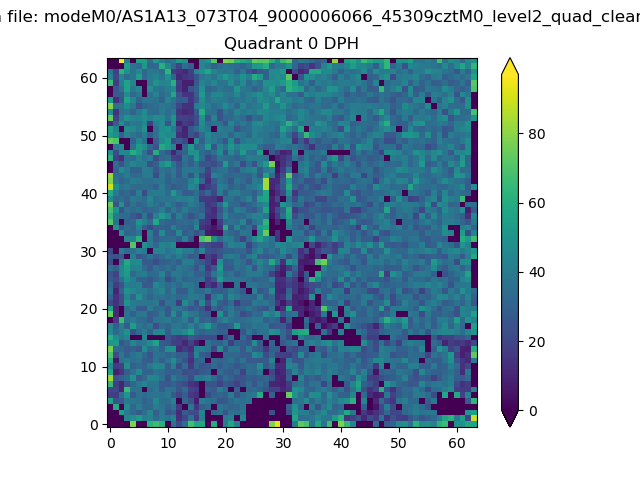 |
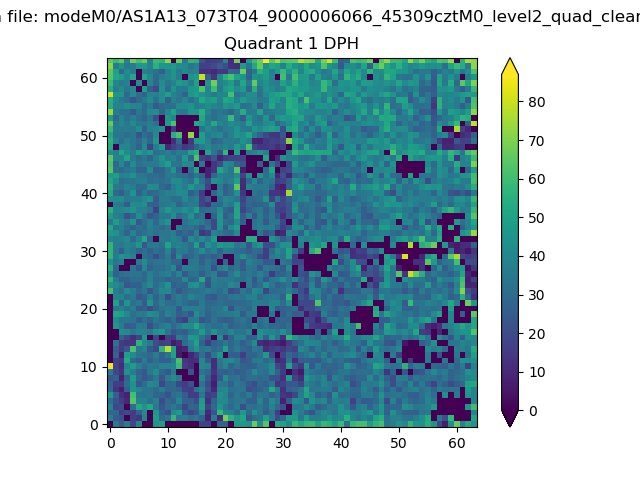 |
Quadrant B |
|---|---|---|---|
| Quadrant D | 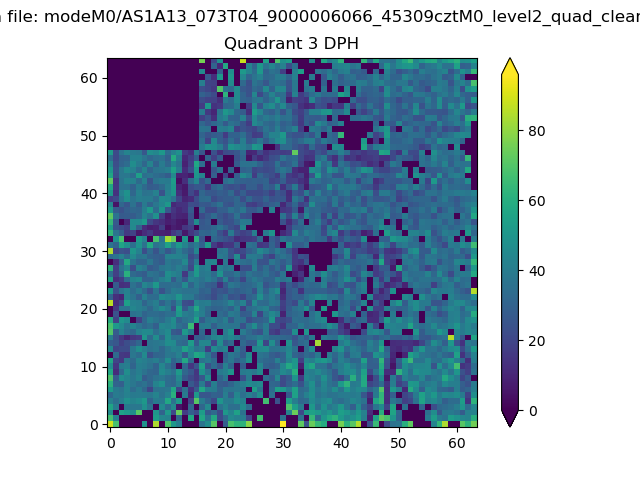 |
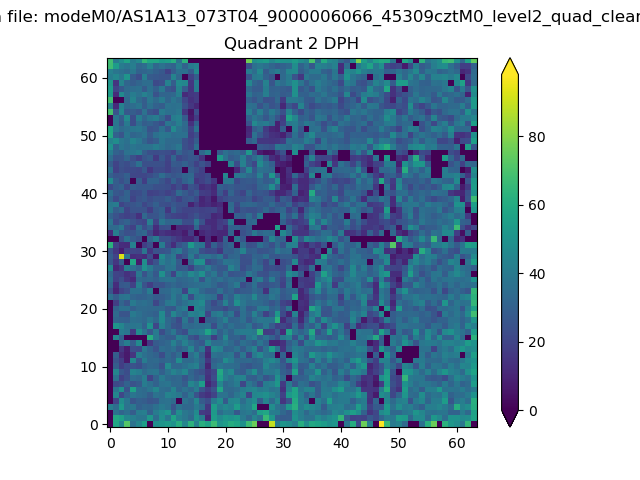 |
Quadrant C |
| Plot type | Count rate plots | Images |
|---|---|---|
| Comparison with Poisson distribution Blue bars denote a histogram of data divided into 1 sec bins. Red curve is a Poisson curve with rate = median count rate of data. |
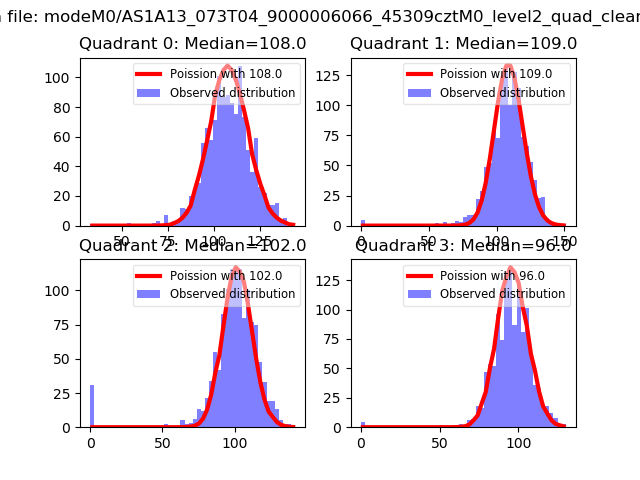 |
 |
| Quadrant-wise count rates Data is divided into 100 sec bins |
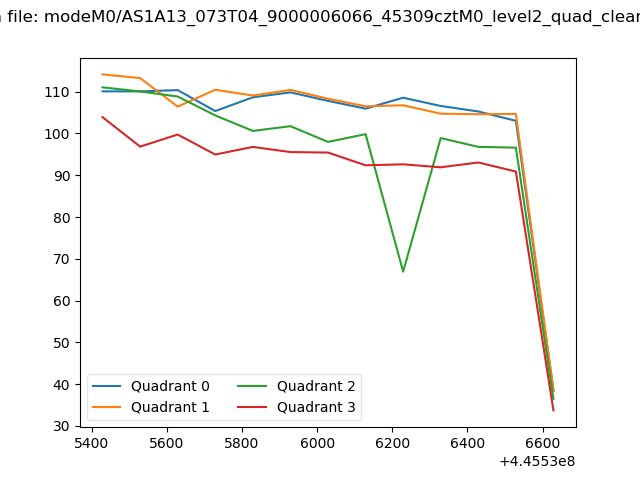 |
|
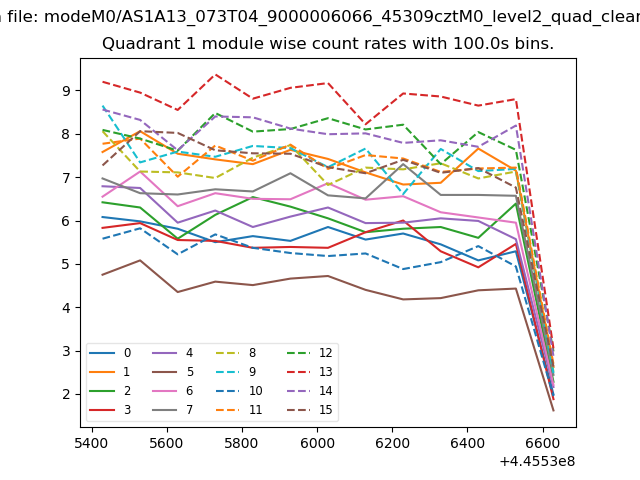
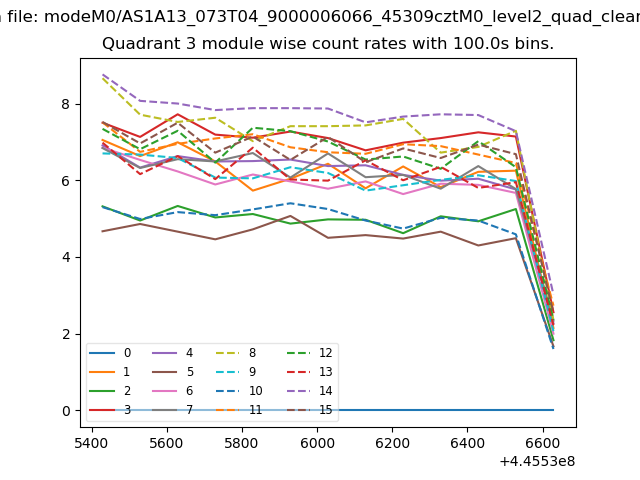
| Module-wise count rates for Quadrant A Data is divided into 100 sec bins |
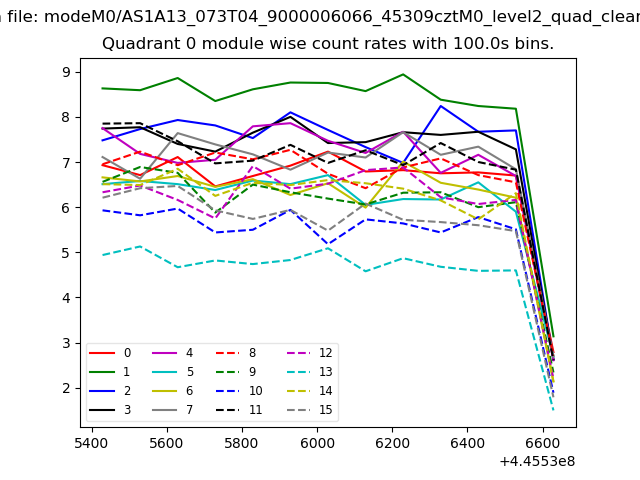 |
 |
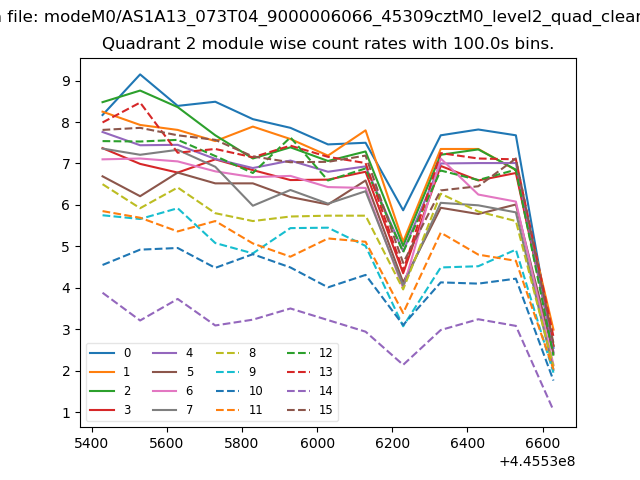
| Module-wise count rates for Quadrant B Data is divided into 100 sec bins |
 |
 |
| Module-wise count rates for Quadrant C Data is divided into 100 sec bins |
 |
 |
| Module-wise count rates for Quadrant D Data is divided into 100 sec bins |
 |
 |
| Parameter | Plot |
|---|---|
| CZT HV Monitor | 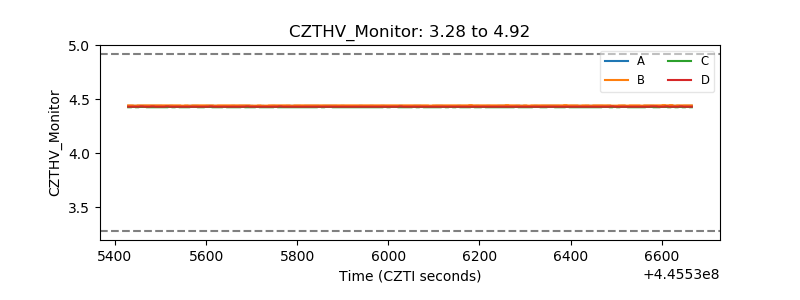 |
| D_VDD | 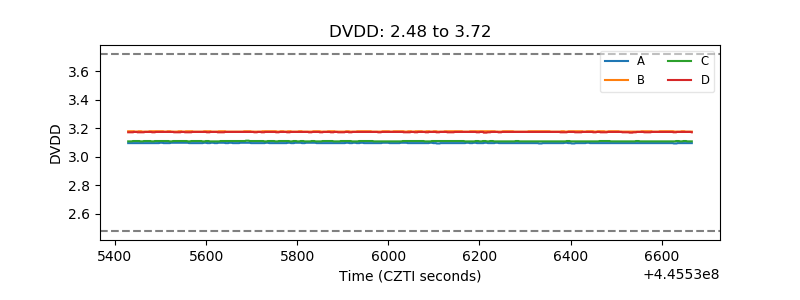 |
| Temperature 1 | 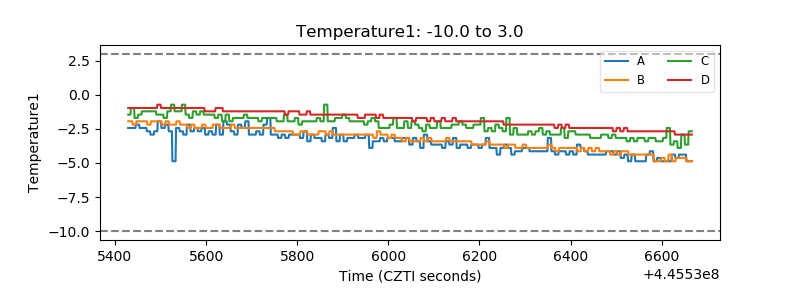 |
| Veto HV Monitor | 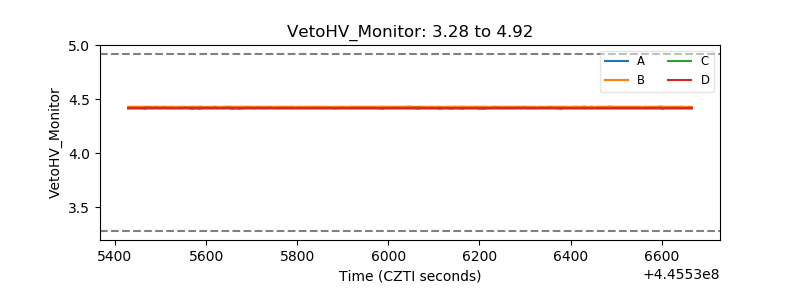 |
| Veto LLD | 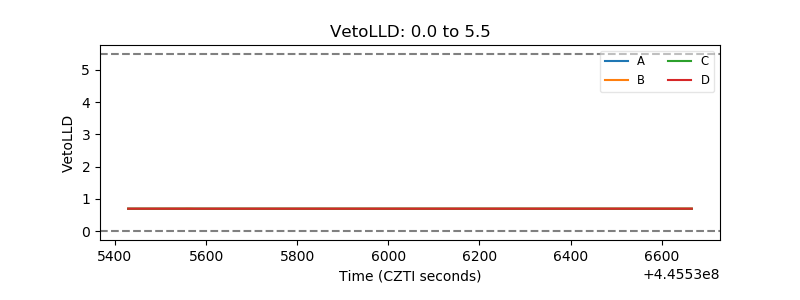 |
| Alpha Counter | 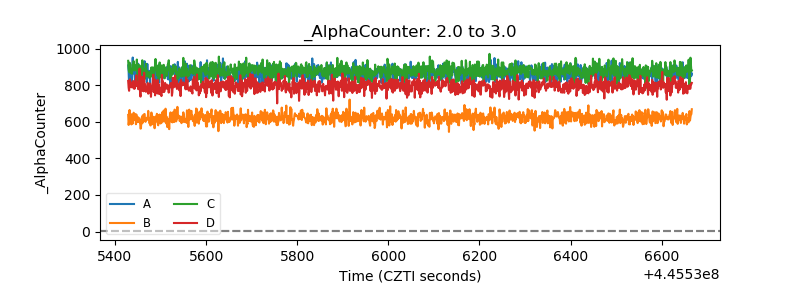 |
| _CPM_Rate | 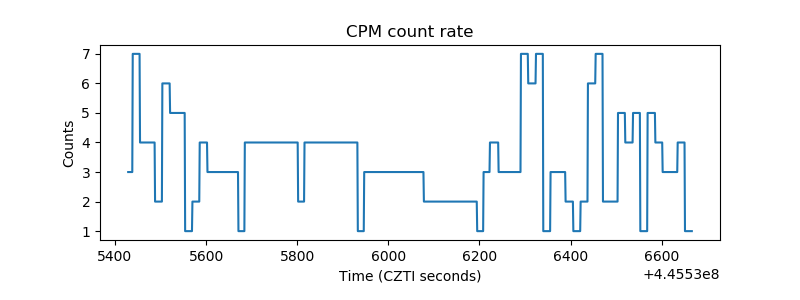 |
| CZT Counter | 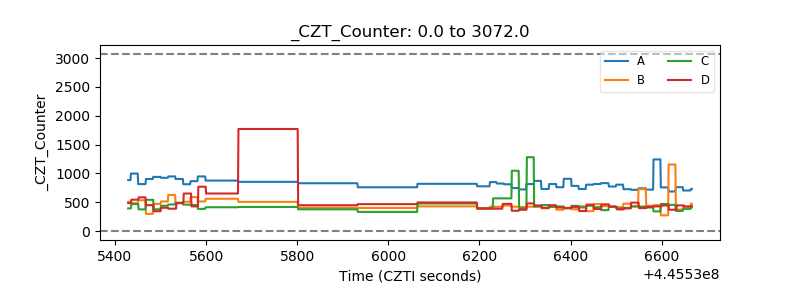 |
| +2.5 Volts monitor | 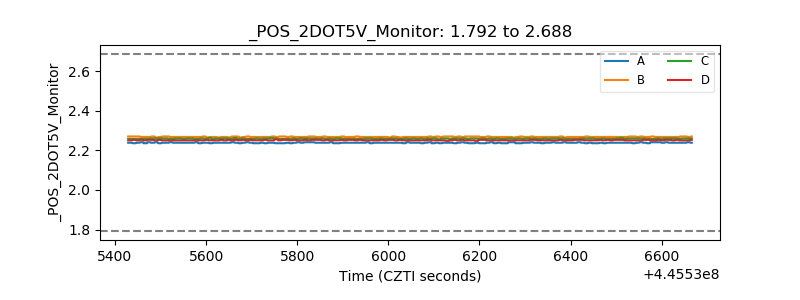 |
| +5 Volts monitor | 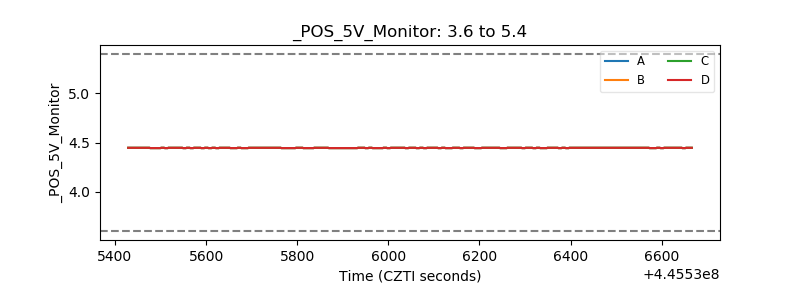 |
| _ROLL_ROT | 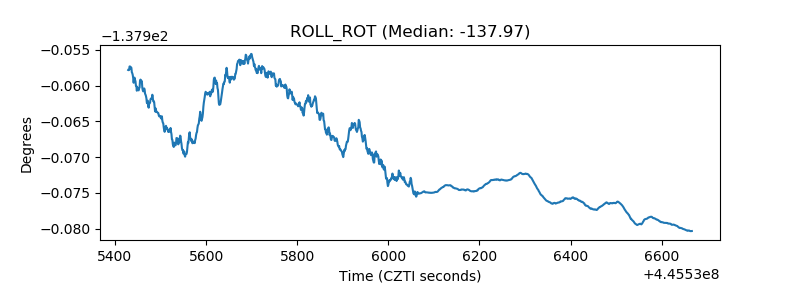 |
| _Roll_DEC | 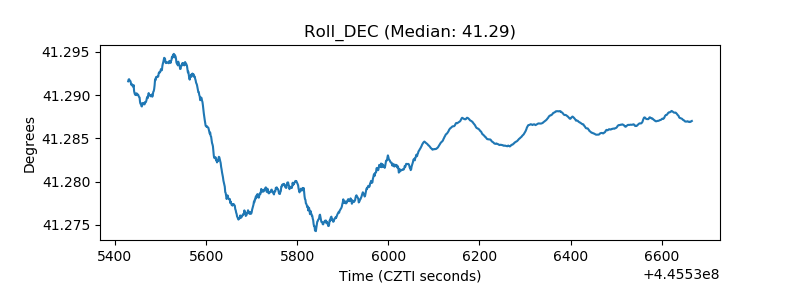 |
| _Roll_RA | 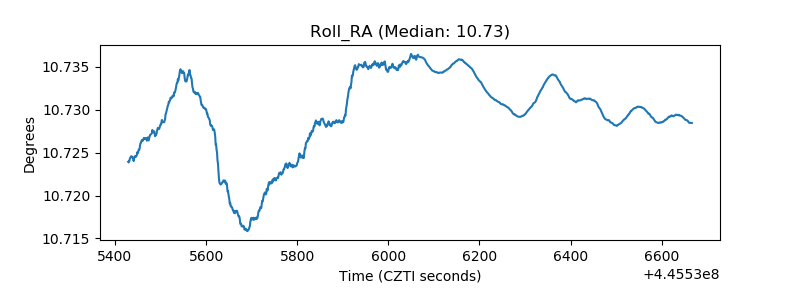 |
| Veto Counter | 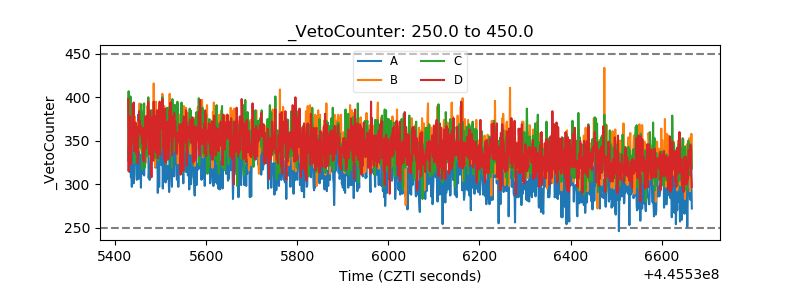 |