| Param | Original file | Final file |
|---|---|---|
| Filename | modeM0/AS1A13_047T01_9000006068_45309cztM0_level2.fits | modeM0/AS1A13_047T01_9000006068_45309cztM0_level2_quad_clean.evt |
| Size (bytes) | 322,050,240 | 68,112,000 |
| Size | 307.1 MB | 65.0 MB |
| Events in quadrant A | 3,906,485 | 447,324 |
| Events in quadrant B | 2,479,811 | 460,937 |
| Events in quadrant C | 2,445,326 | 445,732 |
| Events in quadrant D | 2,757,842 | 407,932 |
| Mode SS | |||
|---|---|---|---|
| Quadrant | BADHDUFLAG | Total packets | Discarded packets |
| A | 0 | 88 | 0 |
| B | 0 | 88 | 0 |
| C | 0 | 88 | 0 |
| D | 0 | 88 | 0 |
| Mode M0 | |||
|---|---|---|---|
| Quadrant | BADHDUFLAG | Total packets | Discarded packets |
| A | 0 | 14606 | 1 |
| B | 0 | 10103 | 2 |
| C | 0 | 10217 | 1 |
| D | 0 | 11207 | 1 |
| Mode M9 | |||
|---|---|---|---|
| Quadrant | BADHDUFLAG | Total packets | Discarded packets |
| A | 0 | 8 | 0 |
| B | 0 | 8 | 0 |
| C | 0 | 8 | 0 |
| D | 0 | 8 | 0 |
| Quadrant | Total seconds | Saturated seconds | Saturation percentage |
|---|---|---|---|
| A | 4262 | 172 | 4.035664% |
| B | 4261 | 145 | 3.402957% |
| C | 4261 | 90 | 2.112180% |
| D | 4261 | 84 | 1.971368% |
Noise dominated data is calculated using 1-second bins in cleaned event files. If a bin has >2000 counts, and if more than 50% of those come from <1% of pixels, then it is considered to be noise-dominated and hence unusable.
| Quadrant | # 1 sec bins | Bins with >0 counts | Bins with >2000 counts | High rate bins dominated by noise | Noise dominated (total time) | Noise dominated (detector-on time) | Marked lightcurve |
|---|---|---|---|---|---|---|---|
| A | 5047 | 4262 | 90 | 90 | 1.78% | 2.11% | 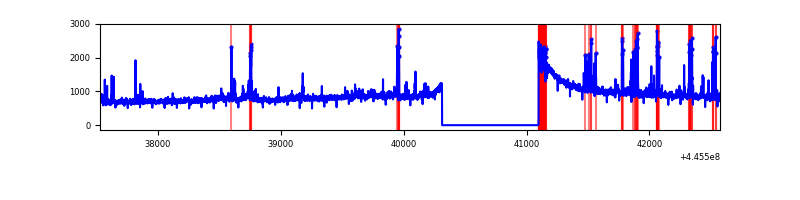 |
| B | 5046 | 4261 | 88 | 88 | 1.74% | 2.07% | 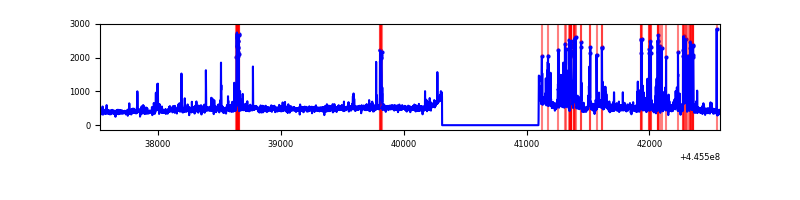 |
| C | 5046 | 4262 | 72 | 72 | 1.43% | 1.69% | 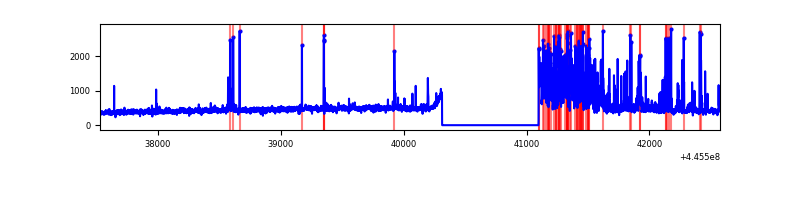 |
| D | 5046 | 4261 | 89 | 89 | 1.76% | 2.09% | 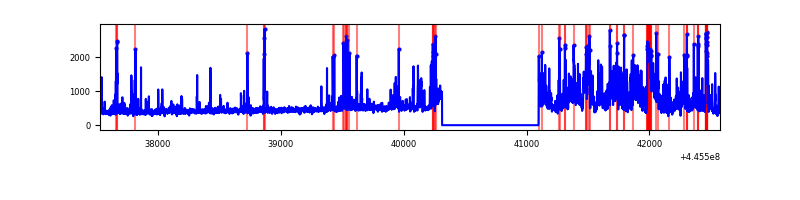 |
Top three noisy pixels from each quadrant. If the there are fewer than three noisy pixels in the level2.evt file, extra rows are filled as -1
| Pixel properties | Quadrant properties | ||||||
|---|---|---|---|---|---|---|---|
| Quadrant | DetID | PixID | Counts | Sigma | Mean | Median | Sigma |
| A | 10 | 83 | 1732825 | 16870.79 | 483 | 473 | 102.7 |
| A | 13 | 248 | 165177 | 1604.0 | 483 | 473 | 102.7 |
| A | 10 | 248 | 78229 | 757.24 | 483 | 473 | 102.7 |
| B | 0 | 186 | 132317 | 1369.96 | 482 | 468 | 96.2 |
| B | 0 | 189 | 122338 | 1266.27 | 482 | 468 | 96.2 |
| B | 5 | 172 | 76195 | 786.83 | 482 | 468 | 96.2 |
| C | 15 | 208 | 310044 | 2714.66 | 474 | 476 | 114.0 |
| C | 14 | 254 | 224823 | 1967.34 | 474 | 476 | 114.0 |
| C | 3 | 233 | 25327 | 217.92 | 474 | 476 | 114.0 |
| D | 13 | 171 | 285414 | 2362.0 | 474 | 458 | 120.6 |
| D | 1 | 52 | 232982 | 1927.39 | 474 | 458 | 120.6 |
| D | 2 | 249 | 128838 | 1064.14 | 474 | 458 | 120.6 |
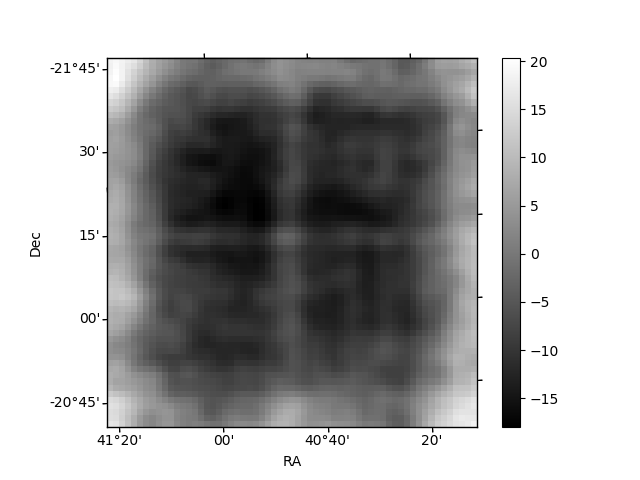
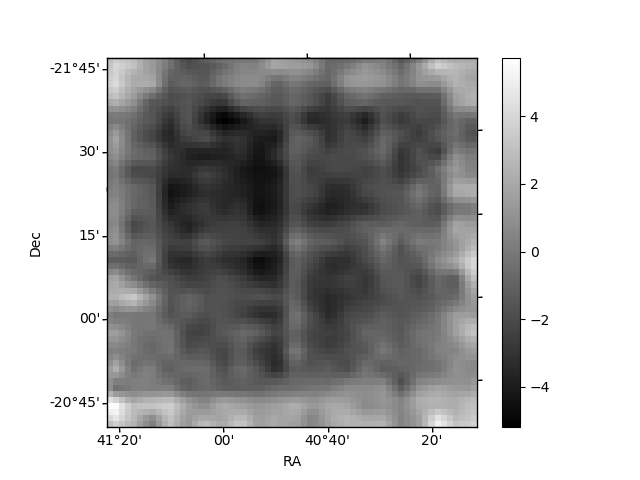
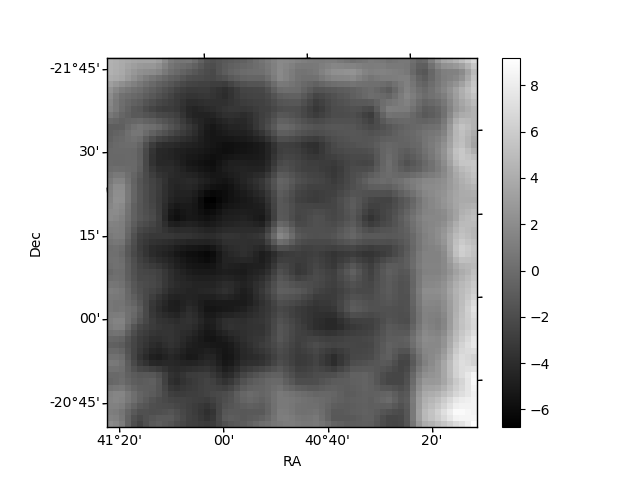
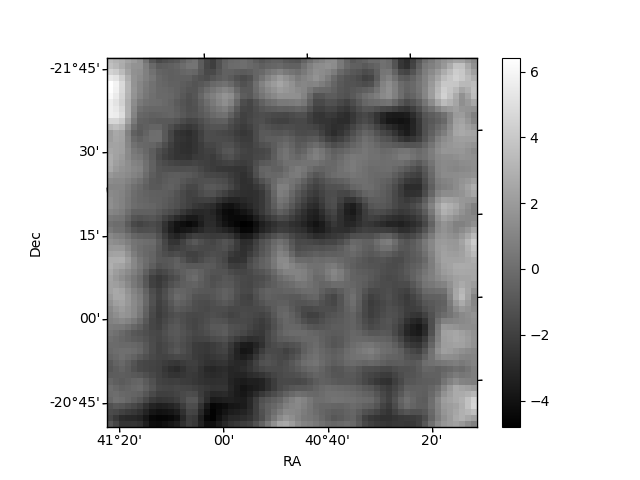
Histogram calculated using DETX and DETY for each event in the final _common_clean file
| Quadrant A | 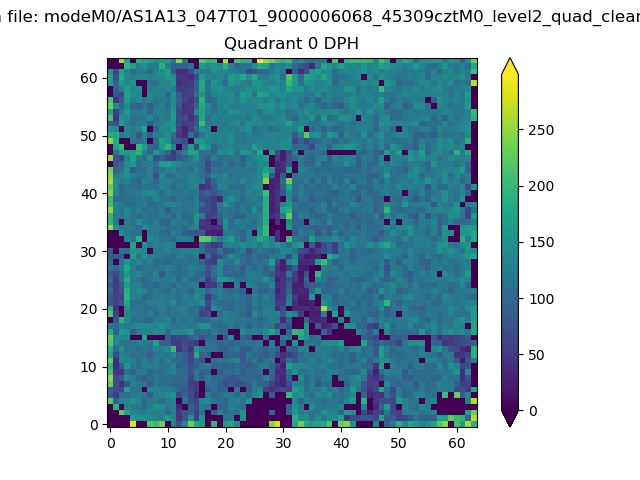 |
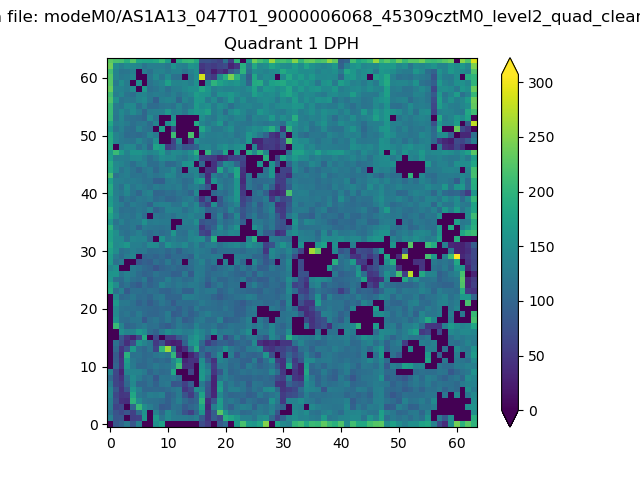 |
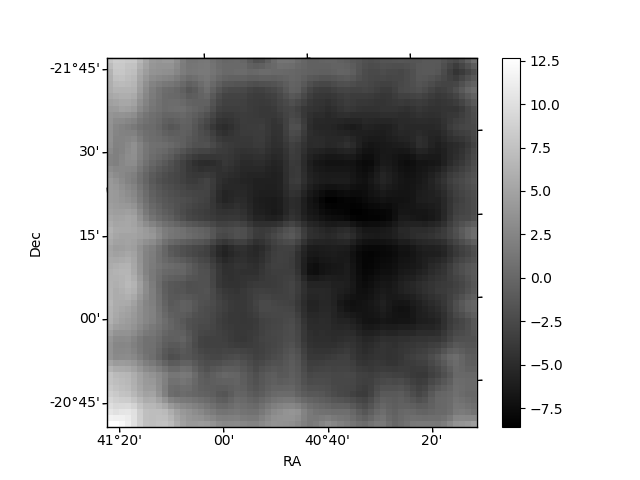
Quadrant B |
|---|---|---|---|
| Quadrant D | 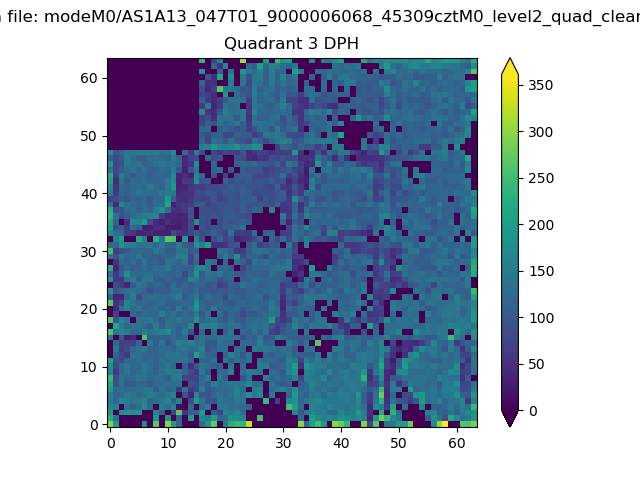 |
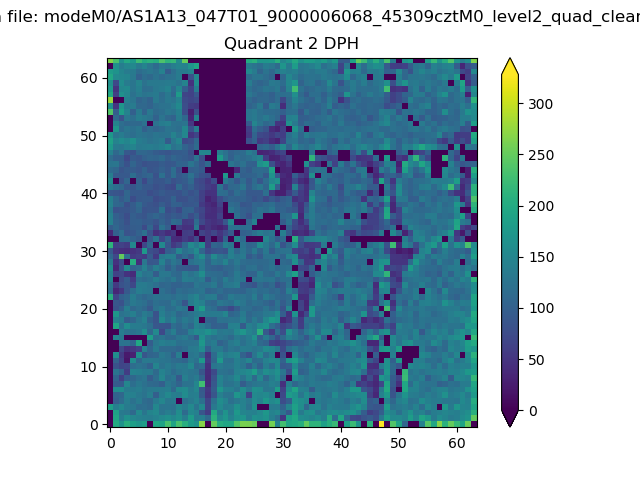 |
Quadrant C |
| Plot type | Count rate plots | Images |
|---|---|---|
| Comparison with Poisson distribution Blue bars denote a histogram of data divided into 1 sec bins. Red curve is a Poisson curve with rate = median count rate of data. |
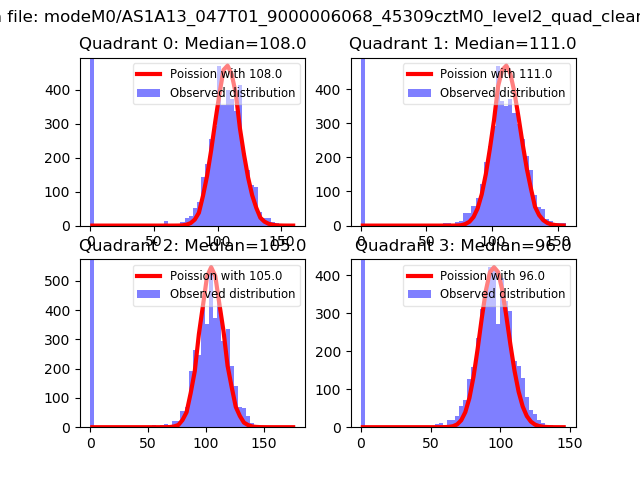 |
 |
| Quadrant-wise count rates Data is divided into 100 sec bins |
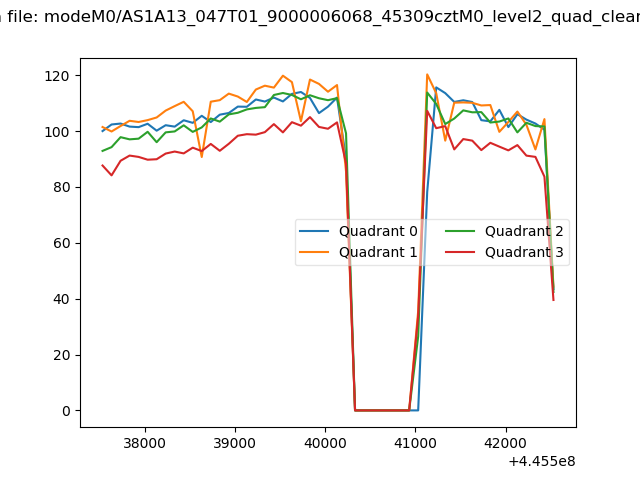 |
|
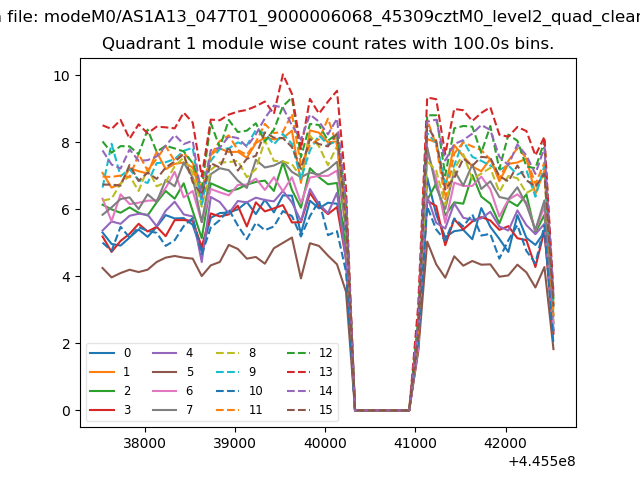
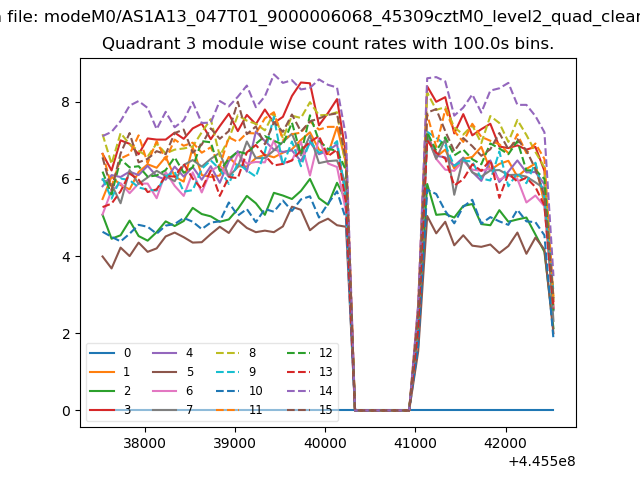
| Module-wise count rates for Quadrant A Data is divided into 100 sec bins |
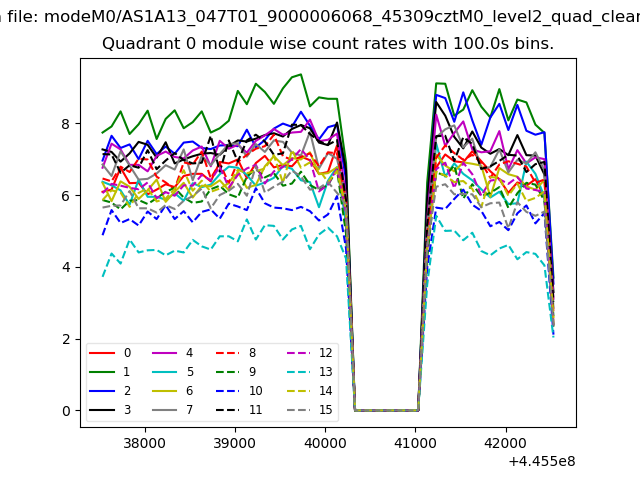 |
 |
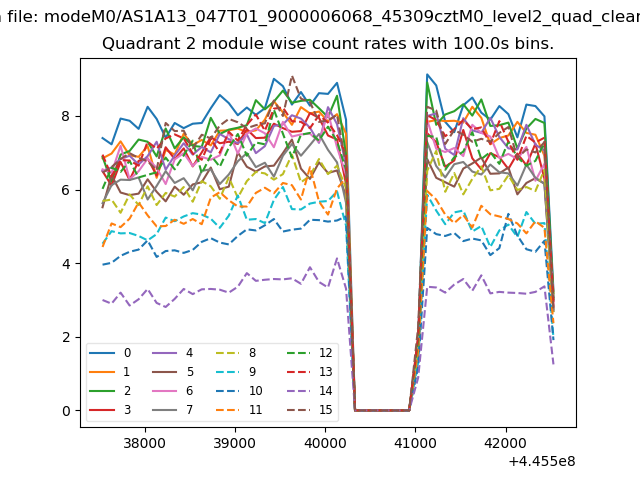
| Module-wise count rates for Quadrant B Data is divided into 100 sec bins |
 |
 |
| Module-wise count rates for Quadrant C Data is divided into 100 sec bins |
 |
 |
| Module-wise count rates for Quadrant D Data is divided into 100 sec bins |
 |
 |
| Parameter | Plot |
|---|---|
| CZT HV Monitor | 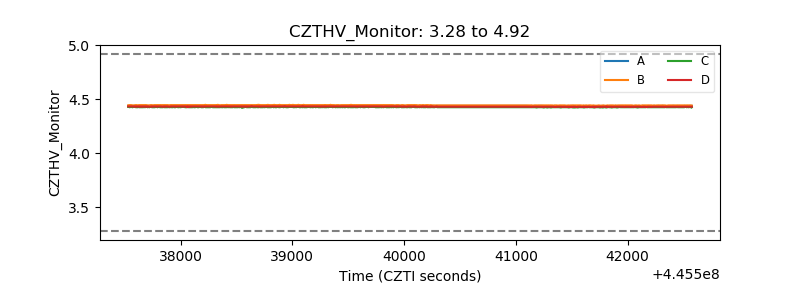 |
| D_VDD | 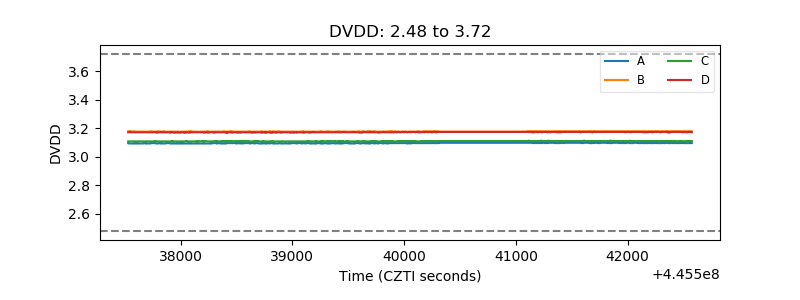 |
| Temperature 1 | 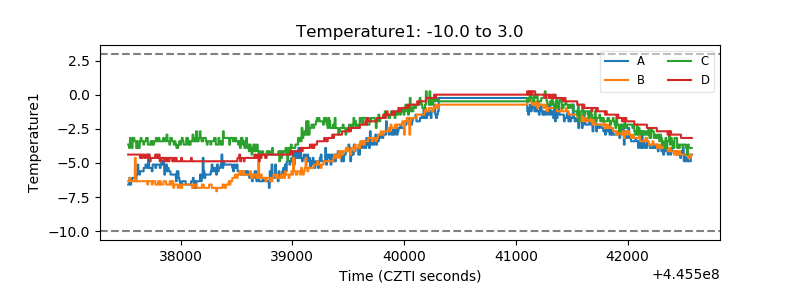 |
| Veto HV Monitor | 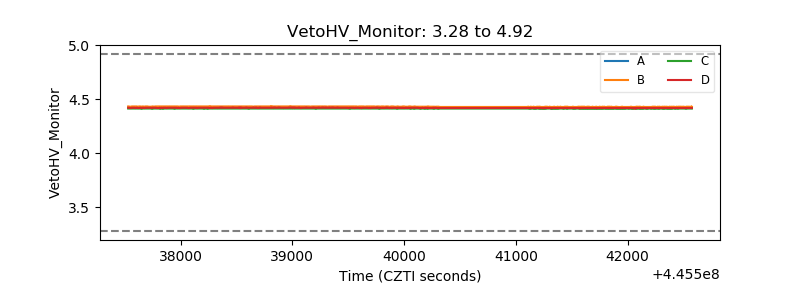 |
| Veto LLD | 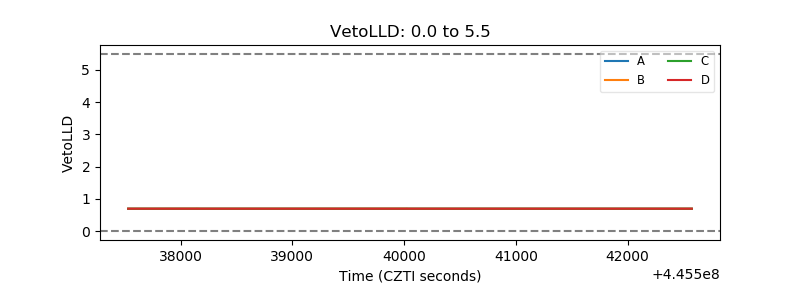 |
| Alpha Counter |  |
| _CPM_Rate | 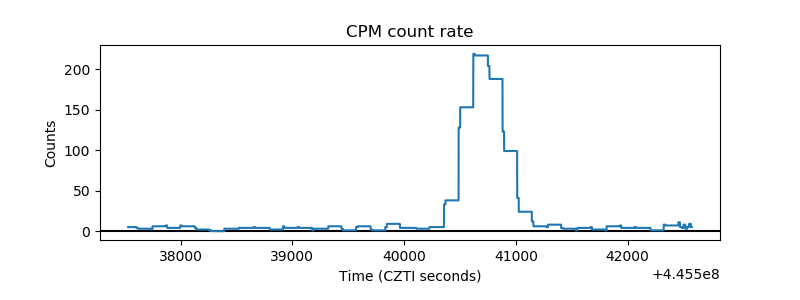 |
| CZT Counter | 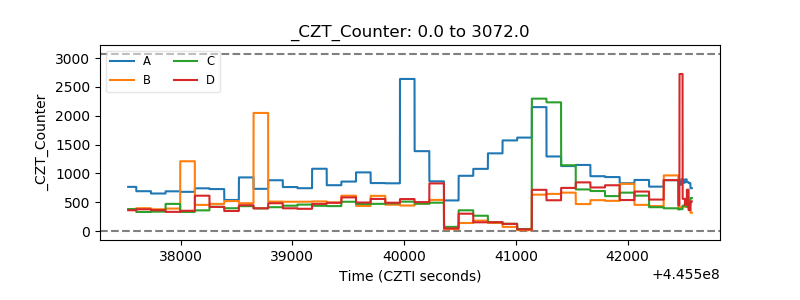 |
| +2.5 Volts monitor | 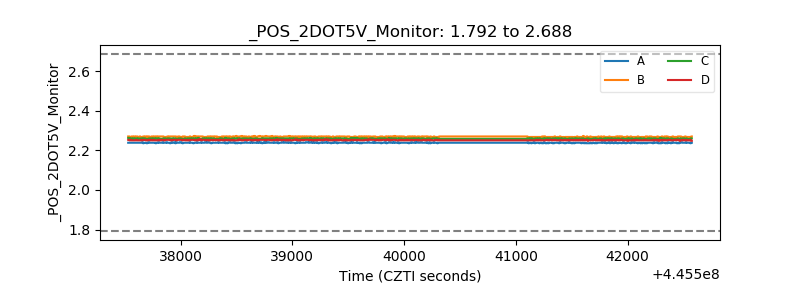 |
| +5 Volts monitor | 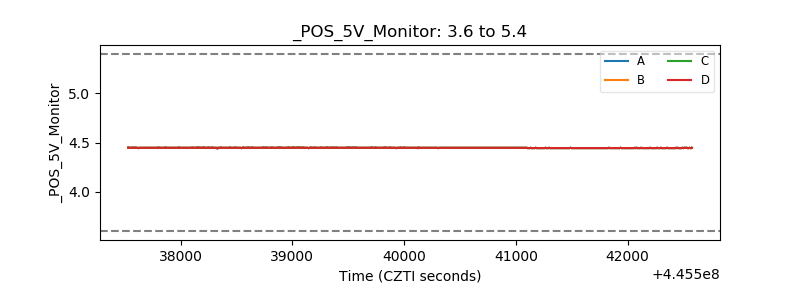 |
| _ROLL_ROT | 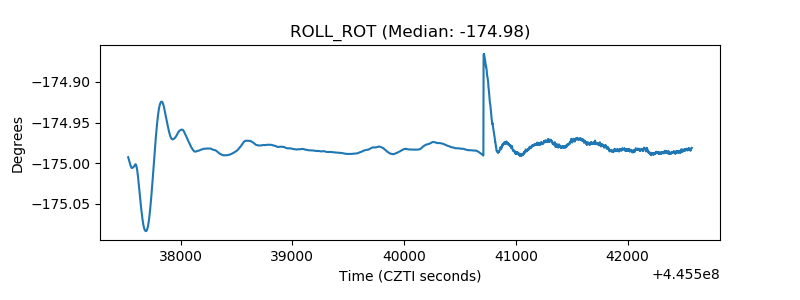 |
| _Roll_DEC | 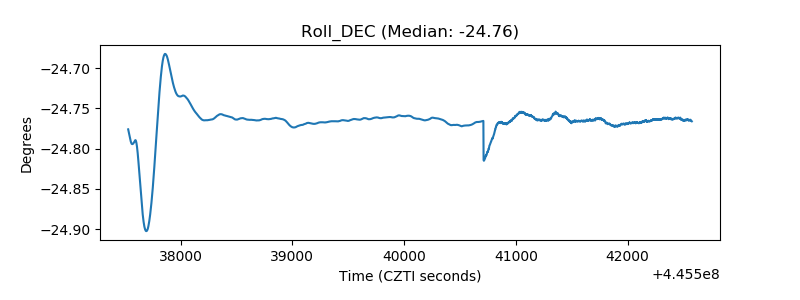 |
| _Roll_RA | 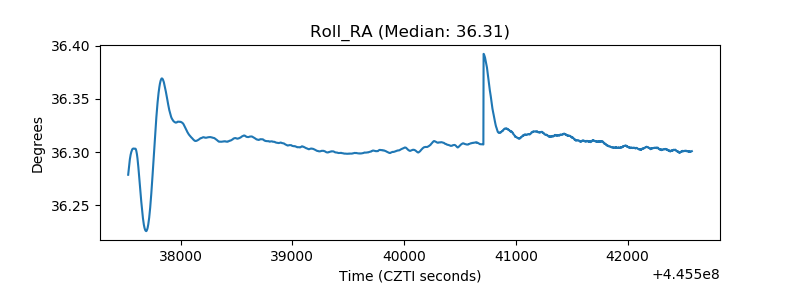 |
| Veto Counter | 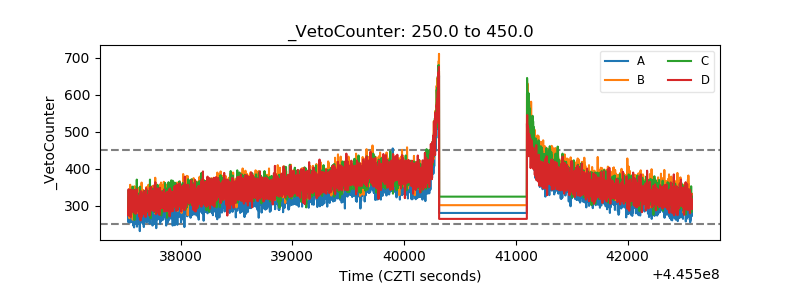 |