| Param | Original file | Final file |
|---|---|---|
| Filename | modeM0/AS1A13_047T01_9000006068_45312cztM0_level2.fits | modeM0/AS1A13_047T01_9000006068_45312cztM0_level2_quad_clean.evt |
| Size (bytes) | 466,704,000 | 107,127,360 |
| Size | 445.1 MB | 102.2 MB |
| Events in quadrant A | 5,781,956 | 709,465 |
| Events in quadrant B | 3,564,283 | 737,422 |
| Events in quadrant C | 3,481,538 | 702,739 |
| Events in quadrant D | 3,939,790 | 637,137 |
| Mode SS | |||
|---|---|---|---|
| Quadrant | BADHDUFLAG | Total packets | Discarded packets |
| A | 0 | 132 | 0 |
| B | 0 | 132 | 0 |
| C | 0 | 132 | 0 |
| D | 0 | 132 | 0 |
| Mode M0 | |||
|---|---|---|---|
| Quadrant | BADHDUFLAG | Total packets | Discarded packets |
| A | 0 | 21949 | 2 |
| B | 0 | 15154 | 2 |
| C | 0 | 15003 | 2 |
| D | 0 | 16385 | 2 |
| Mode M9 | |||
|---|---|---|---|
| Quadrant | BADHDUFLAG | Total packets | Discarded packets |
| A | 0 | 17 | 0 |
| B | 0 | 17 | 0 |
| C | 0 | 18 | 0 |
| D | 0 | 18 | 0 |
| Quadrant | Total seconds | Saturated seconds | Saturation percentage |
|---|---|---|---|
| A | 6552 | 167 | 2.548840% |
| B | 6552 | 99 | 1.510989% |
| C | 6552 | 110 | 1.678877% |
| D | 6552 | 110 | 1.678877% |
Noise dominated data is calculated using 1-second bins in cleaned event files. If a bin has >2000 counts, and if more than 50% of those come from <1% of pixels, then it is considered to be noise-dominated and hence unusable.
| Quadrant | # 1 sec bins | Bins with >0 counts | Bins with >2000 counts | High rate bins dominated by noise | Noise dominated (total time) | Noise dominated (detector-on time) | Marked lightcurve |
|---|---|---|---|---|---|---|---|
| A | 7673 | 6554 | 88 | 88 | 1.15% | 1.34% | 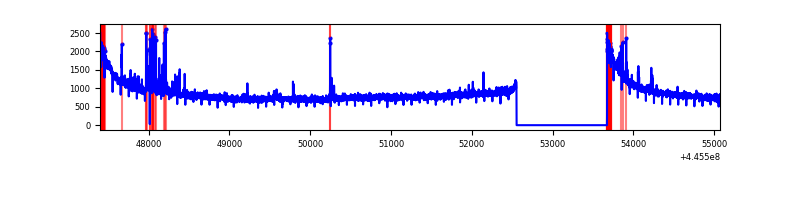 |
| B | 7673 | 6554 | 55 | 55 | 0.72% | 0.84% | 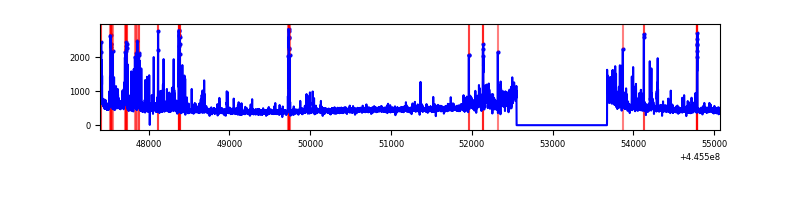 |
| C | 7673 | 6554 | 106 | 106 | 1.38% | 1.62% | 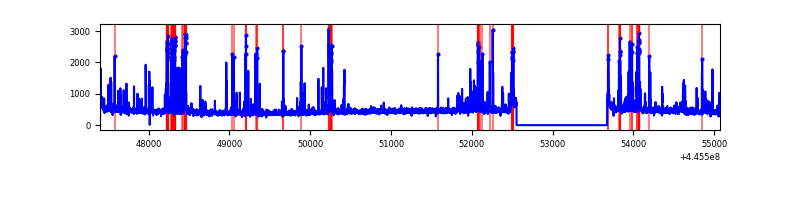 |
| D | 7673 | 6553 | 124 | 124 | 1.62% | 1.89% | 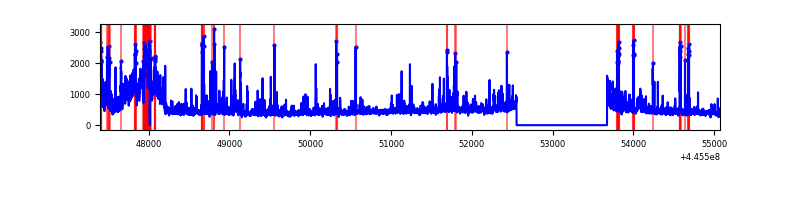 |
Top three noisy pixels from each quadrant. If the there are fewer than three noisy pixels in the level2.evt file, extra rows are filled as -1
| Pixel properties | Quadrant properties | ||||||
|---|---|---|---|---|---|---|---|
| Quadrant | DetID | PixID | Counts | Sigma | Mean | Median | Sigma |
| A | 10 | 83 | 2783695 | 18368.0 | 729 | 713 | 151.5 |
| A | 13 | 248 | 91523 | 599.36 | 729 | 713 | 151.5 |
| A | 10 | 248 | 48154 | 313.12 | 729 | 713 | 151.5 |
| B | 0 | 155 | 152810 | 1050.53 | 735 | 713 | 144.8 |
| B | 4 | 158 | 144059 | 990.09 | 735 | 713 | 144.8 |
| B | 0 | 186 | 91391 | 626.31 | 735 | 713 | 144.8 |
| C | 14 | 254 | 606421 | 3572.44 | 716 | 724 | 169.5 |
| C | 12 | 2 | 33067 | 190.76 | 716 | 724 | 169.5 |
| C | 3 | 233 | 22477 | 128.3 | 716 | 724 | 169.5 |
| D | 1 | 52 | 412675 | 2308.08 | 709 | 688 | 178.5 |
| D | 13 | 29 | 153507 | 856.14 | 709 | 688 | 178.5 |
| D | 13 | 171 | 145889 | 813.46 | 709 | 688 | 178.5 |
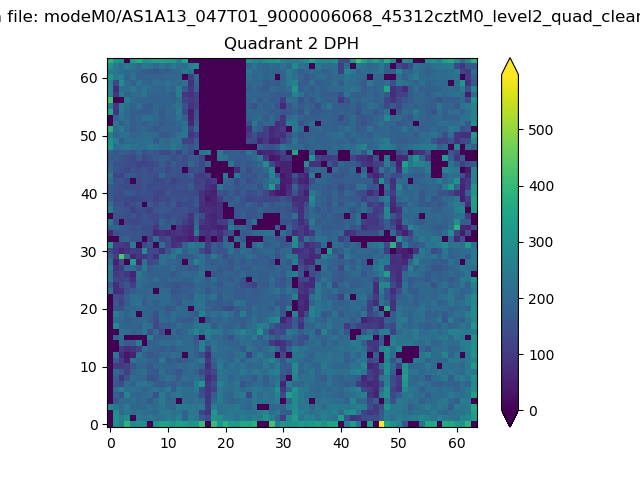
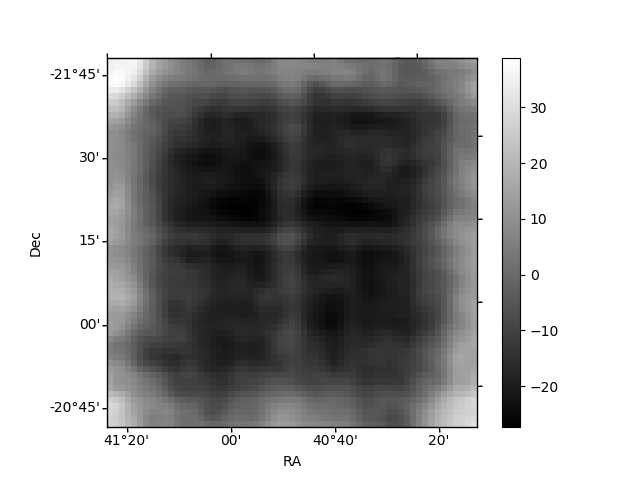
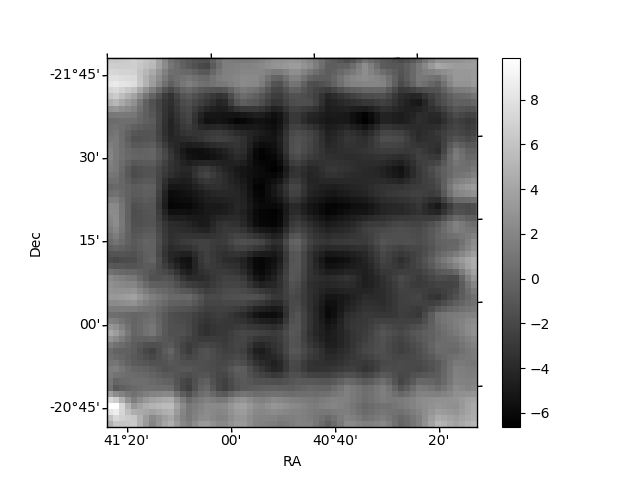
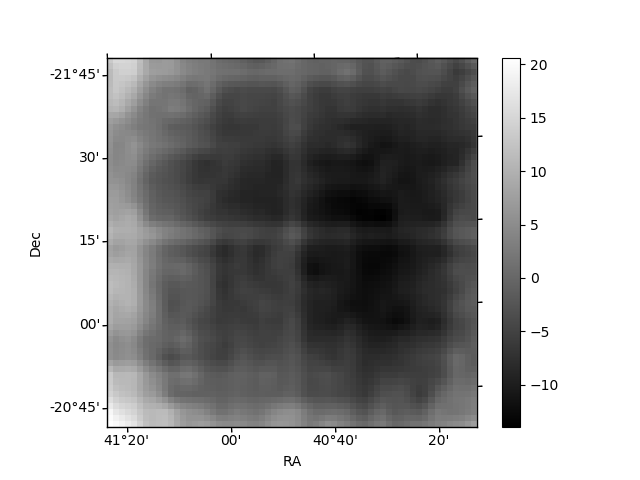
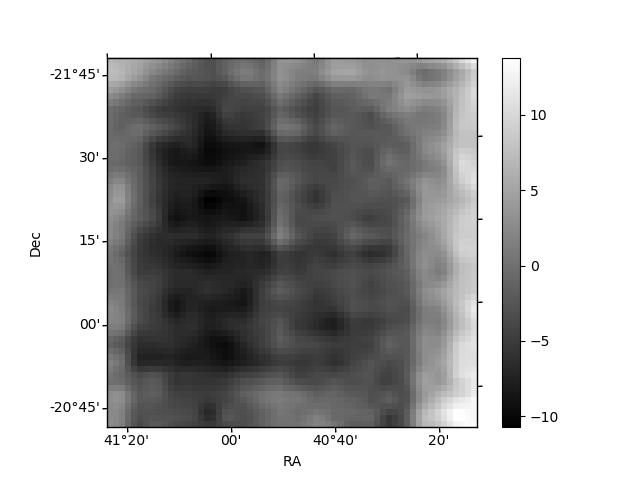
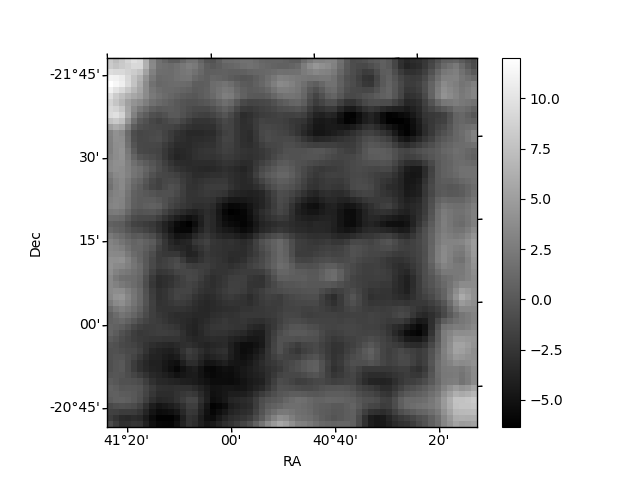
Histogram calculated using DETX and DETY for each event in the final _common_clean file
| Quadrant A | 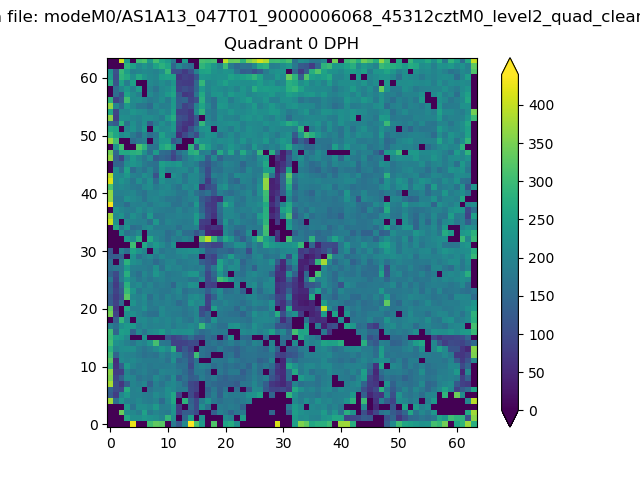 |
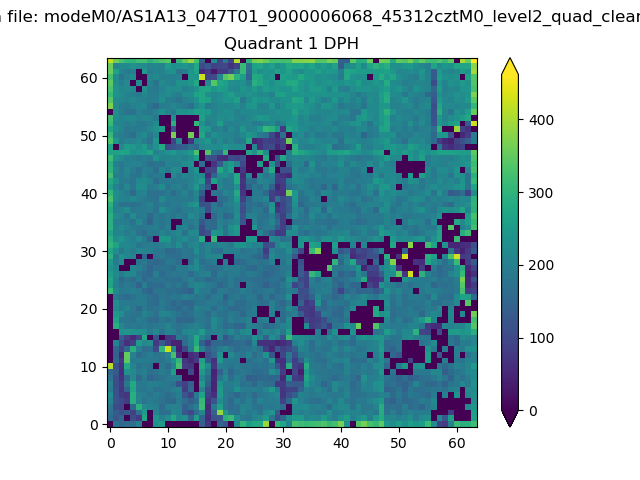 |
Quadrant B |
|---|---|---|---|
| Quadrant D | 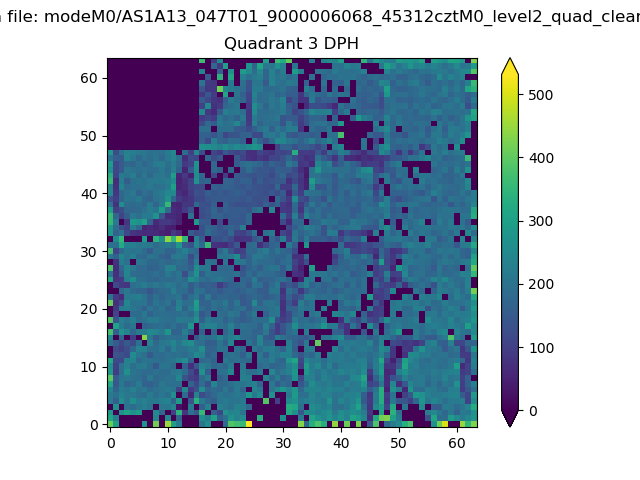 |
 |
Quadrant C |
| Plot type | Count rate plots | Images |
|---|---|---|
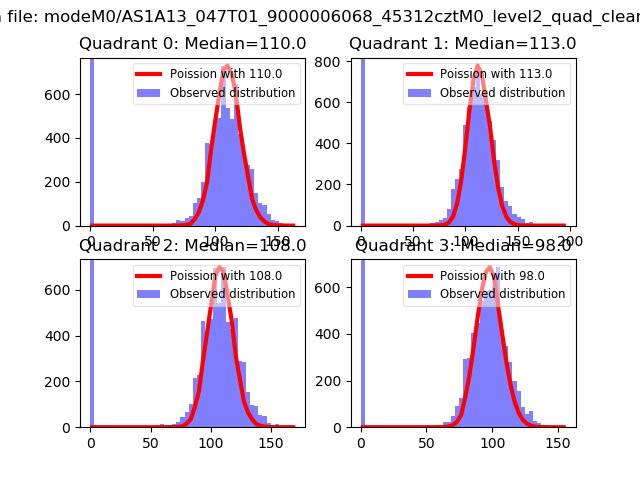
| Comparison with Poisson distribution Blue bars denote a histogram of data divided into 1 sec bins. Red curve is a Poisson curve with rate = median count rate of data. |
 |
 |
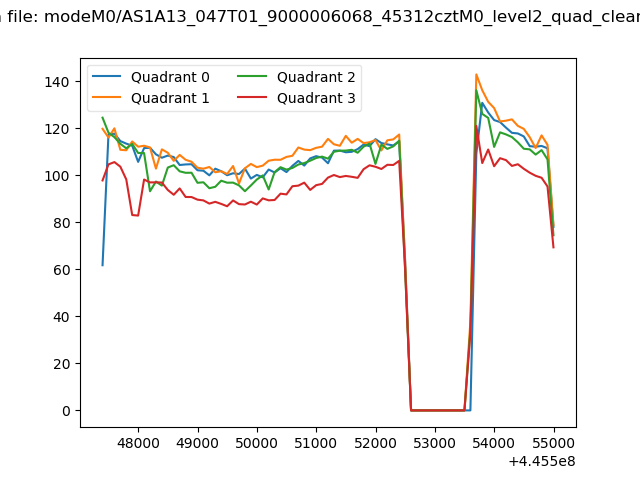
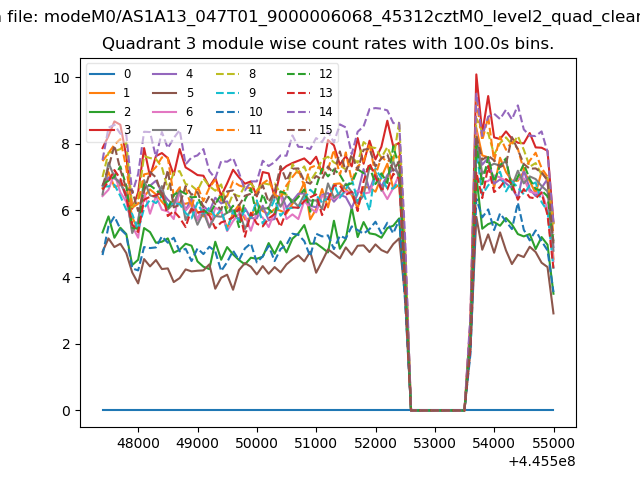
| Quadrant-wise count rates Data is divided into 100 sec bins |
 |
|
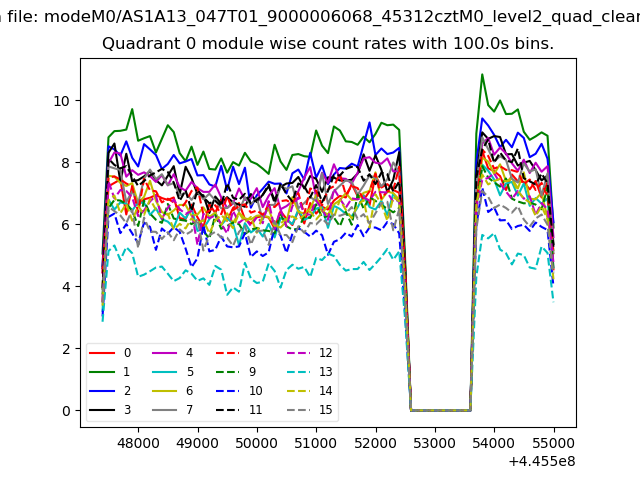
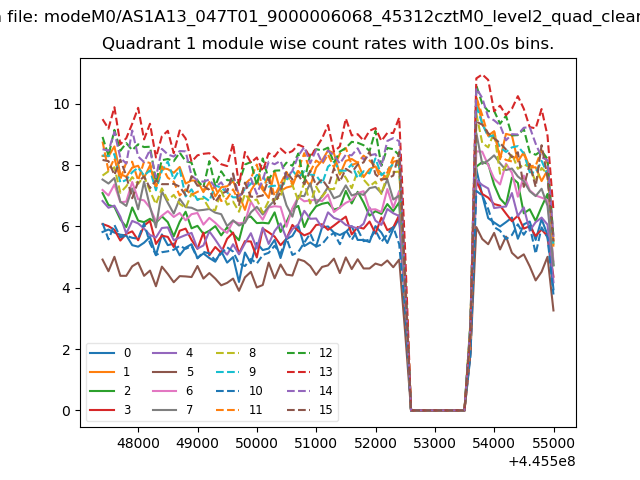
| Module-wise count rates for Quadrant A Data is divided into 100 sec bins |
 |
 |
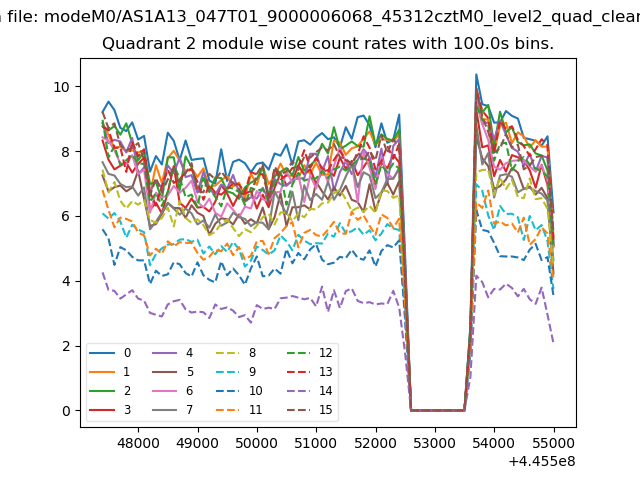
| Module-wise count rates for Quadrant B Data is divided into 100 sec bins |
 |
 |
| Module-wise count rates for Quadrant C Data is divided into 100 sec bins |
 |
 |
| Module-wise count rates for Quadrant D Data is divided into 100 sec bins |
 |
 |
| Parameter | Plot |
|---|---|
| CZT HV Monitor | 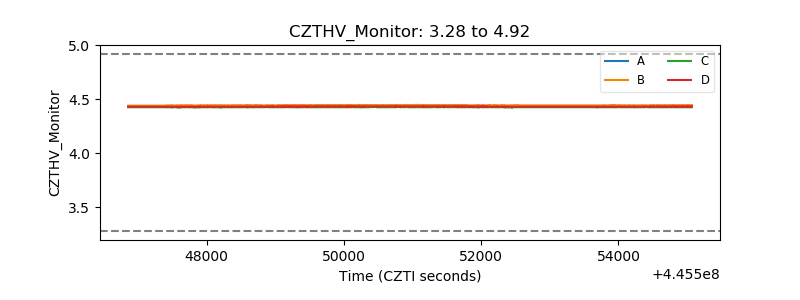 |
| D_VDD | 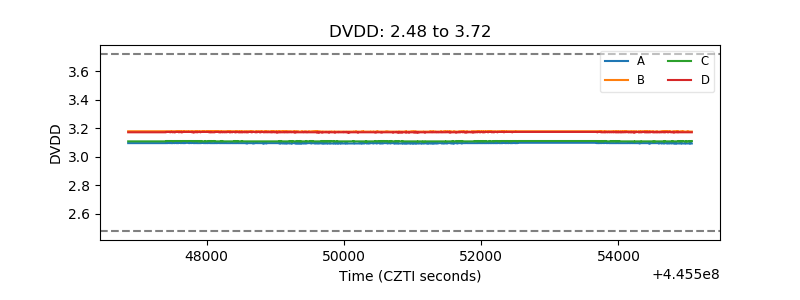 |
| Temperature 1 | 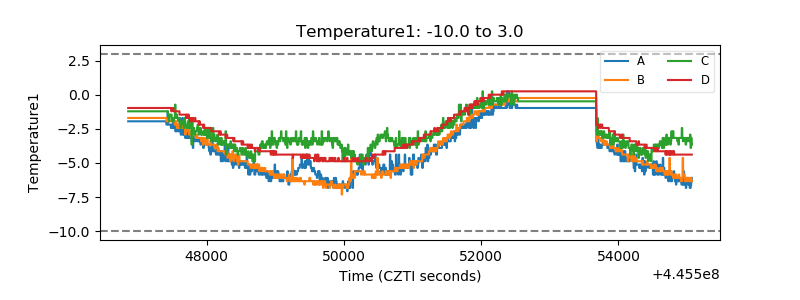 |
| Veto HV Monitor | 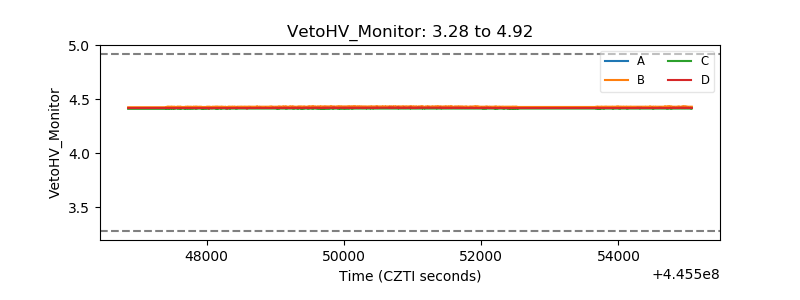 |
| Veto LLD | 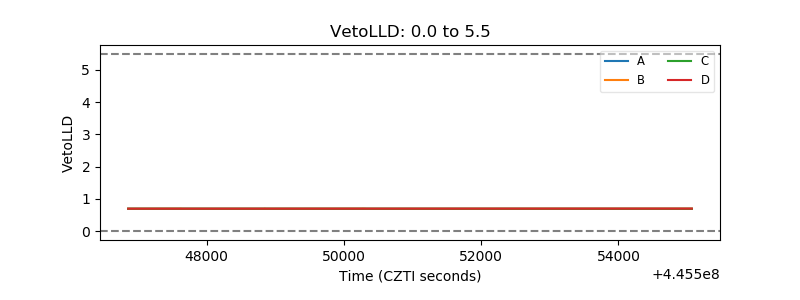 |
| Alpha Counter | 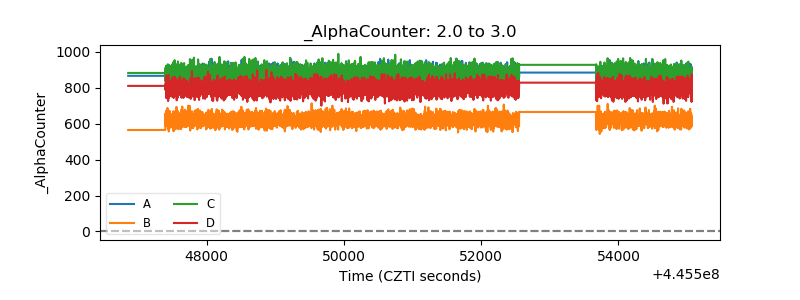 |
| _CPM_Rate |  |
| CZT Counter | 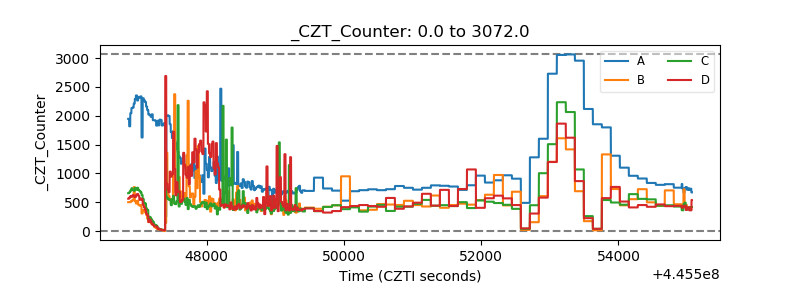 |
| +2.5 Volts monitor | 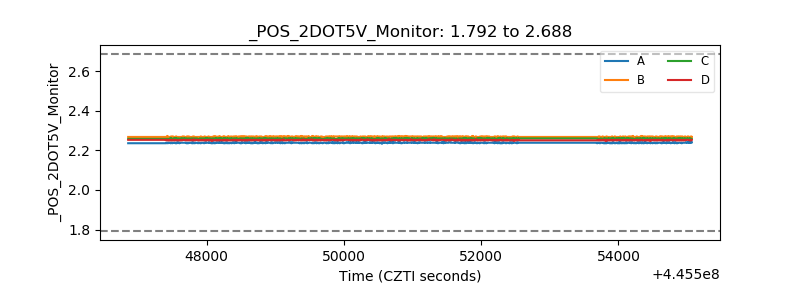 |
| +5 Volts monitor | 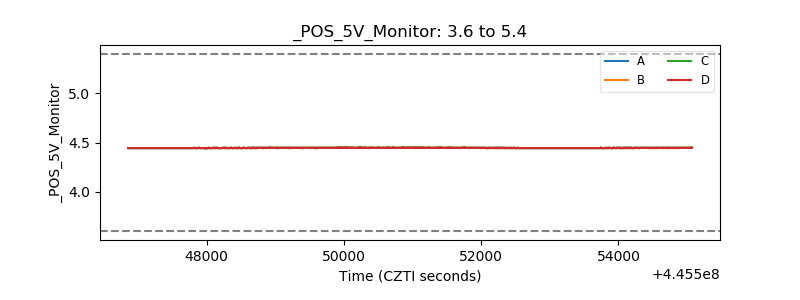 |
| _ROLL_ROT | 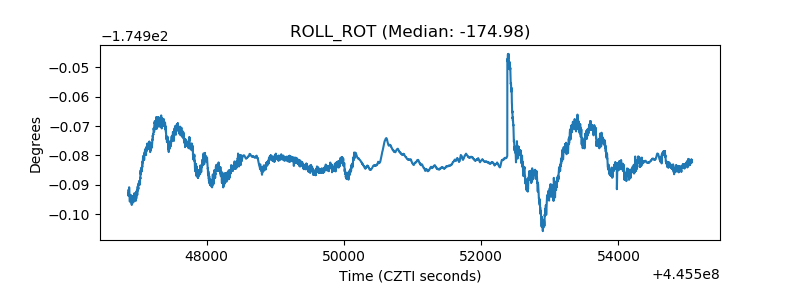 |
| _Roll_DEC | 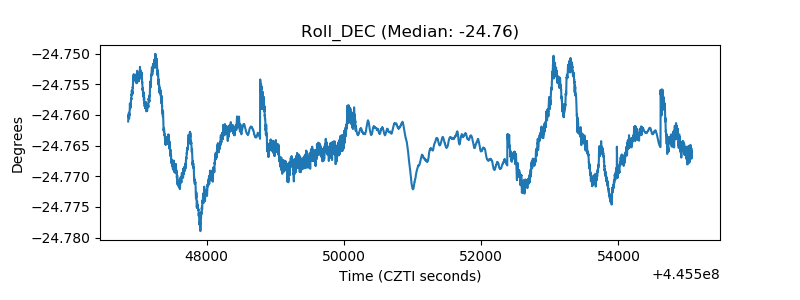 |
| _Roll_RA | 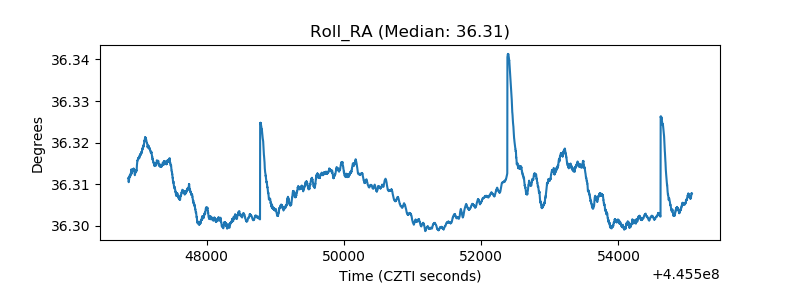 |
| Veto Counter | 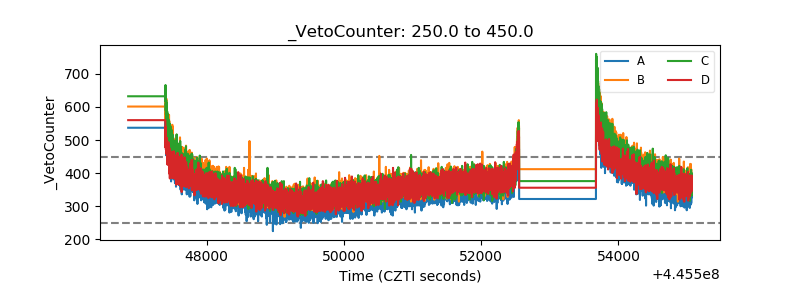 |