| Param | Original file | Final file |
|---|---|---|
| Filename | modeM0/AS1A13_047T01_9000006068_45314cztM0_level2.fits | modeM0/AS1A13_047T01_9000006068_45314cztM0_level2_quad_clean.evt |
| Size (bytes) | 521,213,760 | 114,880,320 |
| Size | 497.1 MB | 109.6 MB |
| Events in quadrant A | 5,717,450 | 775,471 |
| Events in quadrant B | 3,377,047 | 820,994 |
| Events in quadrant C | 4,578,703 | 741,703 |
| Events in quadrant D | 5,115,173 | 685,797 |
| Mode SS | |||
|---|---|---|---|
| Quadrant | BADHDUFLAG | Total packets | Discarded packets |
| A | 0 | 132 | 0 |
| B | 0 | 132 | 0 |
| C | 0 | 132 | 0 |
| D | 0 | 132 | 0 |
| Mode M0 | |||
|---|---|---|---|
| Quadrant | BADHDUFLAG | Total packets | Discarded packets |
| A | 0 | 21554 | 2 |
| B | 0 | 14109 | 2 |
| C | 0 | 17899 | 2 |
| D | 0 | 19601 | 2 |
| Mode M9 | |||
|---|---|---|---|
| Quadrant | BADHDUFLAG | Total packets | Discarded packets |
| A | 0 | 18 | 0 |
| B | 0 | 19 | 0 |
| C | 0 | 19 | 0 |
| D | 0 | 19 | 0 |
| Quadrant | Total seconds | Saturated seconds | Saturation percentage |
|---|---|---|---|
| A | 6520 | 161 | 2.469325% |
| B | 6520 | 67 | 1.027607% |
| C | 6520 | 371 | 5.690184% |
| D | 6520 | 247 | 3.788344% |
Noise dominated data is calculated using 1-second bins in cleaned event files. If a bin has >2000 counts, and if more than 50% of those come from <1% of pixels, then it is considered to be noise-dominated and hence unusable.
| Quadrant | # 1 sec bins | Bins with >0 counts | Bins with >2000 counts | High rate bins dominated by noise | Noise dominated (total time) | Noise dominated (detector-on time) | Marked lightcurve |
|---|---|---|---|---|---|---|---|
| A | 7790 | 6520 | 64 | 64 | 0.82% | 0.98% | 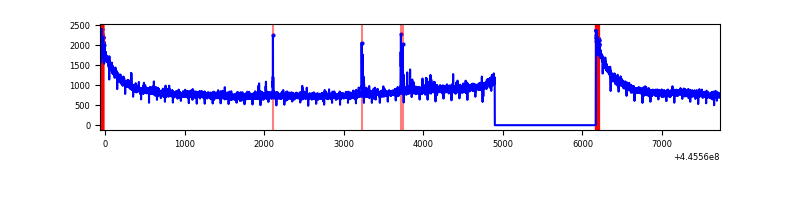 |
| B | 7790 | 6520 | 19 | 19 | 0.24% | 0.29% | 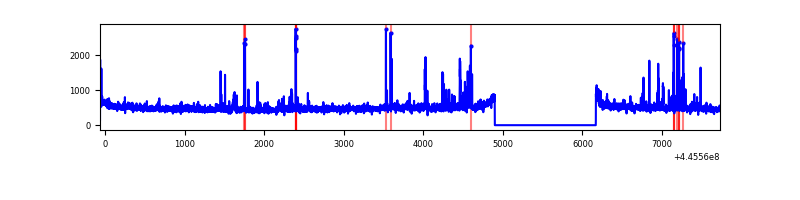 |
| C | 7790 | 6520 | 358 | 358 | 4.60% | 5.49% | 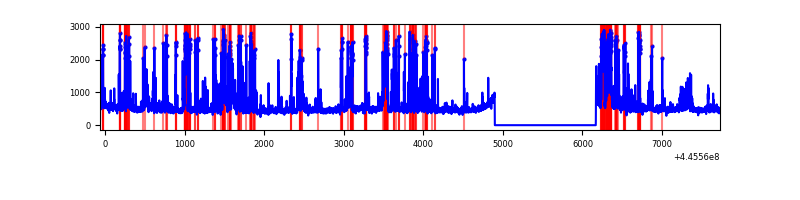 |
| D | 7790 | 6520 | 218 | 218 | 2.80% | 3.34% | 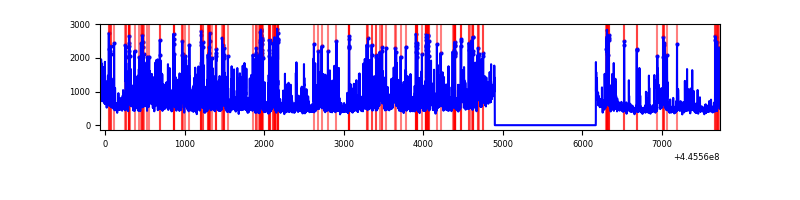 |
Top three noisy pixels from each quadrant. If the there are fewer than three noisy pixels in the level2.evt file, extra rows are filled as -1
| Pixel properties | Quadrant properties | ||||||
|---|---|---|---|---|---|---|---|
| Quadrant | DetID | PixID | Counts | Sigma | Mean | Median | Sigma |
| A | 10 | 83 | 2647567 | 16506.66 | 774 | 760 | 160.3 |
| A | 13 | 248 | 40598 | 248.45 | 774 | 760 | 160.3 |
| A | 0 | 243 | 19247 | 115.29 | 774 | 760 | 160.3 |
| B | 5 | 32 | 77947 | 503.95 | 786 | 764 | 153.2 |
| B | 3 | 112 | 64007 | 412.93 | 786 | 764 | 153.2 |
| B | 0 | 190 | 26706 | 169.38 | 786 | 764 | 153.2 |
| C | 14 | 254 | 1343324 | 7654.49 | 749 | 756 | 175.4 |
| C | 12 | 2 | 192051 | 1090.65 | 749 | 756 | 175.4 |
| C | 12 | 250 | 88529 | 500.43 | 749 | 756 | 175.4 |
| D | 1 | 52 | 1104230 | 5900.43 | 748 | 726 | 187.0 |
| D | 13 | 249 | 330258 | 1762.01 | 748 | 726 | 187.0 |
| D | 11 | 224 | 230435 | 1228.25 | 748 | 726 | 187.0 |
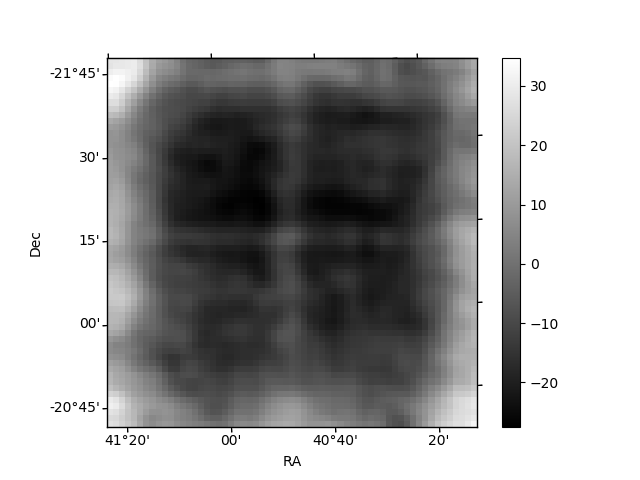
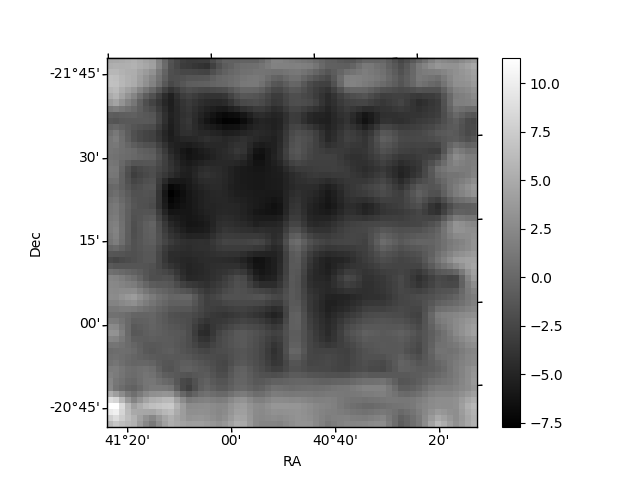
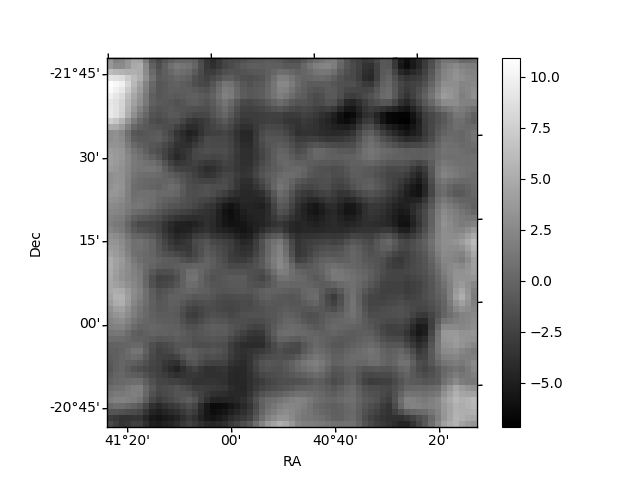
Histogram calculated using DETX and DETY for each event in the final _common_clean file
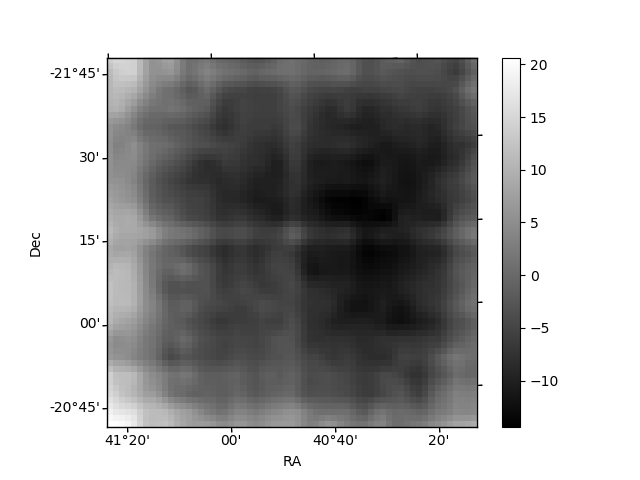
| Quadrant A | 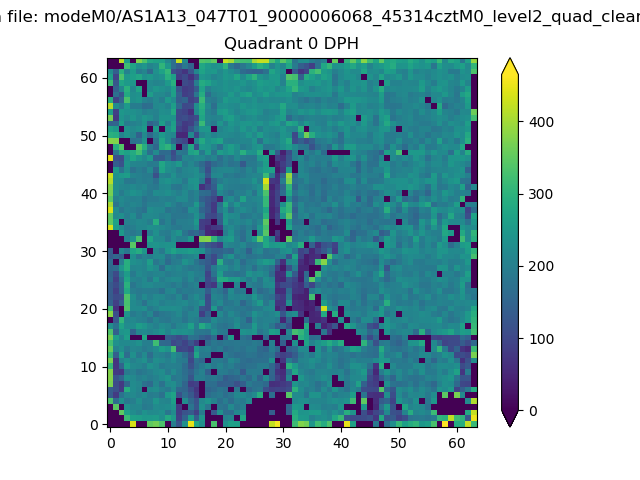 |
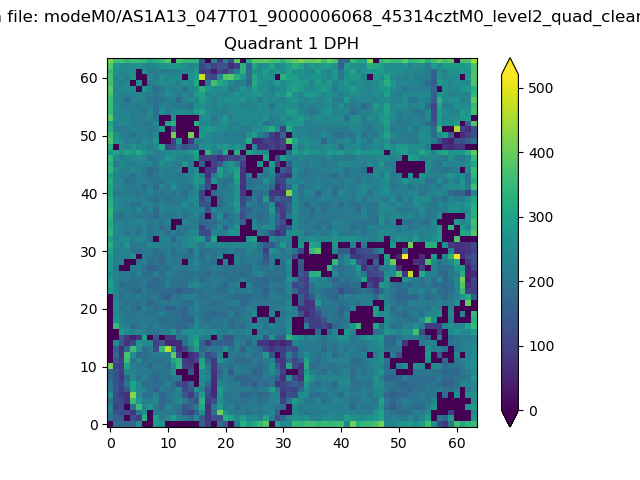 |
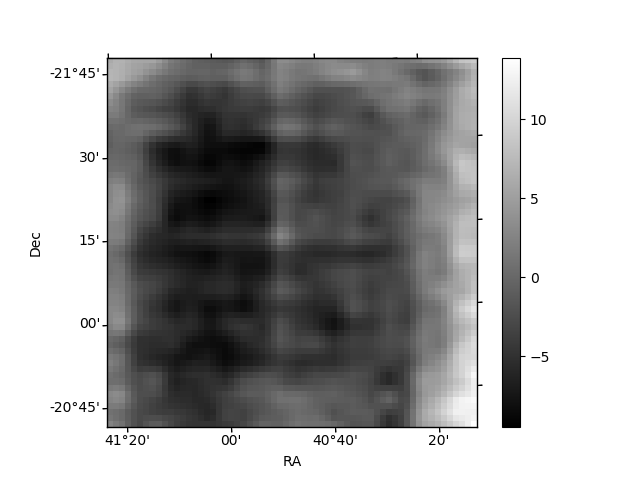
Quadrant B |
|---|---|---|---|
| Quadrant D | 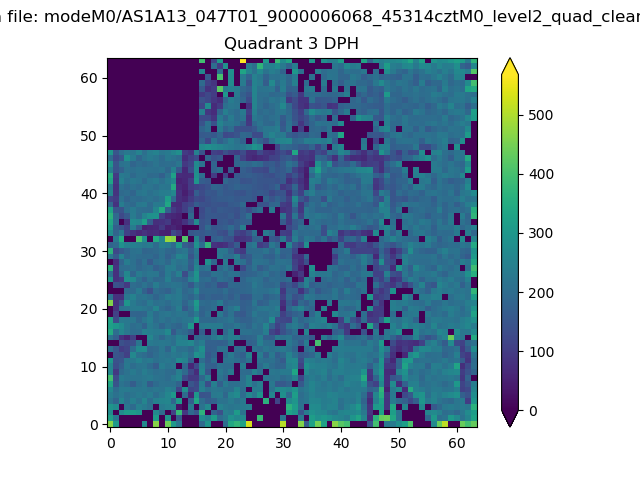 |
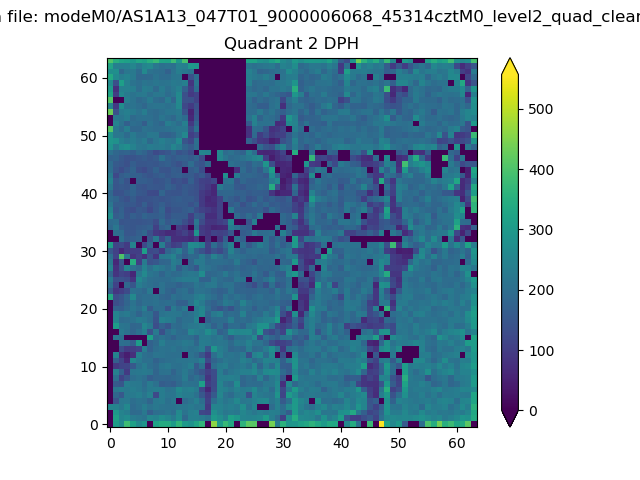 |
Quadrant C |
| Plot type | Count rate plots | Images |
|---|---|---|
| Comparison with Poisson distribution Blue bars denote a histogram of data divided into 1 sec bins. Red curve is a Poisson curve with rate = median count rate of data. |
 |
 |
| Quadrant-wise count rates Data is divided into 100 sec bins |
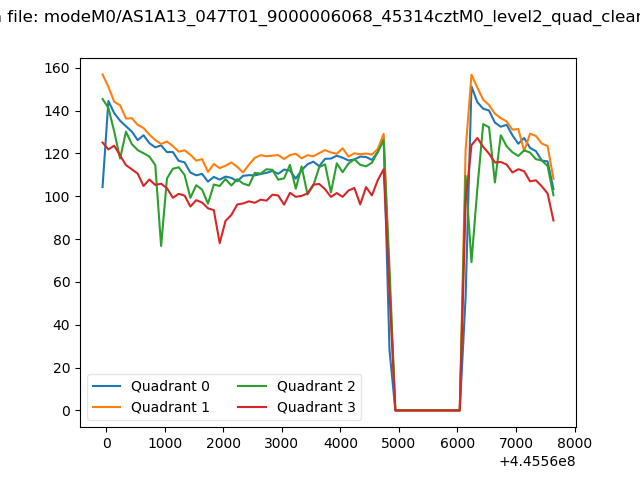 |
|
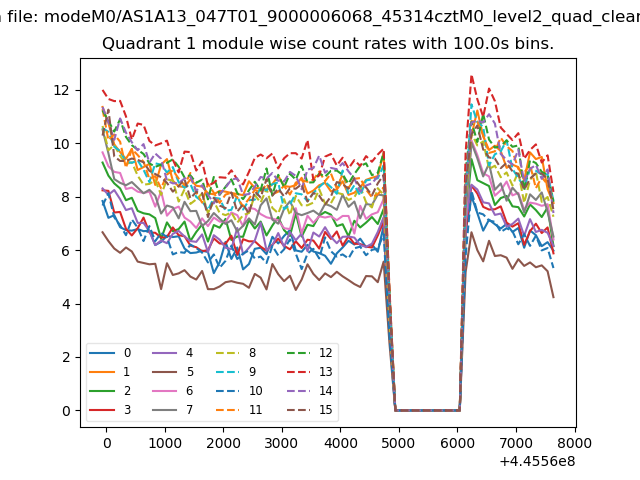
| Module-wise count rates for Quadrant A Data is divided into 100 sec bins |
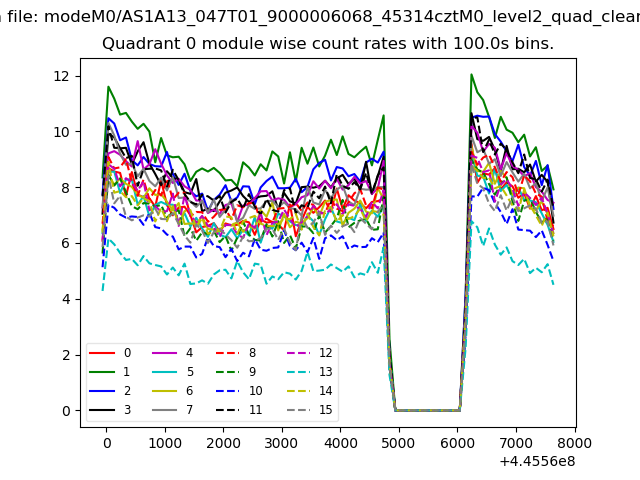 |
 |
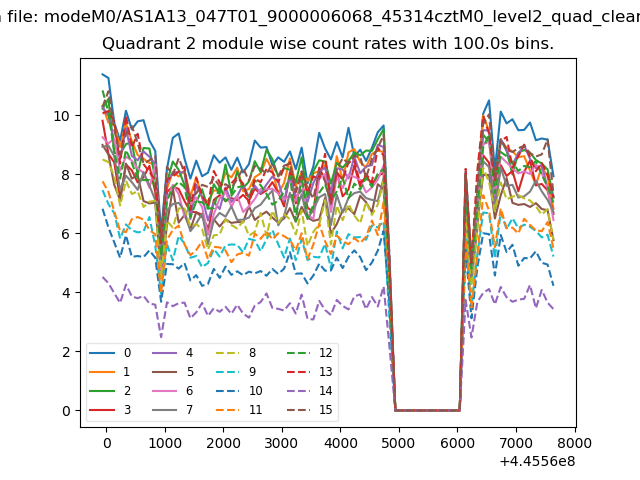
| Module-wise count rates for Quadrant B Data is divided into 100 sec bins |
 |
 |
| Module-wise count rates for Quadrant C Data is divided into 100 sec bins |
 |
 |
| Module-wise count rates for Quadrant D Data is divided into 100 sec bins |
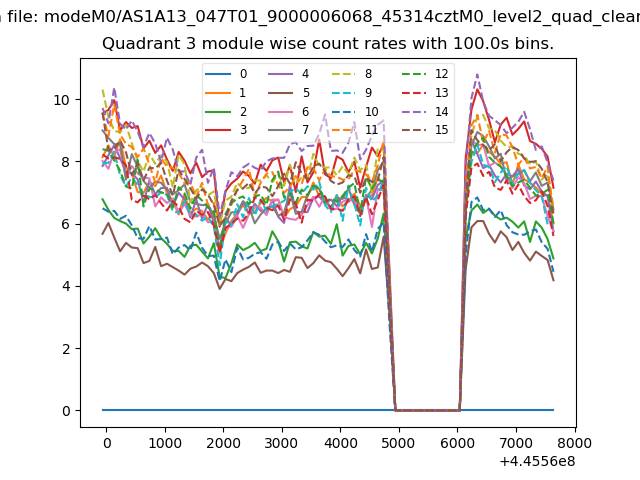 |
 |
| Parameter | Plot |
|---|---|
| CZT HV Monitor | 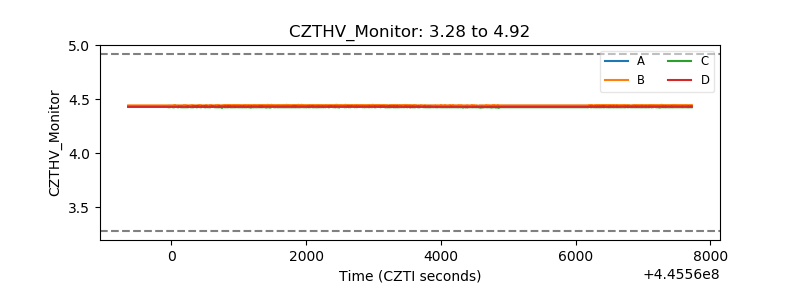 |
| D_VDD |  |
| Temperature 1 | 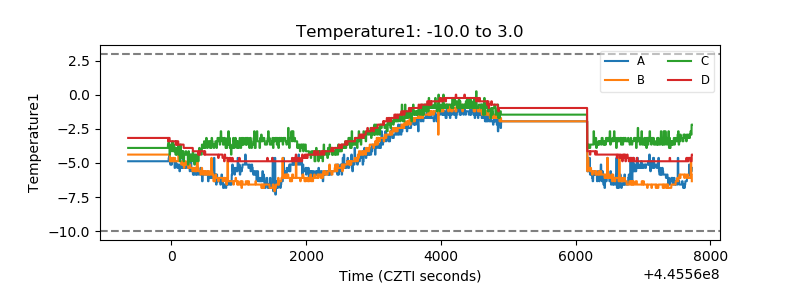 |
| Veto HV Monitor | 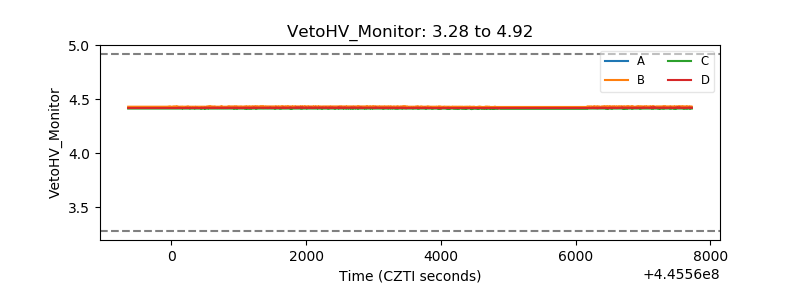 |
| Veto LLD | 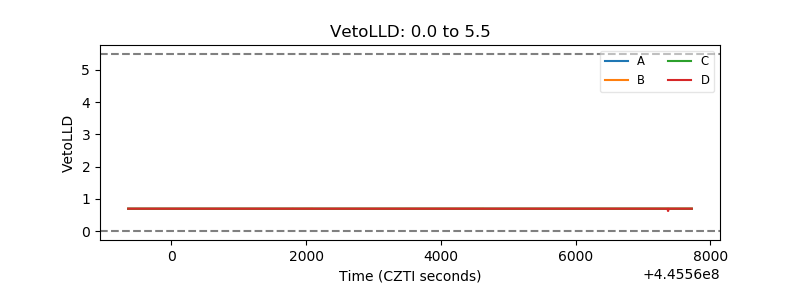 |
| Alpha Counter | 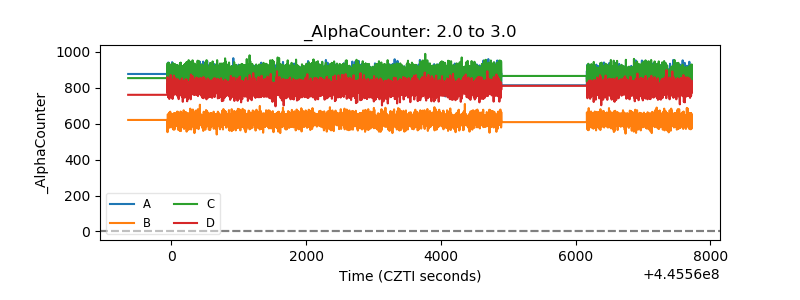 |
| _CPM_Rate | 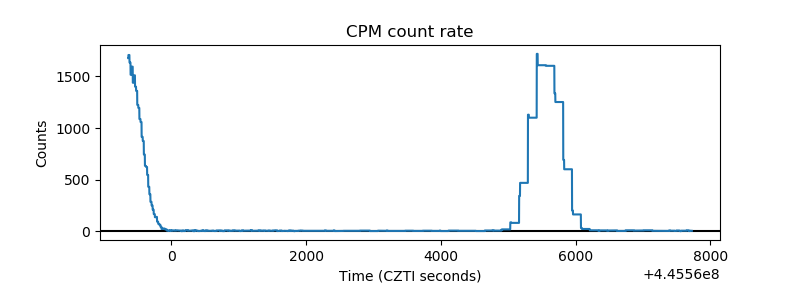 |
| CZT Counter | 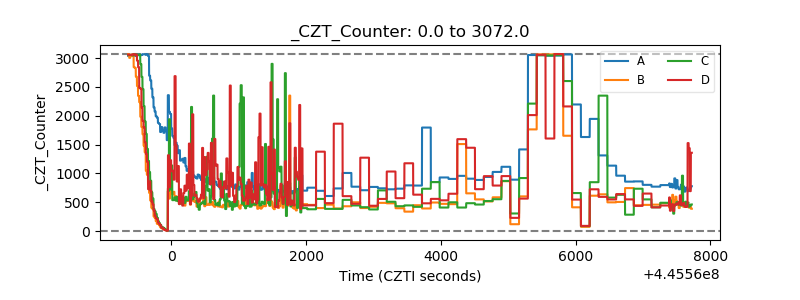 |
| +2.5 Volts monitor | 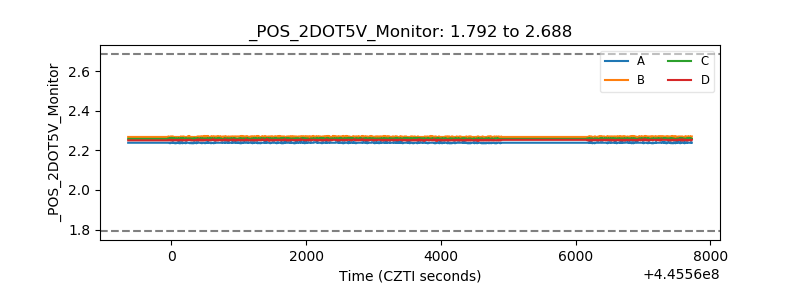 |
| +5 Volts monitor | 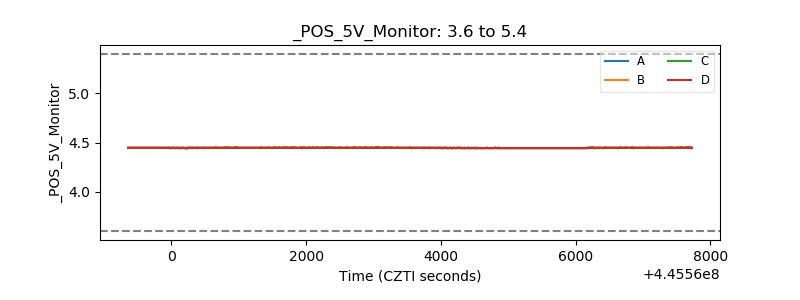 |
| _ROLL_ROT | 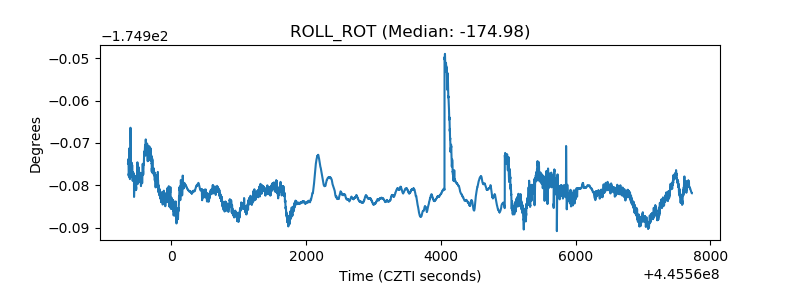 |
| _Roll_DEC | 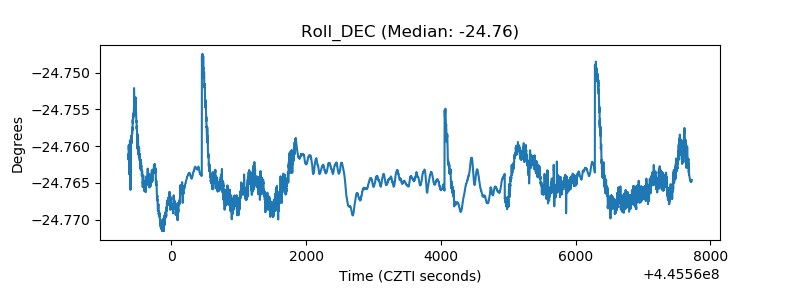 |
| _Roll_RA | 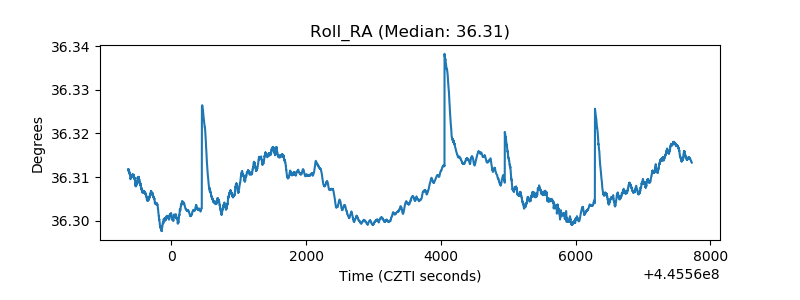 |
| Veto Counter | 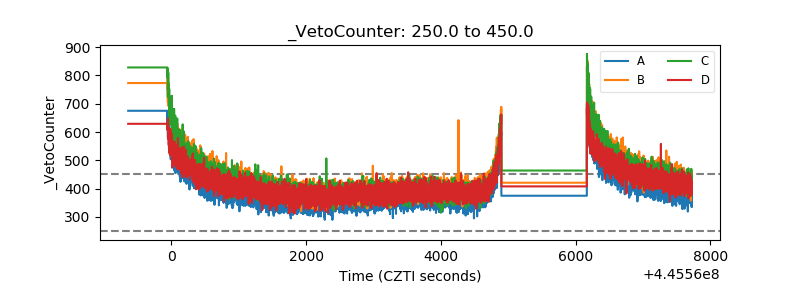 |