| Param | Original file | Final file |
|---|---|---|
| Filename | modeM0/AS1A05_166T01_9000006070_45315cztM0_level2.fits | modeM0/AS1A05_166T01_9000006070_45315cztM0_level2_quad_clean.evt |
| Size (bytes) | 115,614,720 | 26,334,720 |
| Size | 110.3 MB | 25.1 MB |
| Events in quadrant A | 1,409,189 | 171,951 |
| Events in quadrant B | 777,706 | 188,907 |
| Events in quadrant C | 855,933 | 177,617 |
| Events in quadrant D | 1,122,211 | 152,162 |
| Mode SS | |||
|---|---|---|---|
| Quadrant | BADHDUFLAG | Total packets | Discarded packets |
| A | 0 | 30 | 0 |
| B | 0 | 30 | 0 |
| C | 0 | 30 | 0 |
| D | 0 | 30 | 0 |
| Mode M0 | |||
|---|---|---|---|
| Quadrant | BADHDUFLAG | Total packets | Discarded packets |
| A | 0 | 5158 | 1 |
| B | 0 | 3237 | 1 |
| C | 0 | 3482 | 5 |
| D | 0 | 4307 | 3 |
| Mode M9 | |||
|---|---|---|---|
| Quadrant | BADHDUFLAG | Total packets | Discarded packets |
| A | 0 | 13 | 0 |
| B | 0 | 13 | 0 |
| C | 0 | 13 | 0 |
| D | 0 | 13 | 0 |
| Quadrant | Total seconds | Saturated seconds | Saturation percentage |
|---|---|---|---|
| A | 1441 | 120 | 8.327550% |
| B | 1441 | 49 | 3.400416% |
| C | 1439 | 53 | 3.683113% |
| D | 1440 | 132 | 9.166667% |
Noise dominated data is calculated using 1-second bins in cleaned event files. If a bin has >2000 counts, and if more than 50% of those come from <1% of pixels, then it is considered to be noise-dominated and hence unusable.
| Quadrant | # 1 sec bins | Bins with >0 counts | Bins with >2000 counts | High rate bins dominated by noise | Noise dominated (total time) | Noise dominated (detector-on time) | Marked lightcurve |
|---|---|---|---|---|---|---|---|
| A | 2681 | 1441 | 12 | 12 | 0.45% | 0.83% | 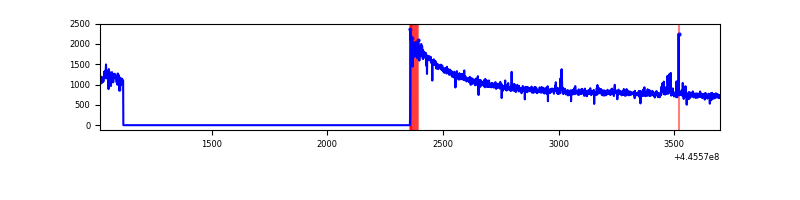 |
| B | 2681 | 1442 | 13 | 13 | 0.48% | 0.90% | 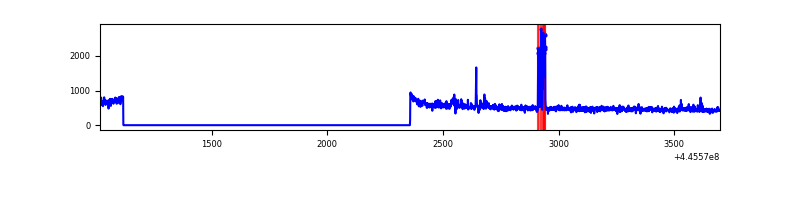 |
| C | 2680 | 1440 | 26 | 26 | 0.97% | 1.81% | 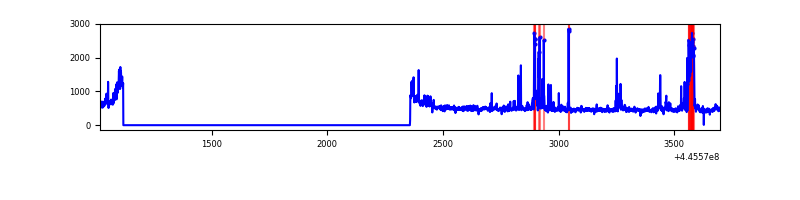 |
| D | 2680 | 1440 | 85 | 85 | 3.17% | 5.90% | 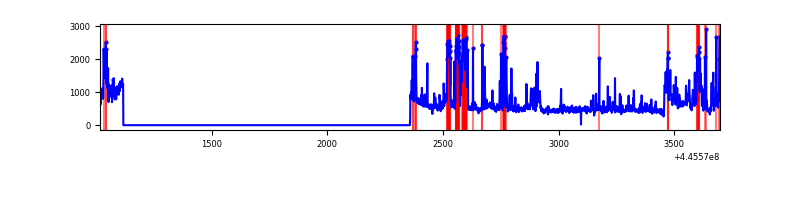 |
Top three noisy pixels from each quadrant. If the there are fewer than three noisy pixels in the level2.evt file, extra rows are filled as -1
| Pixel properties | Quadrant properties | ||||||
|---|---|---|---|---|---|---|---|
| Quadrant | DetID | PixID | Counts | Sigma | Mean | Median | Sigma |
| A | 10 | 83 | 705263 | 18394.62 | 174 | 170 | 38.3 |
| A | 10 | 248 | 17685 | 456.94 | 174 | 170 | 38.3 |
| A | 0 | 243 | 11415 | 293.36 | 174 | 170 | 38.3 |
| B | 5 | 255 | 53556 | 1445.44 | 181 | 175 | 36.9 |
| B | 12 | 111 | 4350 | 113.05 | 181 | 175 | 36.9 |
| B | 11 | 111 | 3922 | 101.46 | 181 | 175 | 36.9 |
| C | 14 | 254 | 151210 | 3512.9 | 178 | 179 | 43.0 |
| C | 12 | 2 | 9619 | 219.57 | 178 | 179 | 43.0 |
| C | 13 | 61 | 1163 | 22.89 | 178 | 179 | 43.0 |
| D | 7 | 96 | 161614 | 3746.26 | 167 | 161 | 43.1 |
| D | 13 | 249 | 145193 | 3365.24 | 167 | 161 | 43.1 |
| D | 13 | 171 | 71033 | 1644.47 | 167 | 161 | 43.1 |
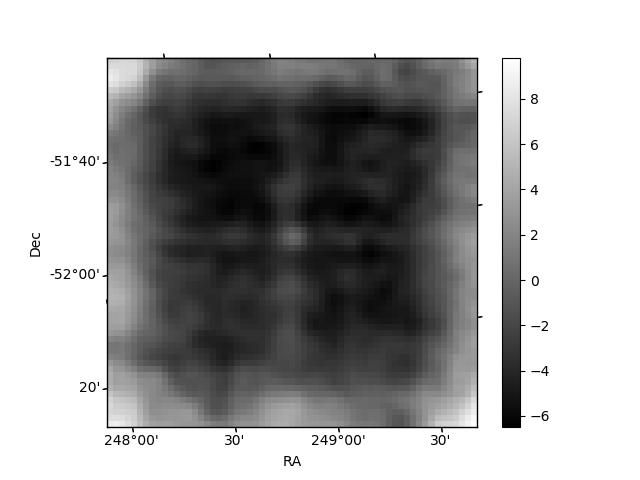
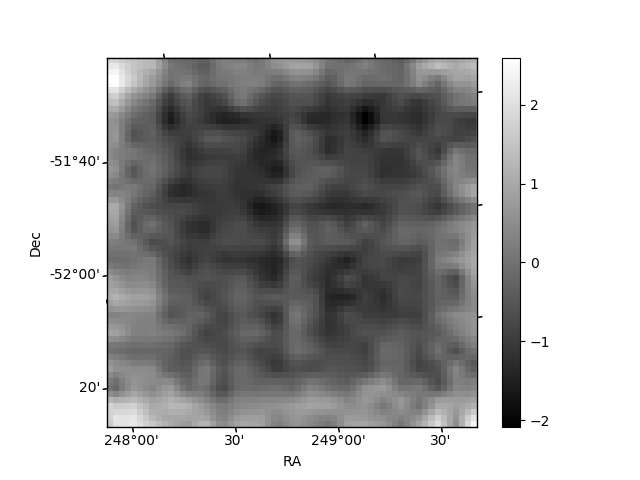
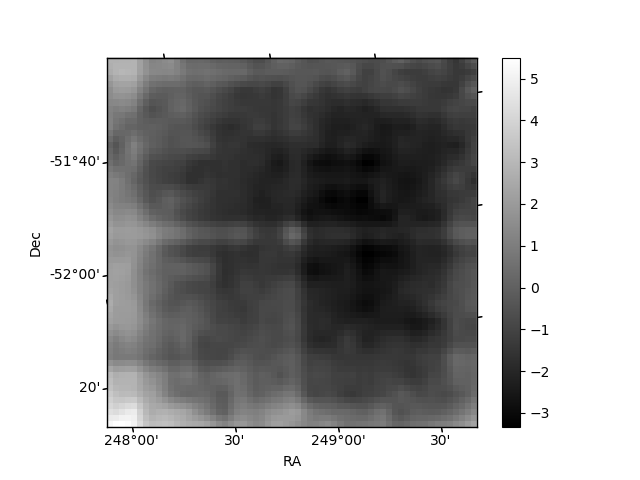
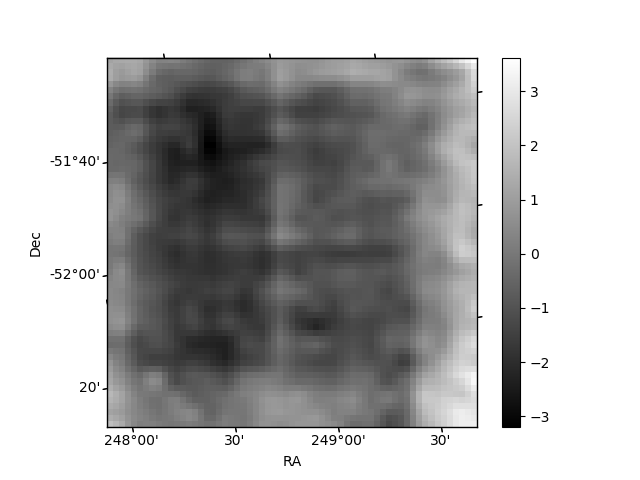
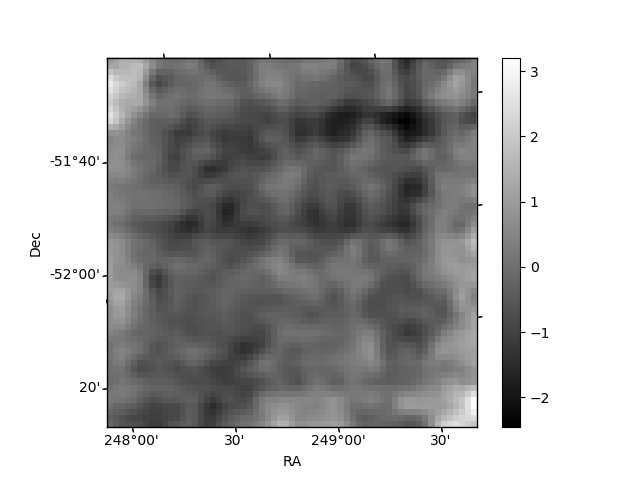
Histogram calculated using DETX and DETY for each event in the final _common_clean file
| Quadrant A | 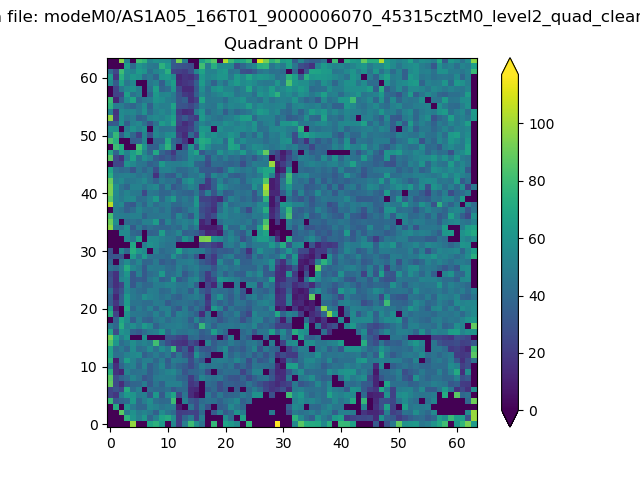 |
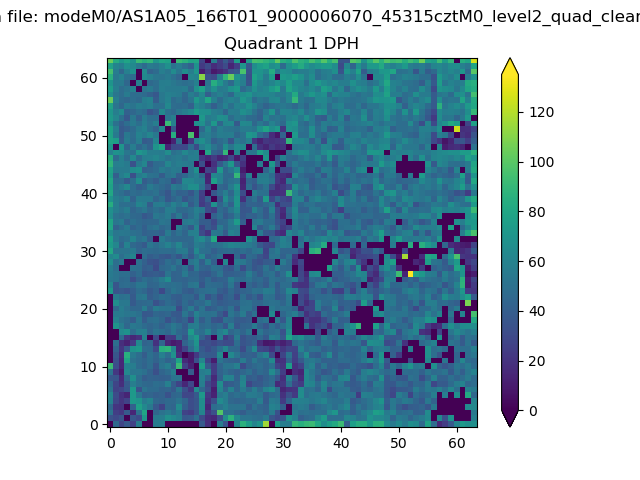 |
Quadrant B |
|---|---|---|---|
| Quadrant D | 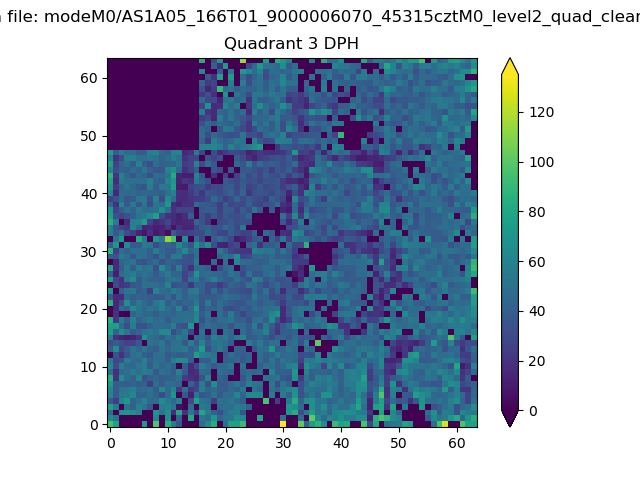 |
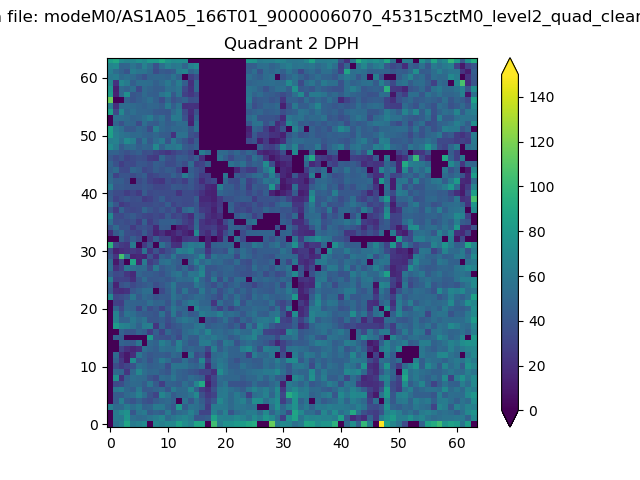 |
Quadrant C |
| Plot type | Count rate plots | Images |
|---|---|---|
| Comparison with Poisson distribution Blue bars denote a histogram of data divided into 1 sec bins. Red curve is a Poisson curve with rate = median count rate of data. |
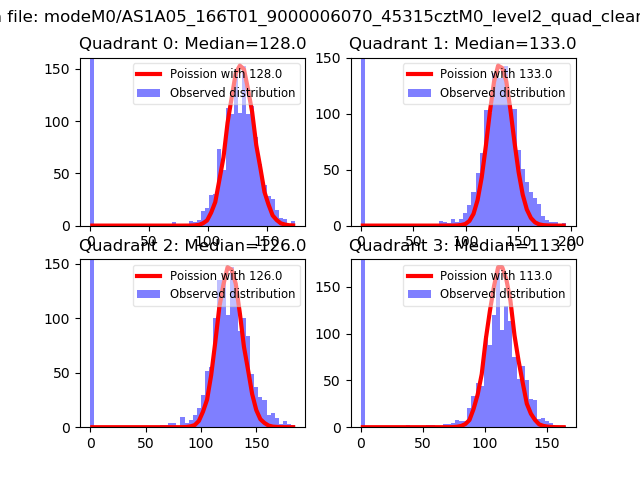 |
 |
| Quadrant-wise count rates Data is divided into 100 sec bins |
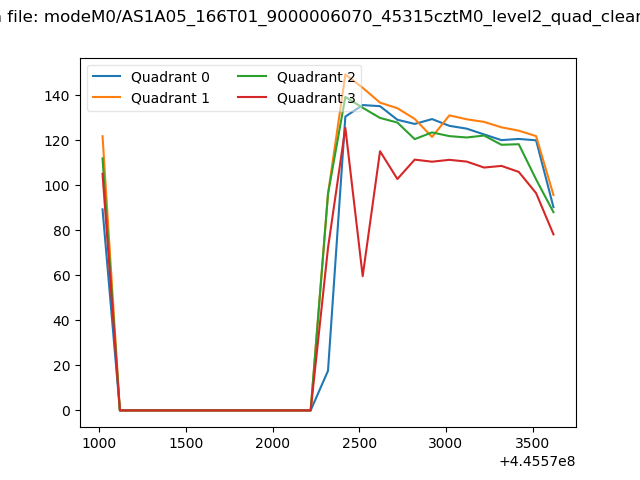 |
|
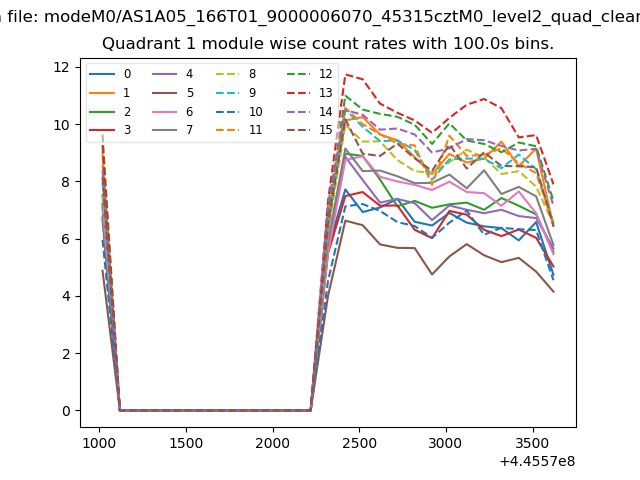
| Module-wise count rates for Quadrant A Data is divided into 100 sec bins |
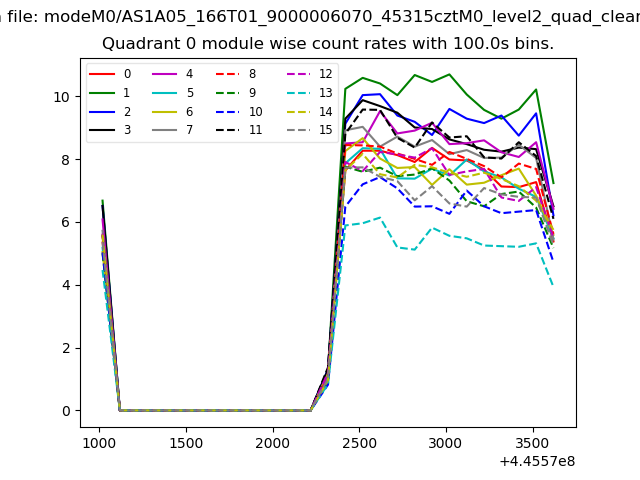 |
 |
| Module-wise count rates for Quadrant B Data is divided into 100 sec bins |
 |
 |
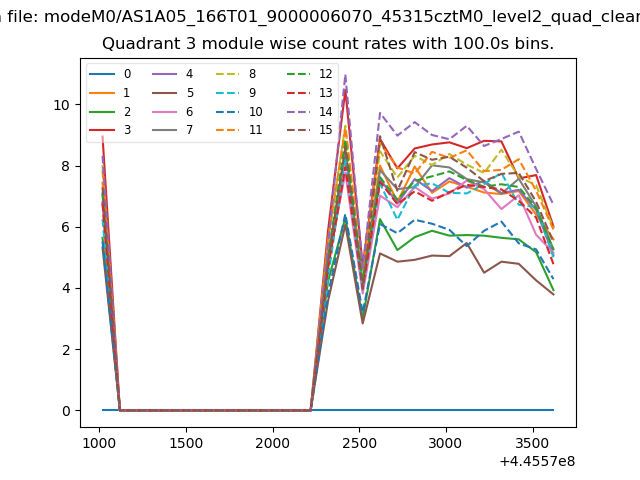
| Module-wise count rates for Quadrant C Data is divided into 100 sec bins |
 |
 |
| Module-wise count rates for Quadrant D Data is divided into 100 sec bins |
 |
 |
| Parameter | Plot |
|---|---|
| CZT HV Monitor |  |
| D_VDD |  |
| Temperature 1 | 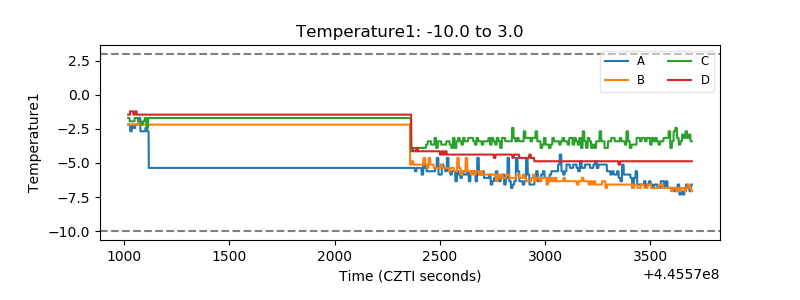 |
| Veto HV Monitor | 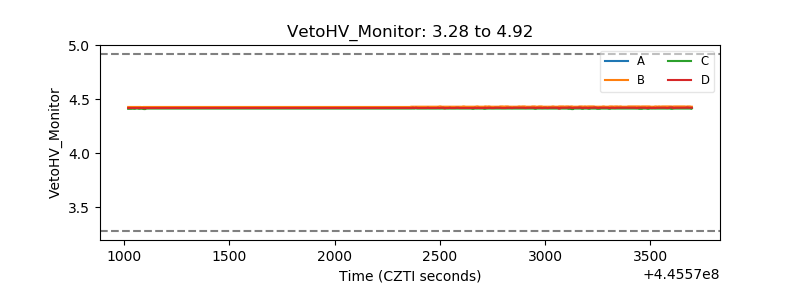 |
| Veto LLD | 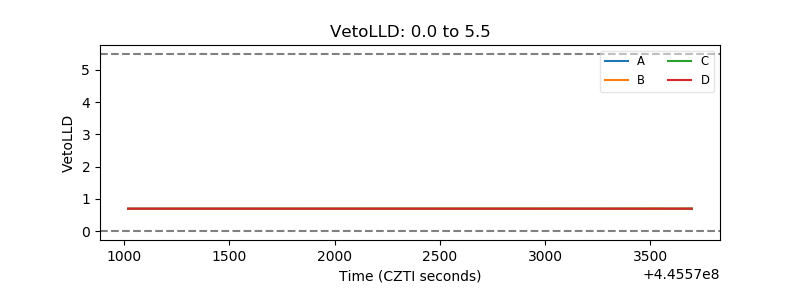 |
| Alpha Counter | 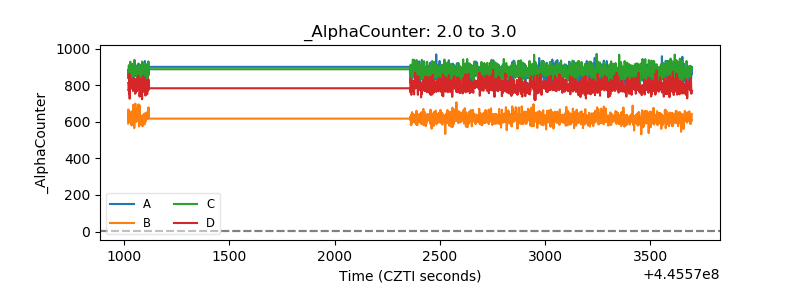 |
| _CPM_Rate | 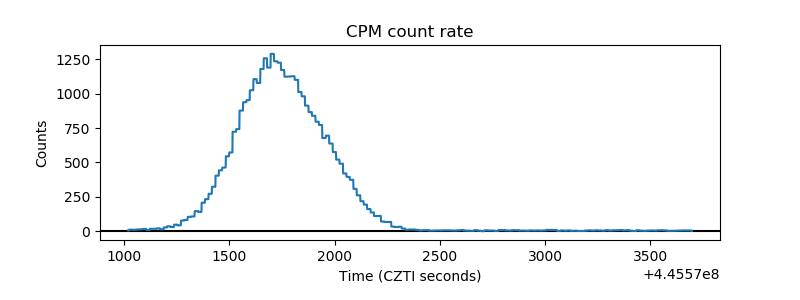 |
| CZT Counter | 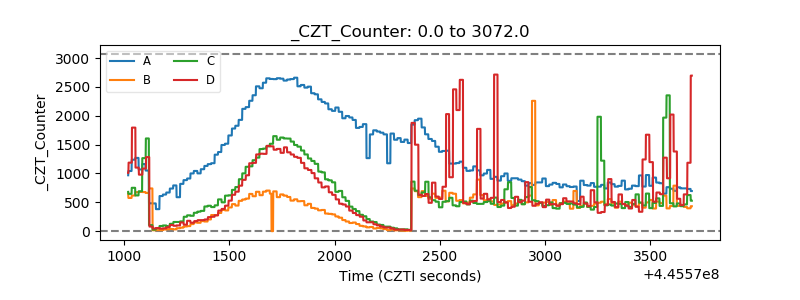 |
| +2.5 Volts monitor | 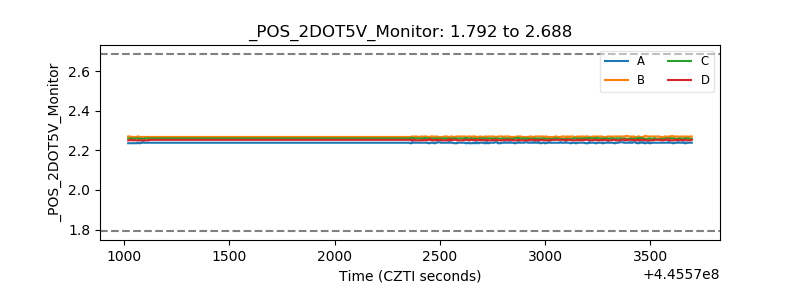 |
| +5 Volts monitor | 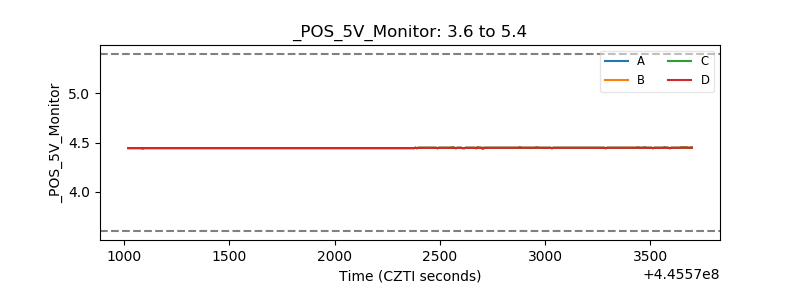 |
| _ROLL_ROT | 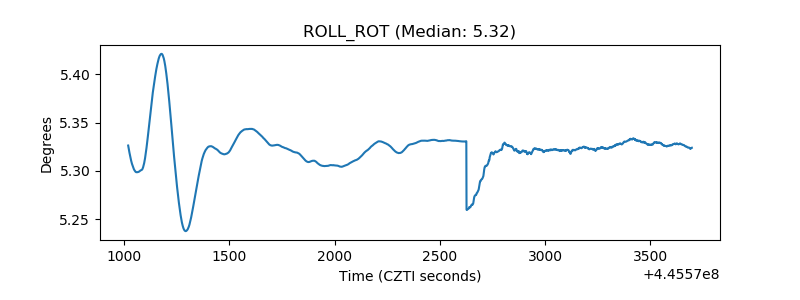 |
| _Roll_DEC | 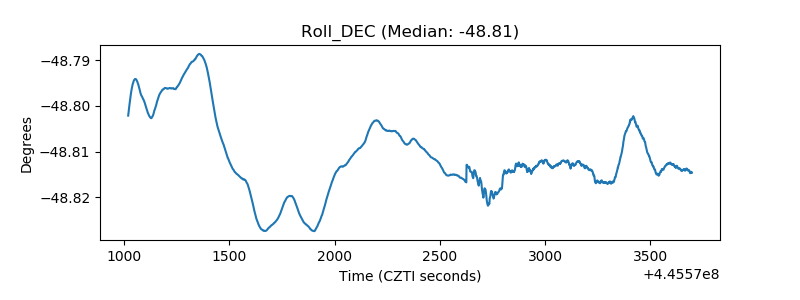 |
| _Roll_RA | 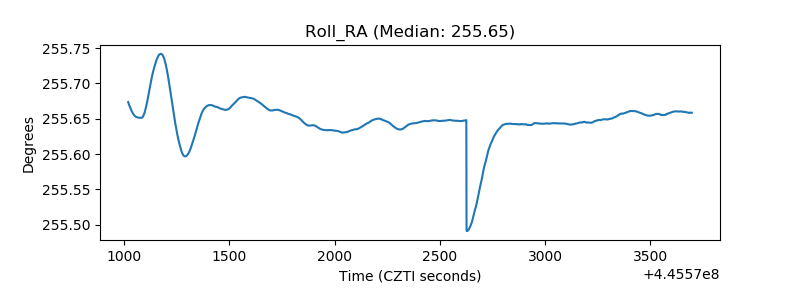 |
| Veto Counter | 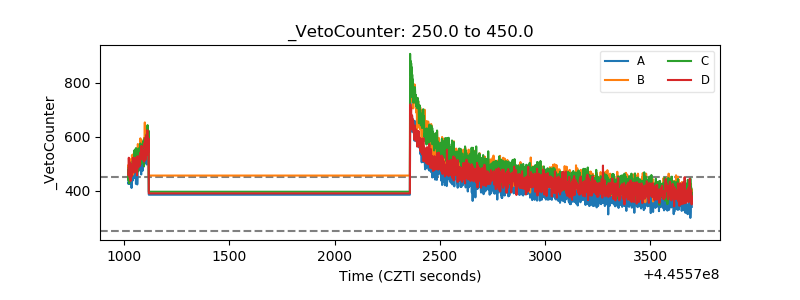 |