| Param | Original file | Final file |
|---|---|---|
| Filename | modeM0/AS1A05_166T01_9000006070_45329cztM0_level2.fits | modeM0/AS1A05_166T01_9000006070_45329cztM0_level2_quad_clean.evt |
| Size (bytes) | 466,205,760 | 113,152,320 |
| Size | 444.6 MB | 107.9 MB |
| Events in quadrant A | 5,742,552 | 753,634 |
| Events in quadrant B | 3,781,457 | 793,451 |
| Events in quadrant C | 3,220,361 | 762,955 |
| Events in quadrant D | 4,021,443 | 674,541 |
| Mode SS | |||
|---|---|---|---|
| Quadrant | BADHDUFLAG | Total packets | Discarded packets |
| A | 0 | 128 | 0 |
| B | 0 | 128 | 0 |
| C | 0 | 128 | 0 |
| D | 0 | 128 | 0 |
| Mode M0 | |||
|---|---|---|---|
| Quadrant | BADHDUFLAG | Total packets | Discarded packets |
| A | 0 | 21623 | 2 |
| B | 0 | 15405 | 2 |
| C | 0 | 13914 | 2 |
| D | 0 | 16241 | 2 |
| Mode M9 | |||
|---|---|---|---|
| Quadrant | BADHDUFLAG | Total packets | Discarded packets |
| A | 0 | 17 | 0 |
| B | 0 | 17 | 0 |
| C | 0 | 18 | 0 |
| D | 0 | 18 | 0 |
| Quadrant | Total seconds | Saturated seconds | Saturation percentage |
|---|---|---|---|
| A | 6334 | 229 | 3.615409% |
| B | 6334 | 168 | 2.652352% |
| C | 6334 | 89 | 1.405115% |
| D | 6334 | 215 | 3.394380% |
Noise dominated data is calculated using 1-second bins in cleaned event files. If a bin has >2000 counts, and if more than 50% of those come from <1% of pixels, then it is considered to be noise-dominated and hence unusable.
| Quadrant | # 1 sec bins | Bins with >0 counts | Bins with >2000 counts | High rate bins dominated by noise | Noise dominated (total time) | Noise dominated (detector-on time) | Marked lightcurve |
|---|---|---|---|---|---|---|---|
| A | 7609 | 6334 | 64 | 64 | 0.84% | 1.01% | 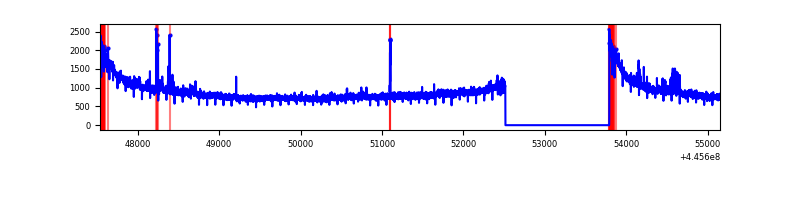 |
| B | 7609 | 6334 | 46 | 46 | 0.60% | 0.73% | 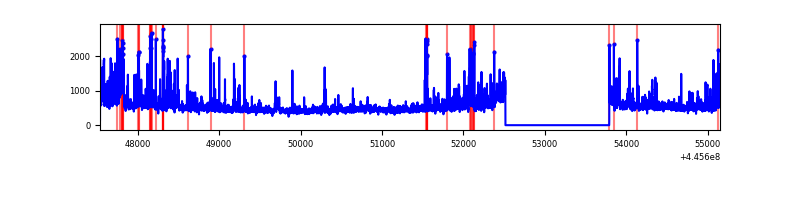 |
| C | 7609 | 6335 | 60 | 60 | 0.79% | 0.95% | 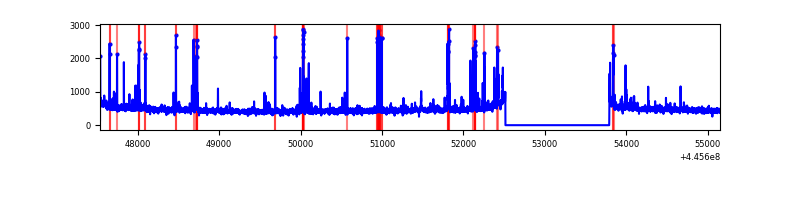 |
| D | 7609 | 6335 | 169 | 169 | 2.22% | 2.67% | 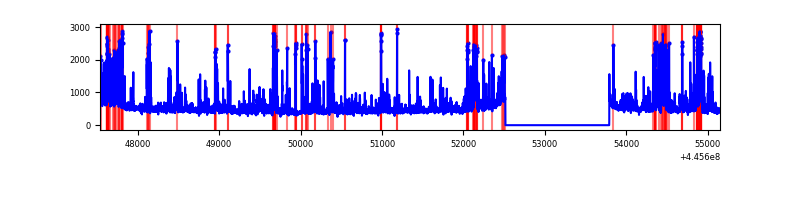 |
Top three noisy pixels from each quadrant. If the there are fewer than three noisy pixels in the level2.evt file, extra rows are filled as -1
| Pixel properties | Quadrant properties | ||||||
|---|---|---|---|---|---|---|---|
| Quadrant | DetID | PixID | Counts | Sigma | Mean | Median | Sigma |
| A | 10 | 83 | 2770629 | 18408.38 | 733 | 720 | 150.5 |
| A | 9 | 191 | 46585 | 304.81 | 733 | 720 | 150.5 |
| A | 0 | 243 | 22190 | 142.68 | 733 | 720 | 150.5 |
| B | 4 | 171 | 192547 | 1350.43 | 743 | 723 | 142.0 |
| B | 3 | 112 | 183240 | 1284.91 | 743 | 723 | 142.0 |
| B | 0 | 186 | 129067 | 903.53 | 743 | 723 | 142.0 |
| C | 14 | 254 | 268445 | 1577.27 | 732 | 738 | 169.7 |
| C | 12 | 2 | 68425 | 398.8 | 732 | 738 | 169.7 |
| C | 3 | 233 | 18227 | 103.04 | 732 | 738 | 169.7 |
| D | 13 | 29 | 286787 | 1597.06 | 717 | 695 | 179.1 |
| D | 1 | 52 | 216745 | 1206.06 | 717 | 695 | 179.1 |
| D | 13 | 249 | 167351 | 930.33 | 717 | 695 | 179.1 |
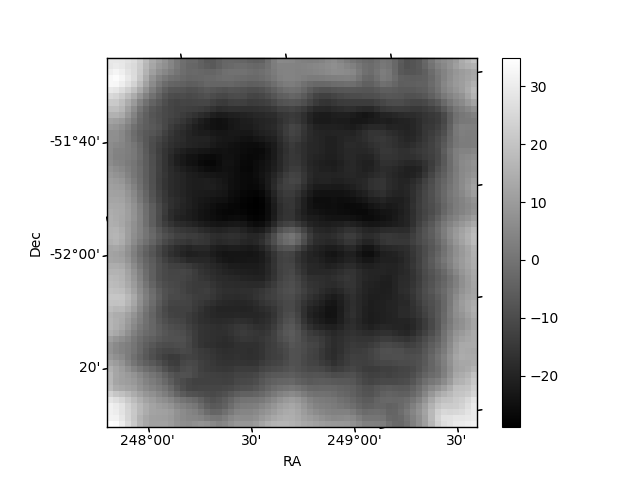
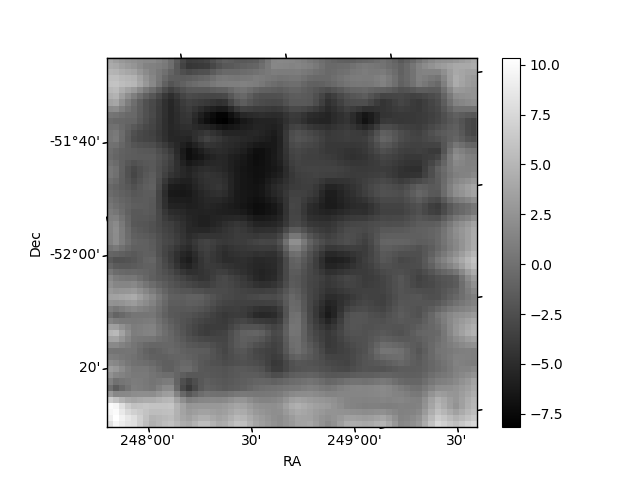
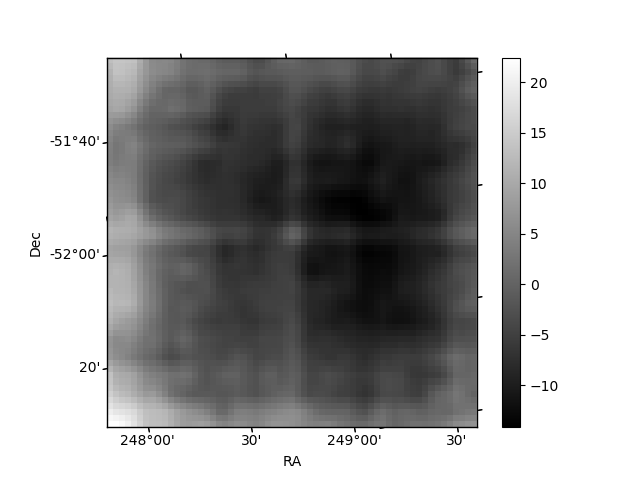
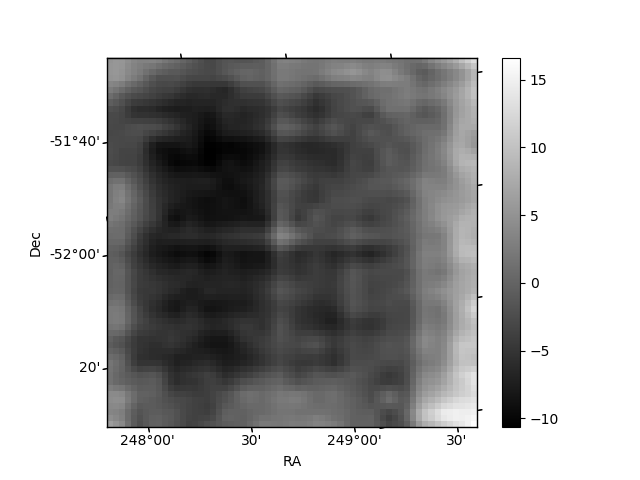
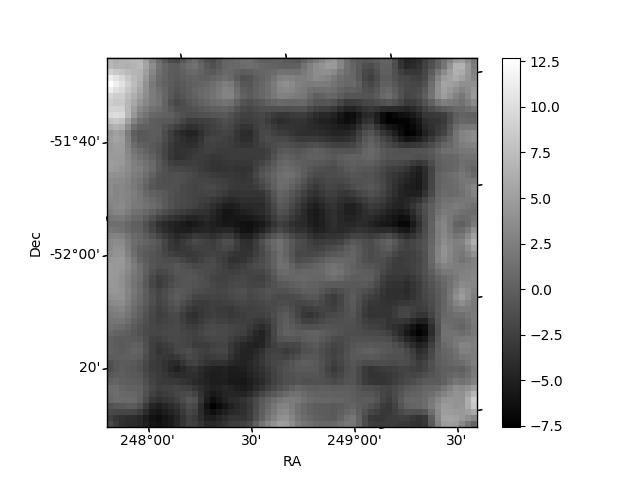
Histogram calculated using DETX and DETY for each event in the final _common_clean file
| Quadrant A | 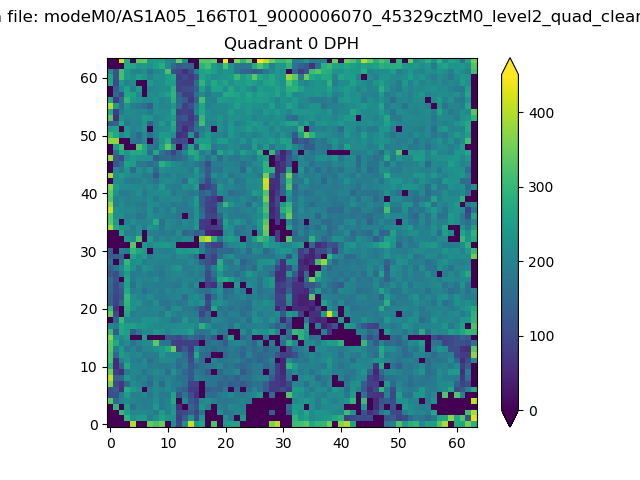 |
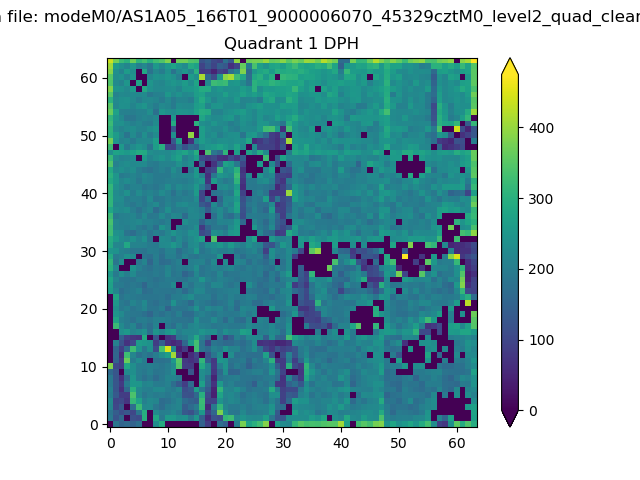 |
Quadrant B |
|---|---|---|---|
| Quadrant D | 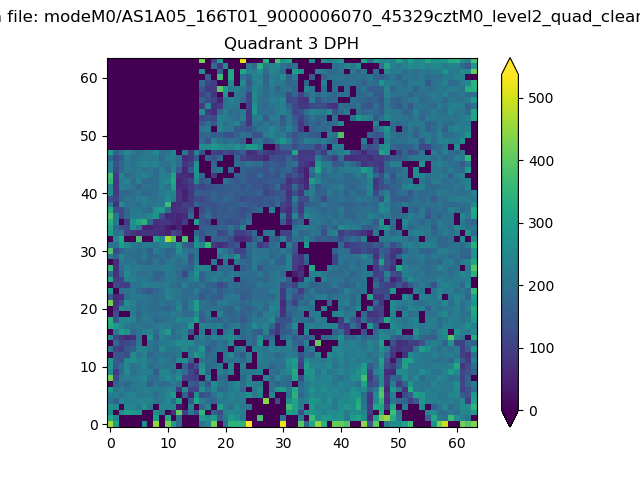 |
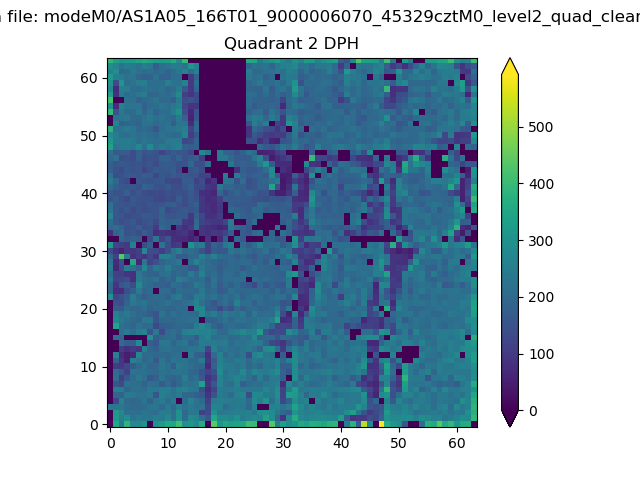 |
Quadrant C |
| Plot type | Count rate plots | Images |
|---|---|---|
| Comparison with Poisson distribution Blue bars denote a histogram of data divided into 1 sec bins. Red curve is a Poisson curve with rate = median count rate of data. |
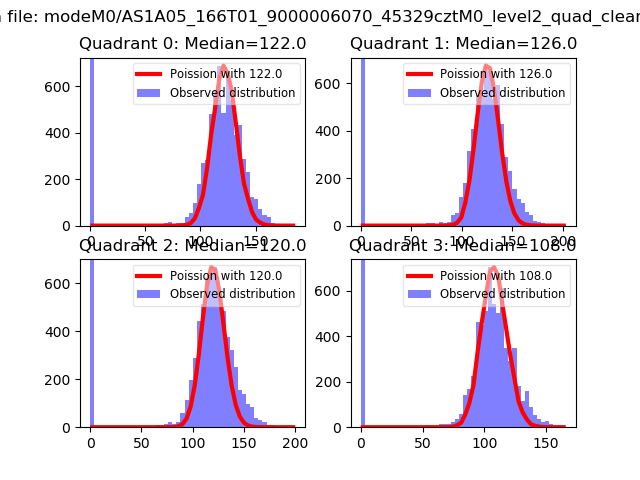 |
 |
| Quadrant-wise count rates Data is divided into 100 sec bins |
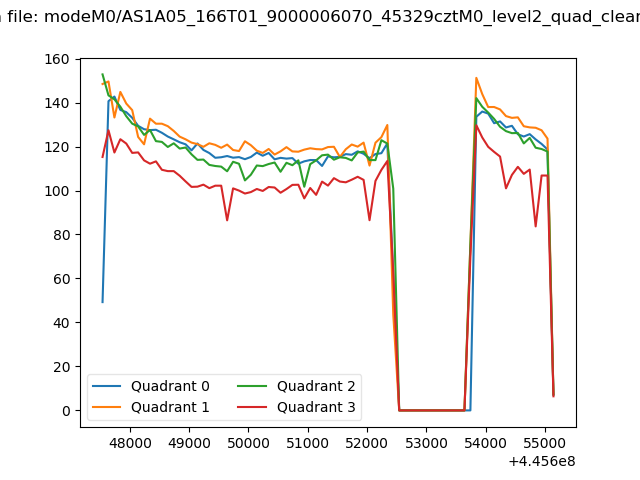 |
|
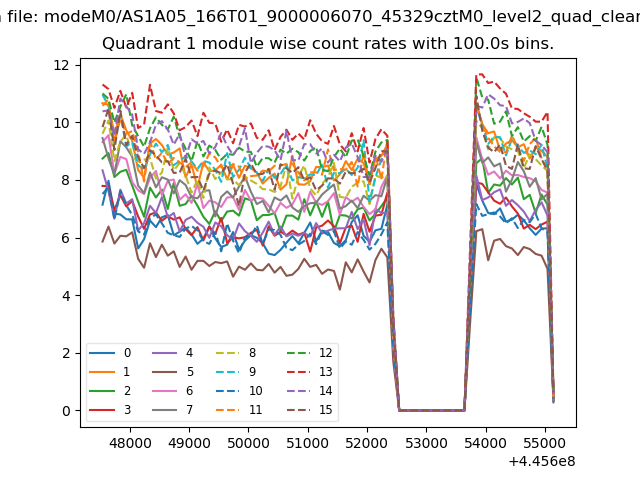
| Module-wise count rates for Quadrant A Data is divided into 100 sec bins |
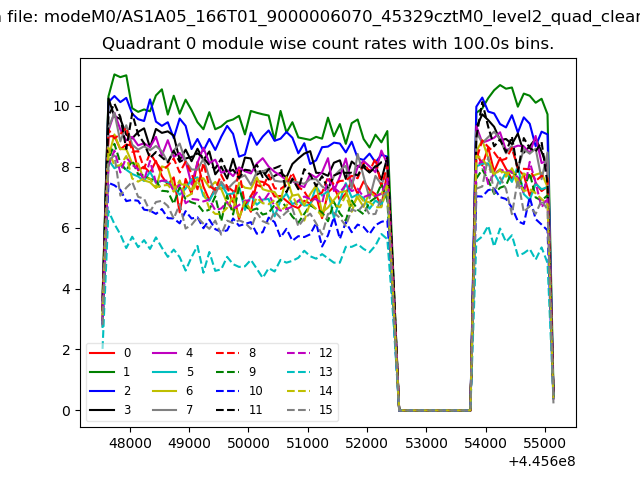 |
 |
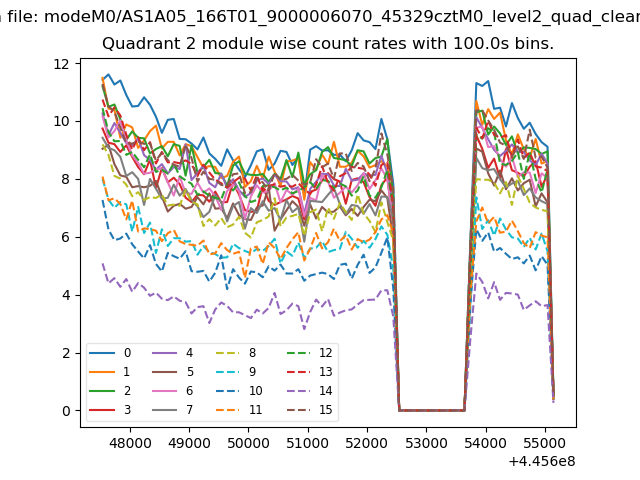
| Module-wise count rates for Quadrant B Data is divided into 100 sec bins |
 |
 |
| Module-wise count rates for Quadrant C Data is divided into 100 sec bins |
 |
 |
| Module-wise count rates for Quadrant D Data is divided into 100 sec bins |
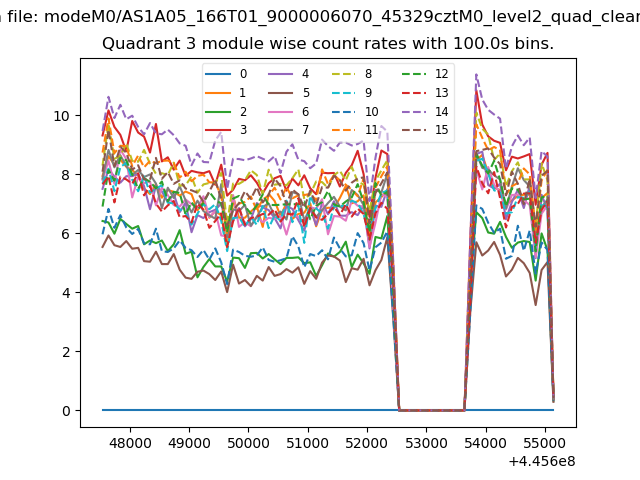 |
 |
| Parameter | Plot |
|---|---|
| CZT HV Monitor | 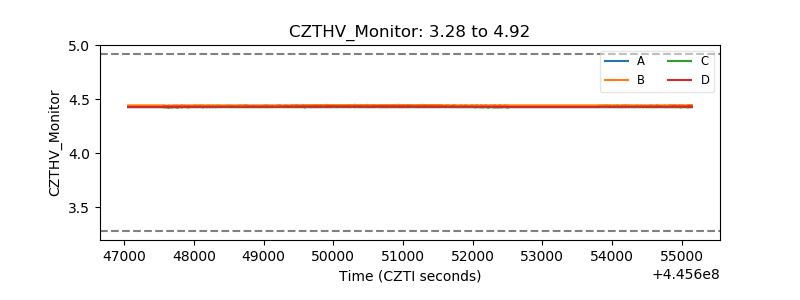 |
| D_VDD | 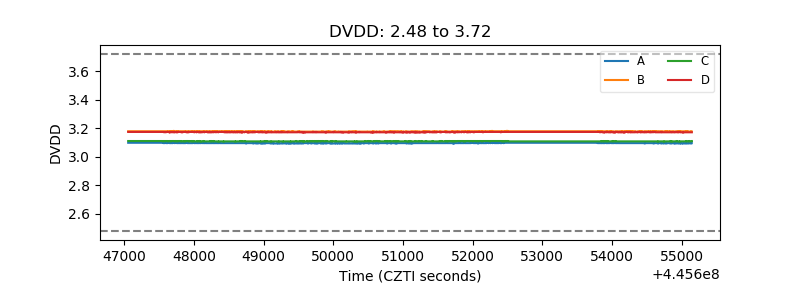 |
| Temperature 1 | 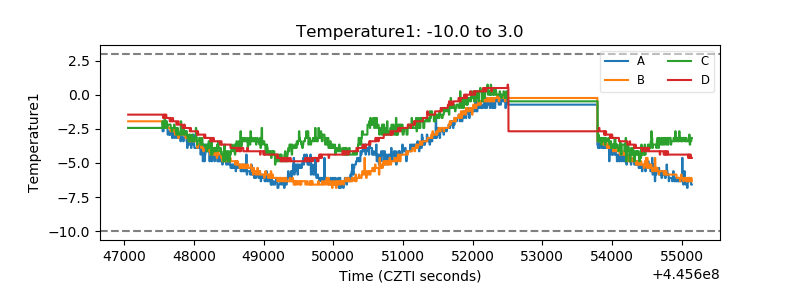 |
| Veto HV Monitor | 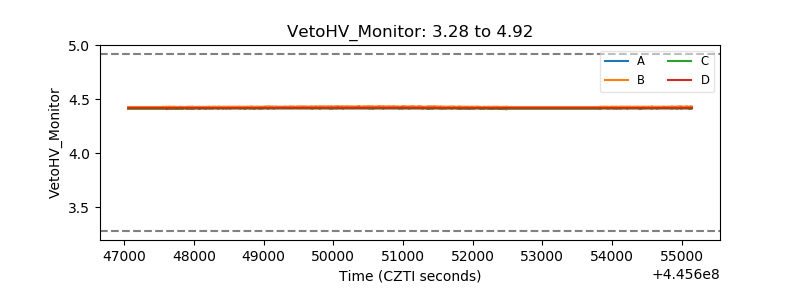 |
| Veto LLD | 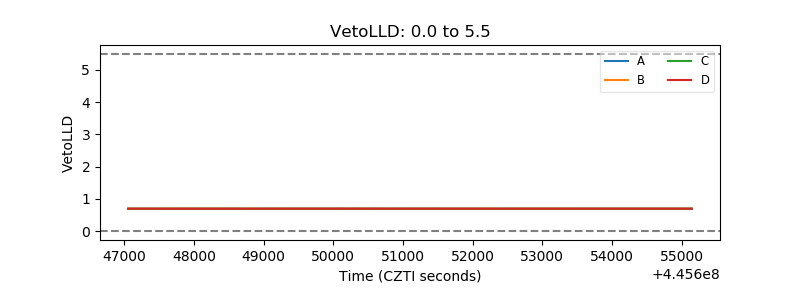 |
| Alpha Counter | 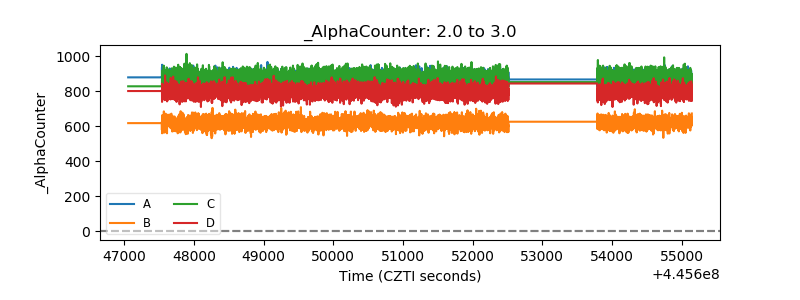 |
| _CPM_Rate | 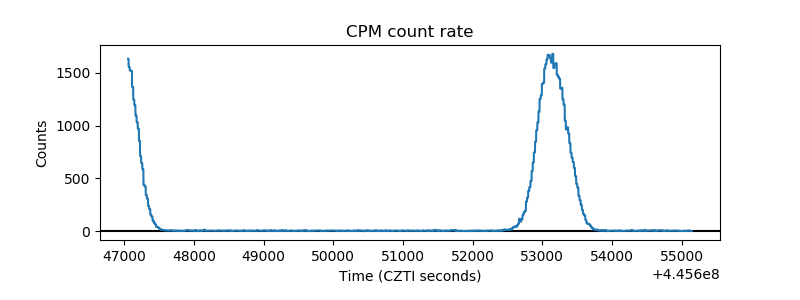 |
| CZT Counter | 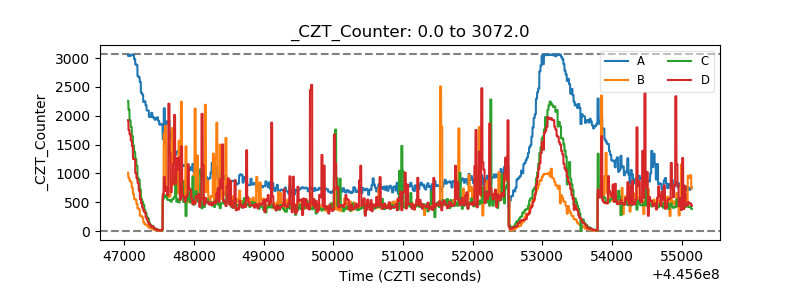 |
| +2.5 Volts monitor | 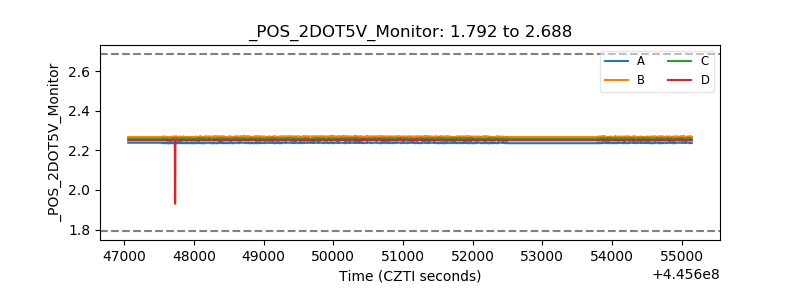 |
| +5 Volts monitor | 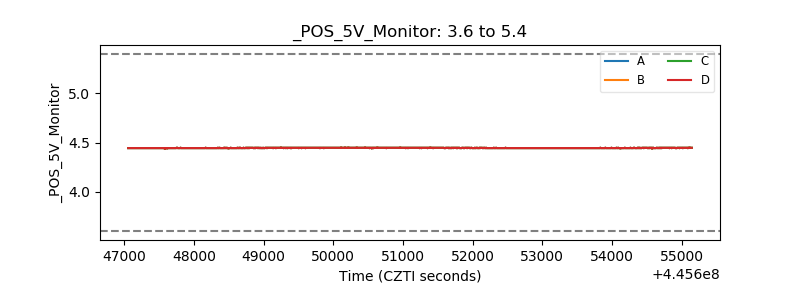 |
| _ROLL_ROT | 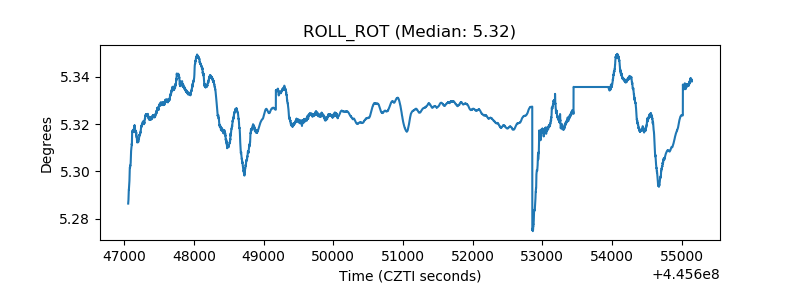 |
| _Roll_DEC | 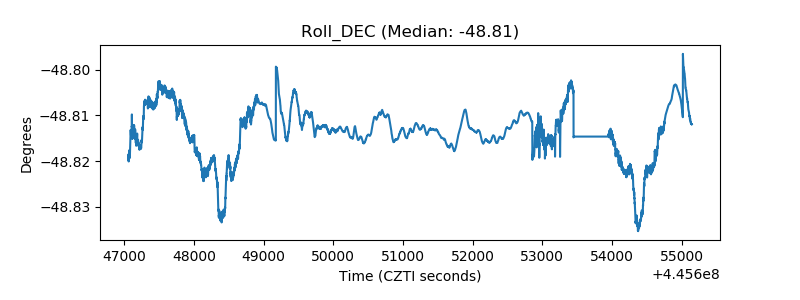 |
| _Roll_RA | 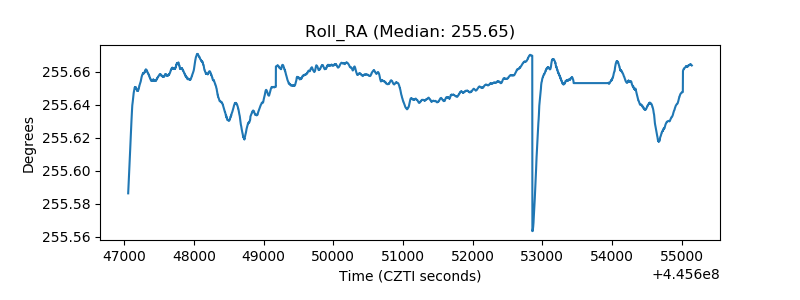 |
| Veto Counter | 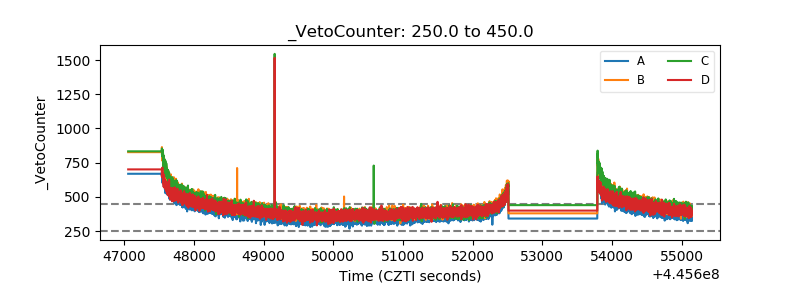 |