| Param | Original file | Final file |
|---|---|---|
| Filename | modeM0/AS1A05_166T01_9000006070_45330cztM0_level2.fits | modeM0/AS1A05_166T01_9000006070_45330cztM0_level2_quad_clean.evt |
| Size (bytes) | 437,777,280 | 108,840,960 |
| Size | 417.5 MB | 103.8 MB |
| Events in quadrant A | 5,258,561 | 728,738 |
| Events in quadrant B | 3,605,960 | 755,477 |
| Events in quadrant C | 2,986,440 | 731,556 |
| Events in quadrant D | 3,871,774 | 646,004 |
| Mode SS | |||
|---|---|---|---|
| Quadrant | BADHDUFLAG | Total packets | Discarded packets |
| A | 0 | 128 | 0 |
| B | 0 | 128 | 0 |
| C | 0 | 128 | 0 |
| D | 0 | 128 | 0 |
| Mode M0 | |||
|---|---|---|---|
| Quadrant | BADHDUFLAG | Total packets | Discarded packets |
| A | 0 | 20301 | 1 |
| B | 0 | 14770 | 1 |
| C | 0 | 13197 | 1 |
| D | 0 | 15783 | 1 |
| Mode M9 | |||
|---|---|---|---|
| Quadrant | BADHDUFLAG | Total packets | Discarded packets |
| A | 0 | 12 | 0 |
| B | 0 | 12 | 0 |
| C | 0 | 12 | 0 |
| D | 0 | 12 | 0 |
| Quadrant | Total seconds | Saturated seconds | Saturation percentage |
|---|---|---|---|
| A | 6211 | 148 | 2.382869% |
| B | 6211 | 167 | 2.688778% |
| C | 6212 | 50 | 0.804894% |
| D | 6212 | 192 | 3.090792% |
Noise dominated data is calculated using 1-second bins in cleaned event files. If a bin has >2000 counts, and if more than 50% of those come from <1% of pixels, then it is considered to be noise-dominated and hence unusable.
| Quadrant | # 1 sec bins | Bins with >0 counts | Bins with >2000 counts | High rate bins dominated by noise | Noise dominated (total time) | Noise dominated (detector-on time) | Marked lightcurve |
|---|---|---|---|---|---|---|---|
| A | 7421 | 6211 | 17 | 17 | 0.23% | 0.27% | 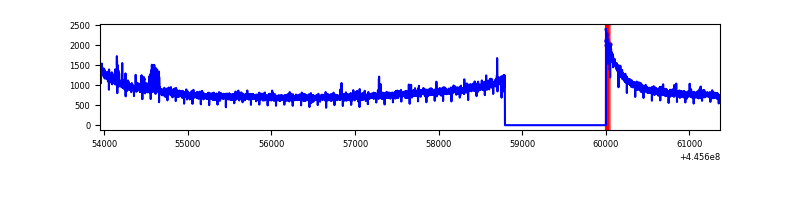 |
| B | 7421 | 6211 | 68 | 68 | 0.92% | 1.09% | 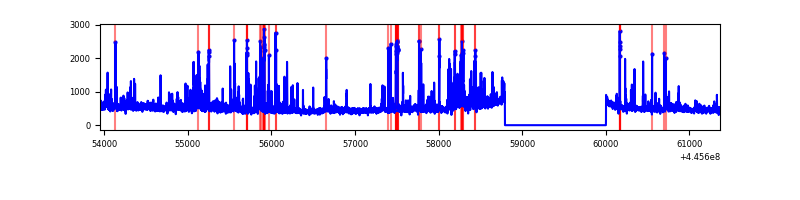 |
| C | 7422 | 6212 | 21 | 21 | 0.28% | 0.34% | 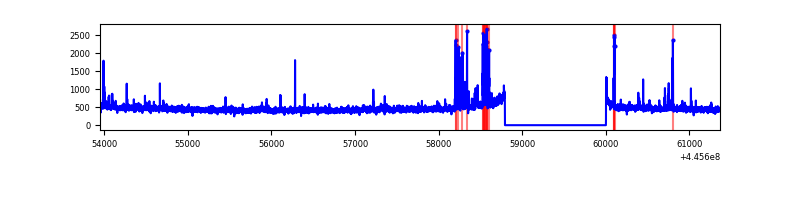 |
| D | 7422 | 6213 | 141 | 141 | 1.90% | 2.27% | 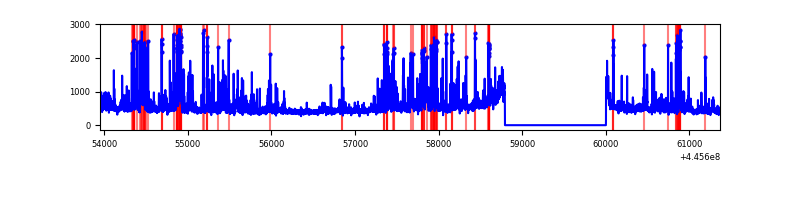 |
Top three noisy pixels from each quadrant. If the there are fewer than three noisy pixels in the level2.evt file, extra rows are filled as -1
| Pixel properties | Quadrant properties | ||||||
|---|---|---|---|---|---|---|---|
| Quadrant | DetID | PixID | Counts | Sigma | Mean | Median | Sigma |
| A | 10 | 83 | 2451915 | 16809.82 | 706 | 689 | 145.8 |
| A | 9 | 191 | 32200 | 216.09 | 706 | 689 | 145.8 |
| A | 0 | 243 | 22590 | 150.19 | 706 | 689 | 145.8 |
| B | 15 | 201 | 207406 | 1501.11 | 714 | 695 | 137.7 |
| B | 3 | 112 | 162270 | 1173.34 | 714 | 695 | 137.7 |
| B | 5 | 255 | 143853 | 1039.59 | 714 | 695 | 137.7 |
| C | 14 | 254 | 133490 | 799.04 | 710 | 715 | 166.2 |
| C | 12 | 2 | 36151 | 213.25 | 710 | 715 | 166.2 |
| C | 3 | 233 | 25081 | 146.63 | 710 | 715 | 166.2 |
| D | 2 | 249 | 260569 | 1486.96 | 695 | 672 | 174.8 |
| D | 13 | 171 | 195969 | 1117.36 | 695 | 672 | 174.8 |
| D | 1 | 52 | 177606 | 1012.3 | 695 | 672 | 174.8 |
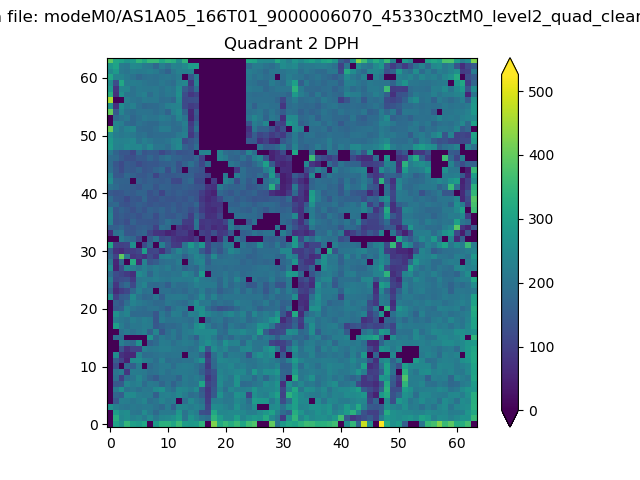
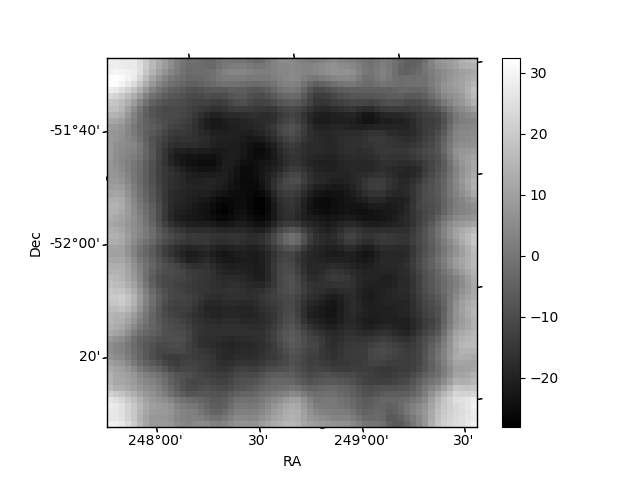
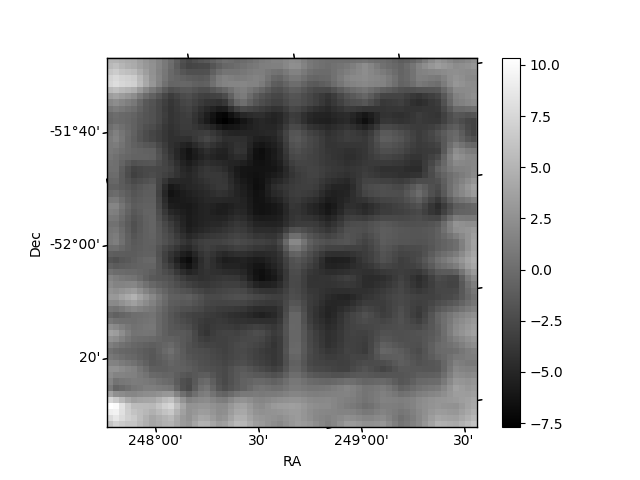
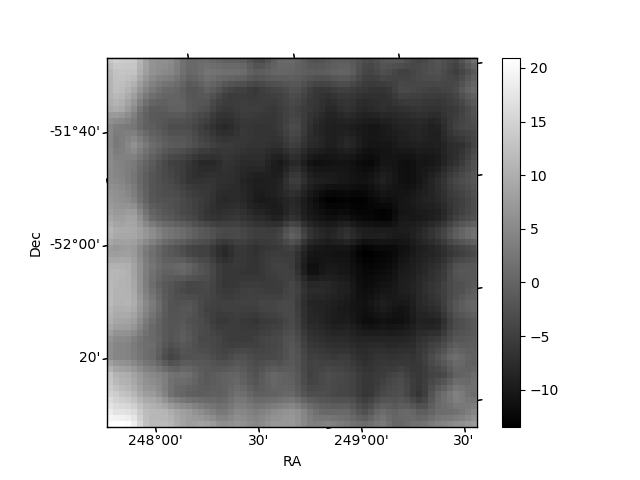
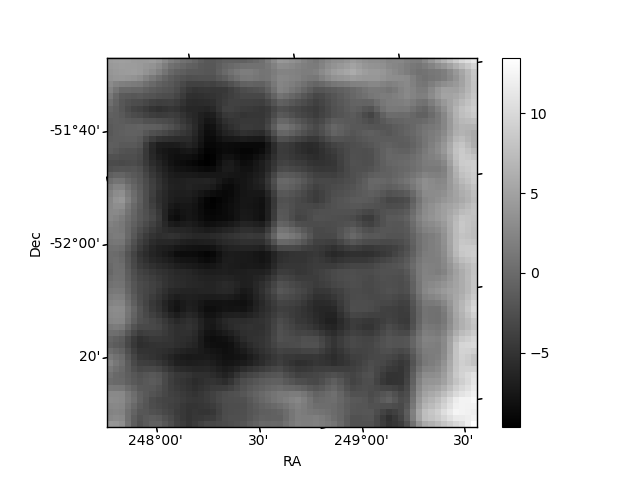
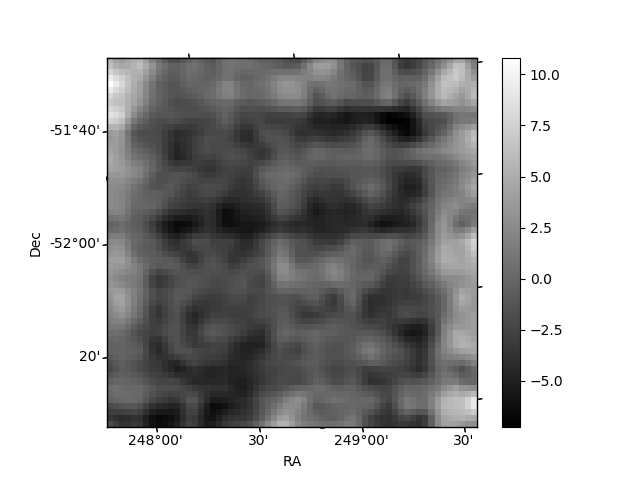
Histogram calculated using DETX and DETY for each event in the final _common_clean file
| Quadrant A | 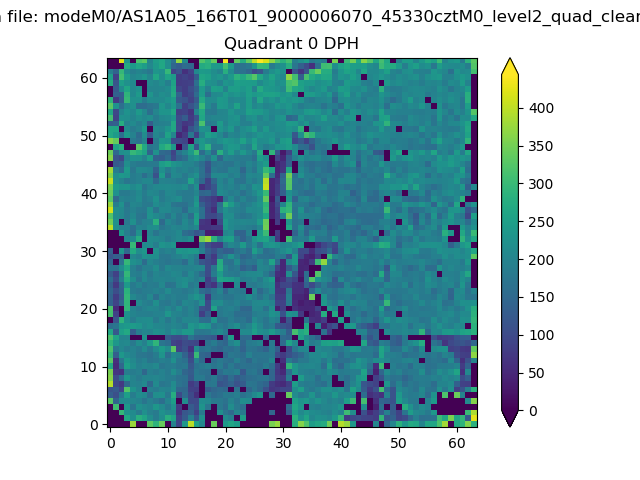 |
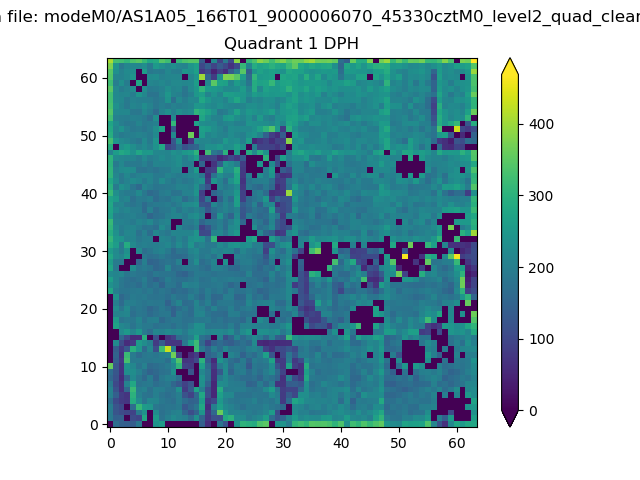 |
Quadrant B |
|---|---|---|---|
| Quadrant D | 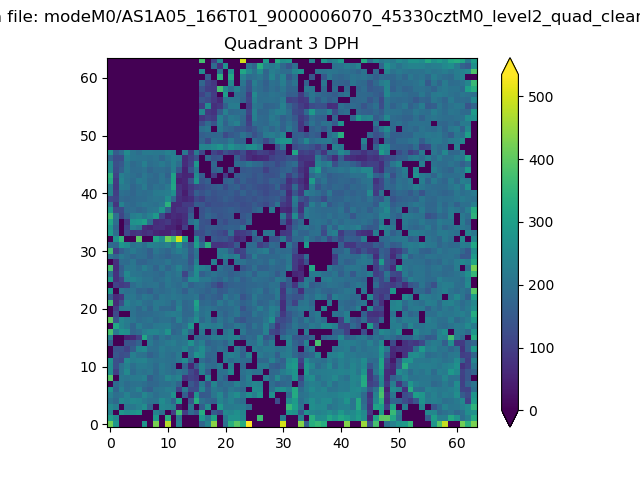 |
 |
Quadrant C |
| Plot type | Count rate plots | Images |
|---|---|---|
| Comparison with Poisson distribution Blue bars denote a histogram of data divided into 1 sec bins. Red curve is a Poisson curve with rate = median count rate of data. |
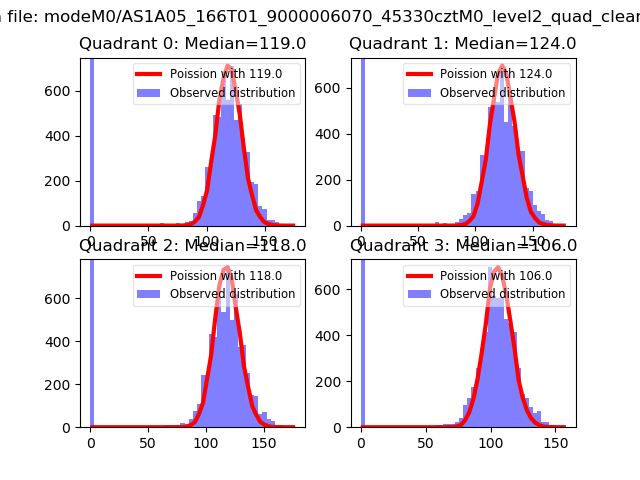 |
 |
| Quadrant-wise count rates Data is divided into 100 sec bins |
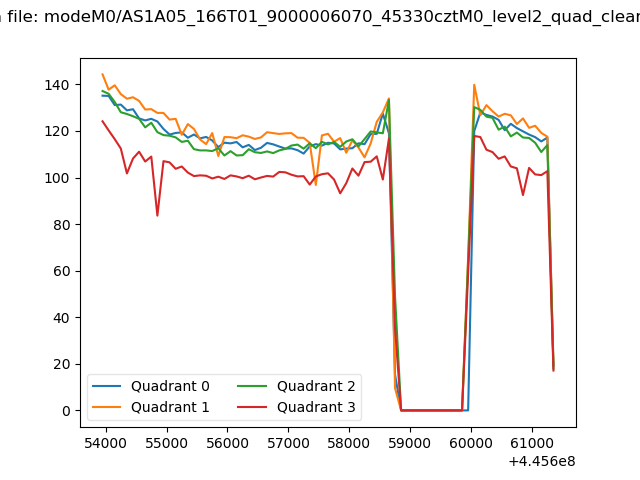 |
|
| Module-wise count rates for Quadrant A Data is divided into 100 sec bins |
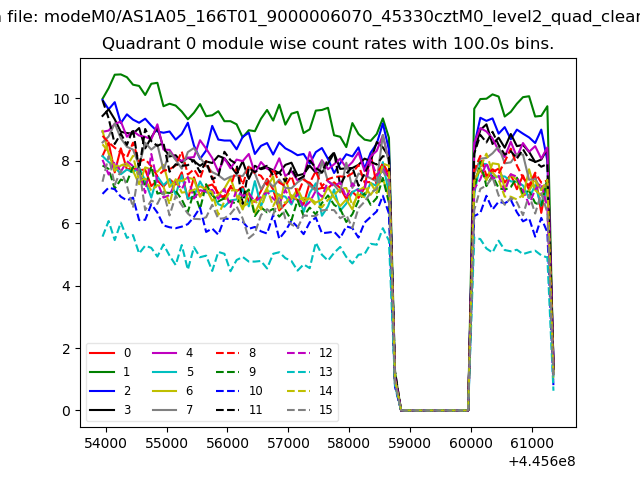 |
 |
| Module-wise count rates for Quadrant B Data is divided into 100 sec bins |
 |
 |
| Module-wise count rates for Quadrant C Data is divided into 100 sec bins |
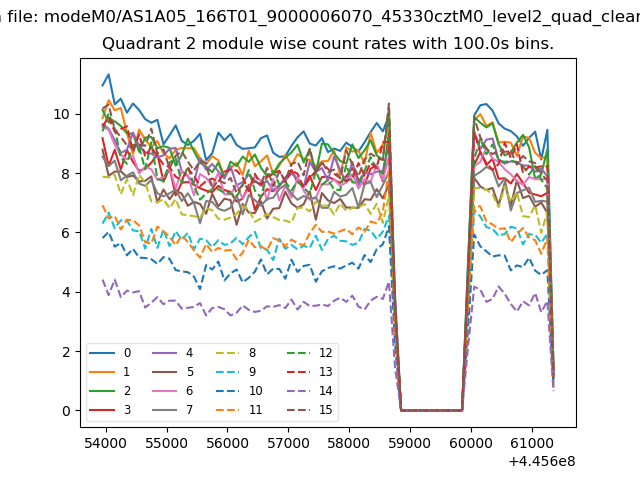 |
 |
| Module-wise count rates for Quadrant D Data is divided into 100 sec bins |
 |
 |
| Parameter | Plot |
|---|---|
| CZT HV Monitor | 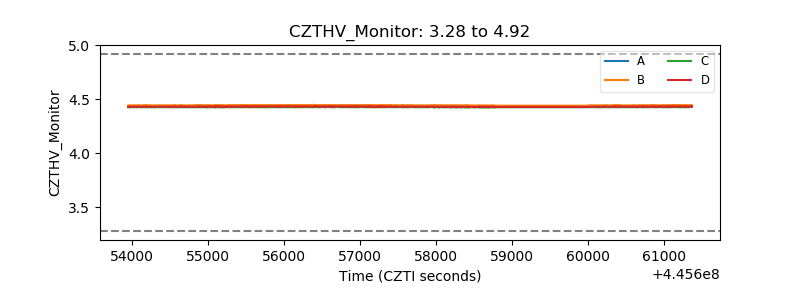 |
| D_VDD | 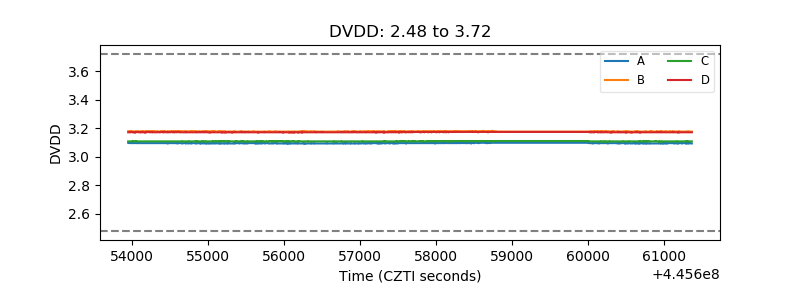 |
| Temperature 1 | 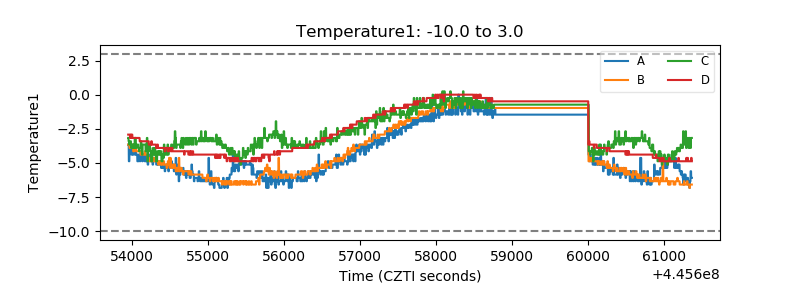 |
| Veto HV Monitor | 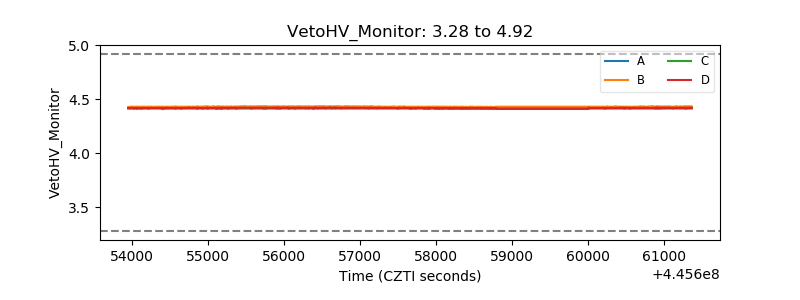 |
| Veto LLD | 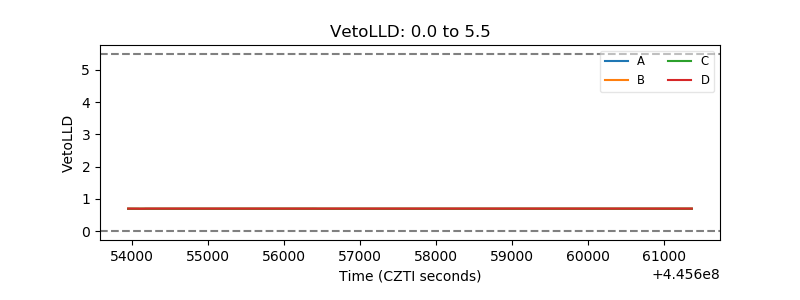 |
| Alpha Counter | 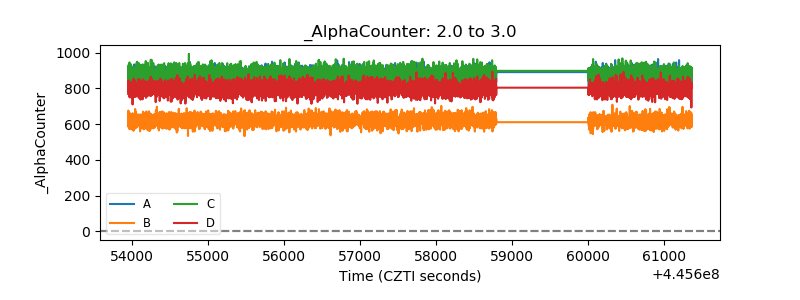 |
| _CPM_Rate | 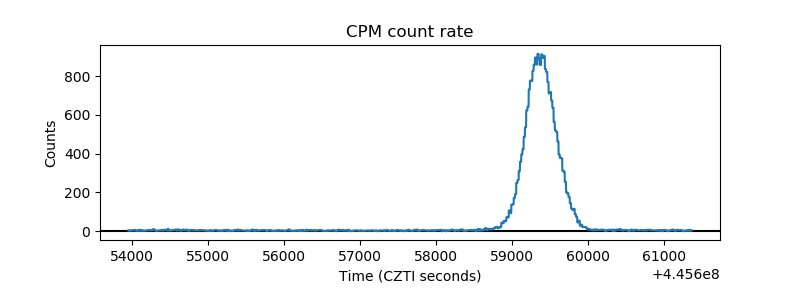 |
| CZT Counter | 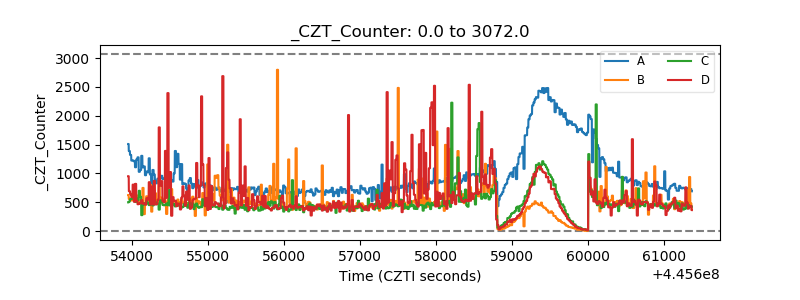 |
| +2.5 Volts monitor | 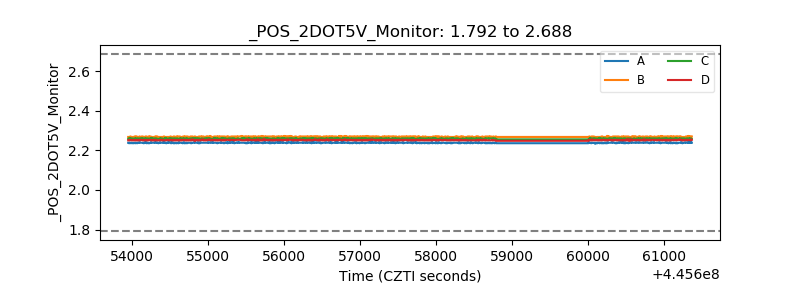 |
| +5 Volts monitor | 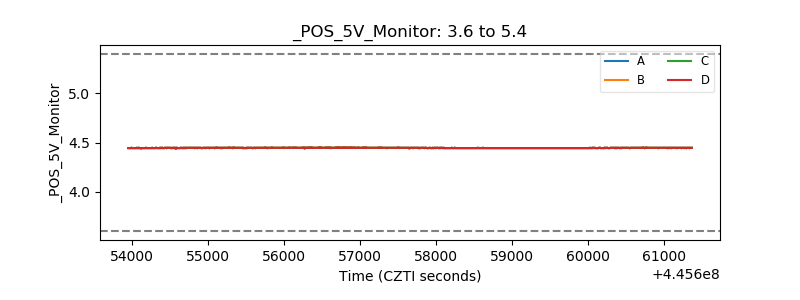 |
| _ROLL_ROT | 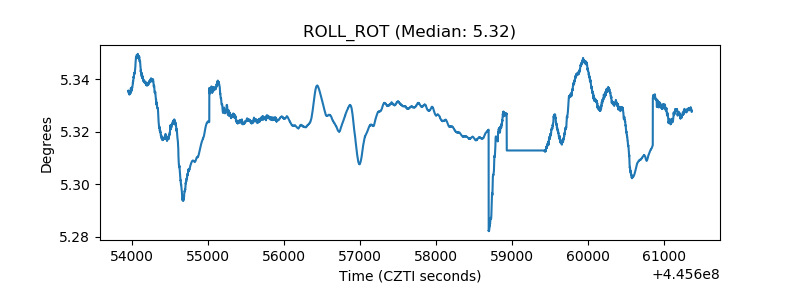 |
| _Roll_DEC | 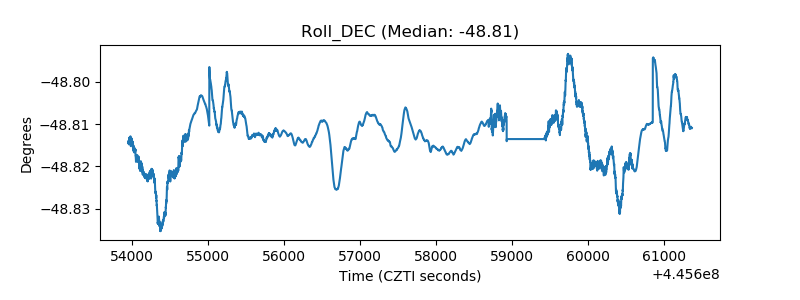 |
| _Roll_RA | 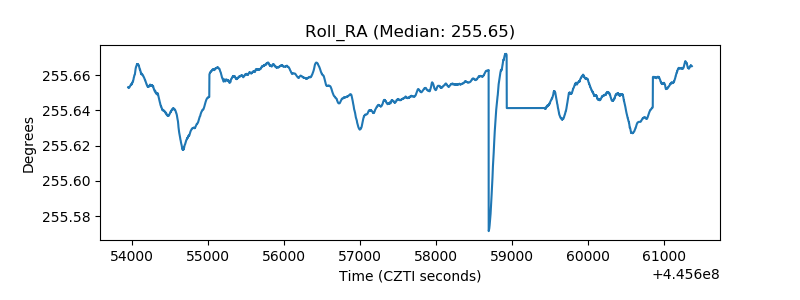 |
| Veto Counter | 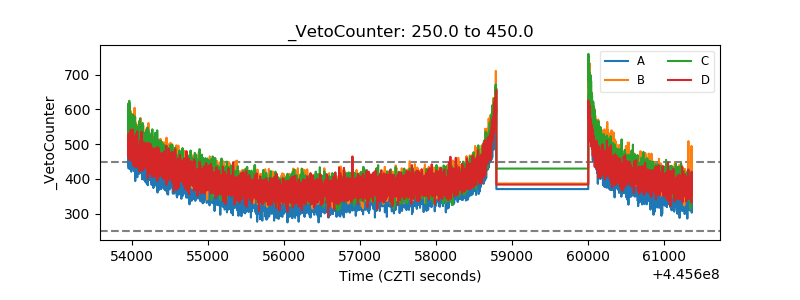 |