| Param | Original file | Final file |
|---|---|---|
| Filename | modeM0/AS1A13_038T01_9000006076_45400cztM0_level2.fits | modeM0/AS1A13_038T01_9000006076_45400cztM0_level2_quad_clean.evt |
| Size (bytes) | 520,404,480 | 108,789,120 |
| Size | 496.3 MB | 103.7 MB |
| Events in quadrant A | 5,654,913 | 734,611 |
| Events in quadrant B | 3,239,249 | 774,849 |
| Events in quadrant C | 3,870,956 | 709,878 |
| Events in quadrant D | 6,002,689 | 628,530 |
| Mode M9 | |||
|---|---|---|---|
| Quadrant | BADHDUFLAG | Total packets | Discarded packets |
| A | 0 | 17 | 0 |
| B | 0 | 18 | 0 |
| C | 0 | 18 | 0 |
| D | 0 | 18 | 0 |
| Mode M0 | |||
|---|---|---|---|
| Quadrant | BADHDUFLAG | Total packets | Discarded packets |
| A | 0 | 21333 | 2 |
| B | 0 | 13988 | 2 |
| C | 0 | 16042 | 2 |
| D | 0 | 22320 | 2 |
| Mode SS | |||
|---|---|---|---|
| Quadrant | BADHDUFLAG | Total packets | Discarded packets |
| A | 0 | 130 | 0 |
| B | 0 | 130 | 0 |
| C | 0 | 130 | 0 |
| D | 0 | 130 | 0 |
| Quadrant | Total seconds | Saturated seconds | Saturation percentage |
|---|---|---|---|
| A | 6395 | 245 | 3.831118% |
| B | 6395 | 92 | 1.438624% |
| C | 6395 | 344 | 5.379203% |
| D | 6395 | 629 | 9.835809% |
Noise dominated data is calculated using 1-second bins in cleaned event files. If a bin has >2000 counts, and if more than 50% of those come from <1% of pixels, then it is considered to be noise-dominated and hence unusable.
| Quadrant | # 1 sec bins | Bins with >0 counts | Bins with >2000 counts | High rate bins dominated by noise | Noise dominated (total time) | Noise dominated (detector-on time) | Marked lightcurve |
|---|---|---|---|---|---|---|---|
| A | 7545 | 6395 | 26 | 26 | 0.34% | 0.41% | 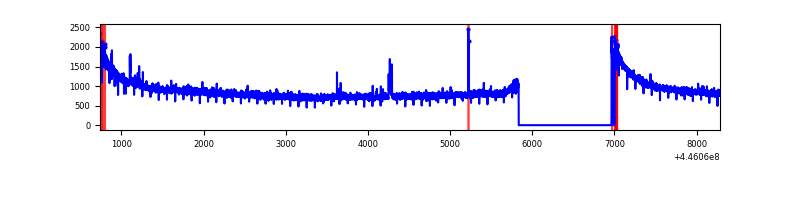 |
| B | 7545 | 6395 | 19 | 19 | 0.25% | 0.30% | 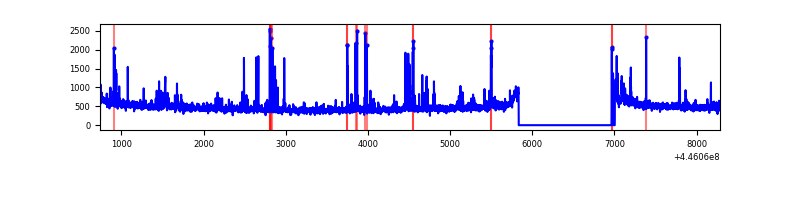 |
| C | 7545 | 6395 | 287 | 287 | 3.80% | 4.49% | 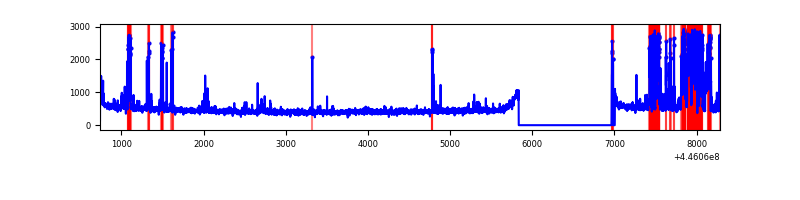 |
| D | 7545 | 6396 | 543 | 543 | 7.20% | 8.49% | 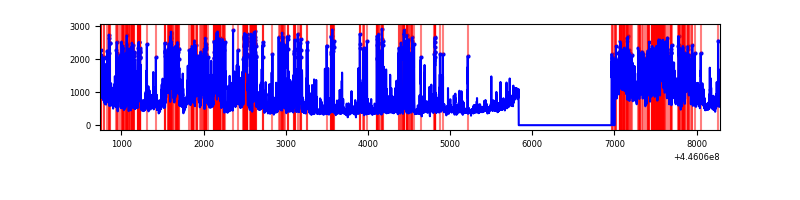 |
Top three noisy pixels from each quadrant. If the there are fewer than three noisy pixels in the level2.evt file, extra rows are filled as -1
| Pixel properties | Quadrant properties | ||||||
|---|---|---|---|---|---|---|---|
| Quadrant | DetID | PixID | Counts | Sigma | Mean | Median | Sigma |
| A | 10 | 83 | 2691793 | 17641.06 | 739 | 724 | 152.5 |
| A | 9 | 191 | 54916 | 355.25 | 739 | 724 | 152.5 |
| A | 10 | 255 | 19642 | 124.02 | 739 | 724 | 152.5 |
| B | 5 | 255 | 141554 | 971.37 | 743 | 721 | 145.0 |
| B | 10 | 3 | 53754 | 365.78 | 743 | 721 | 145.0 |
| B | 4 | 67 | 44306 | 300.62 | 743 | 721 | 145.0 |
| C | 12 | 2 | 924632 | 5446.51 | 722 | 725 | 169.6 |
| C | 3 | 233 | 67654 | 394.55 | 722 | 725 | 169.6 |
| C | 0 | 207 | 21243 | 120.96 | 722 | 725 | 169.6 |
| D | 13 | 249 | 1494036 | 8401.45 | 712 | 690 | 177.7 |
| D | 1 | 52 | 1100380 | 6186.77 | 712 | 690 | 177.7 |
| D | 2 | 249 | 466843 | 2622.54 | 712 | 690 | 177.7 |
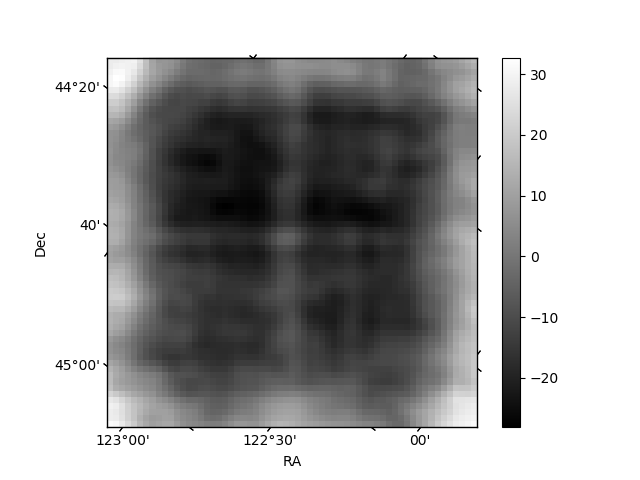
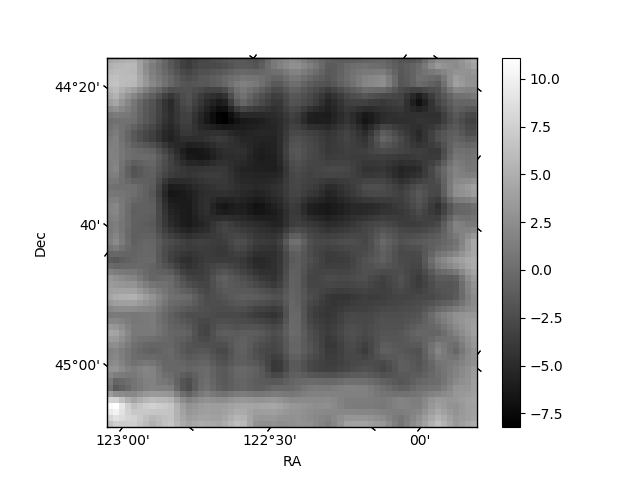
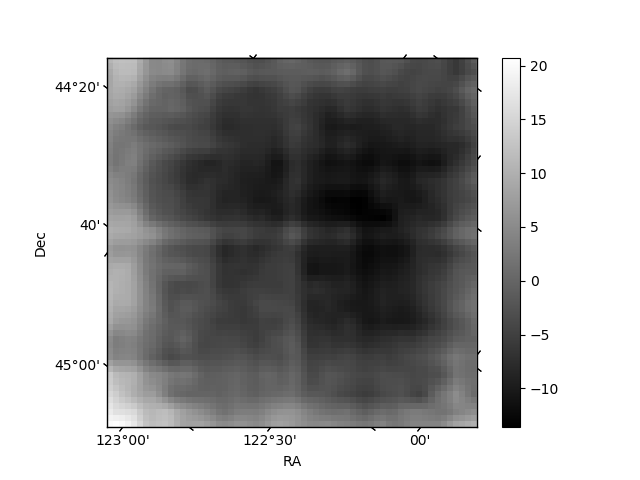
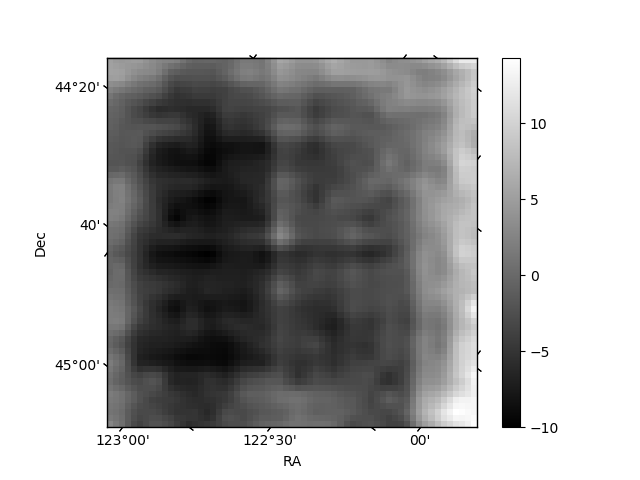
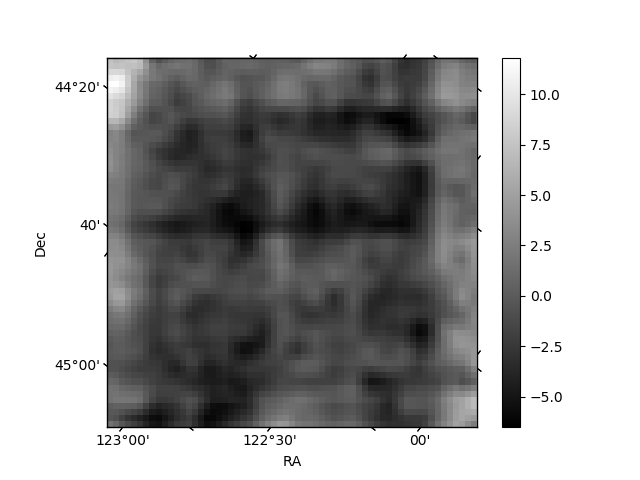
Histogram calculated using DETX and DETY for each event in the final _common_clean file
| Quadrant A | 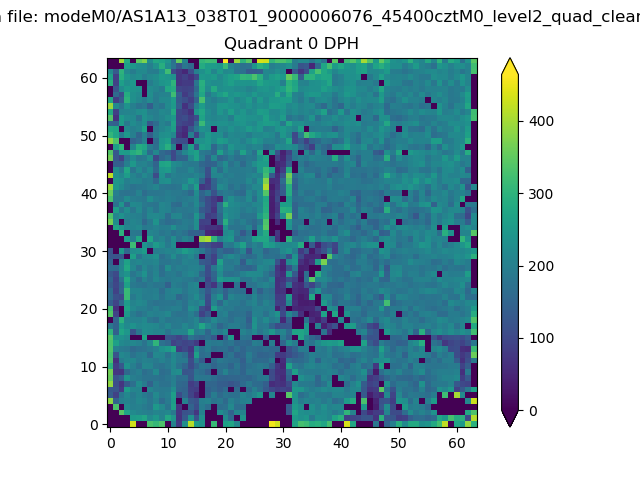 |
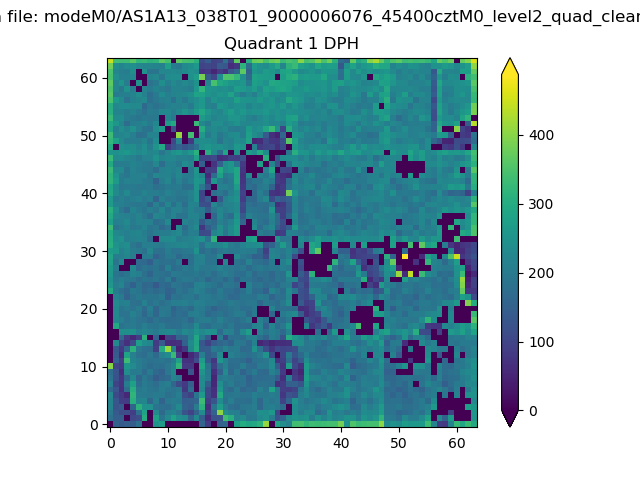 |
Quadrant B |
|---|---|---|---|
| Quadrant D | 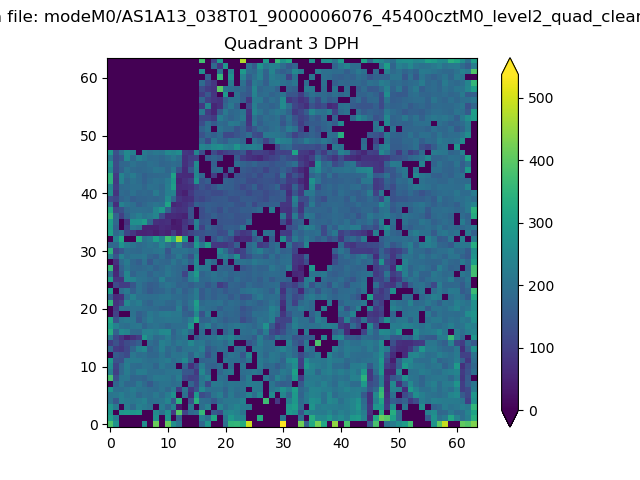 |
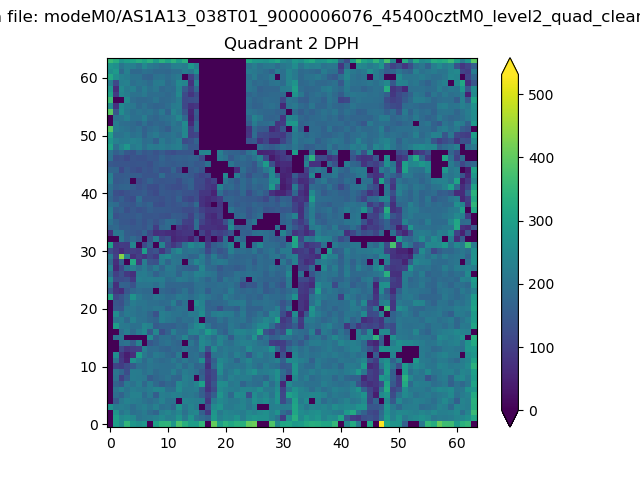 |
Quadrant C |
| Plot type | Count rate plots | Images |
|---|---|---|
| Comparison with Poisson distribution Blue bars denote a histogram of data divided into 1 sec bins. Red curve is a Poisson curve with rate = median count rate of data. |
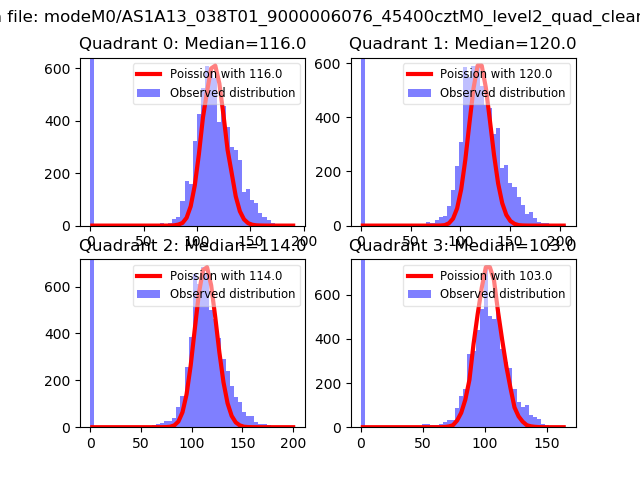 |
 |
| Quadrant-wise count rates Data is divided into 100 sec bins |
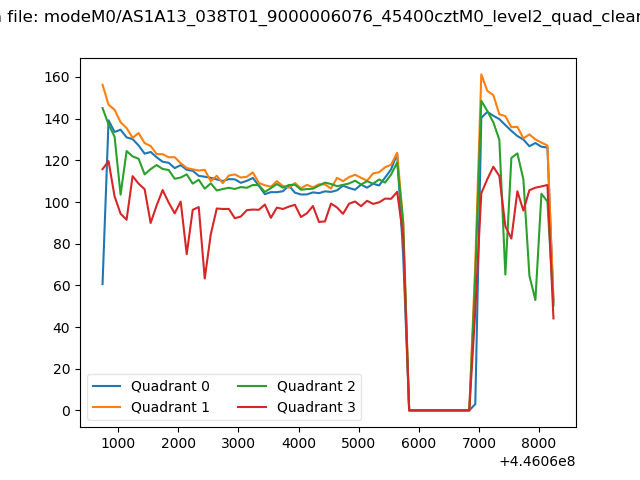 |
|
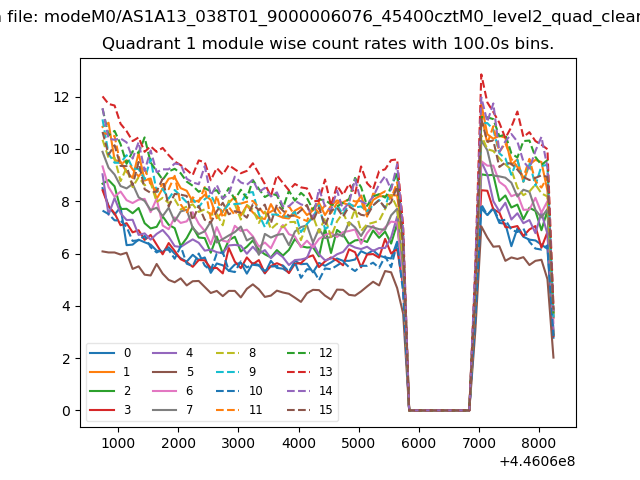
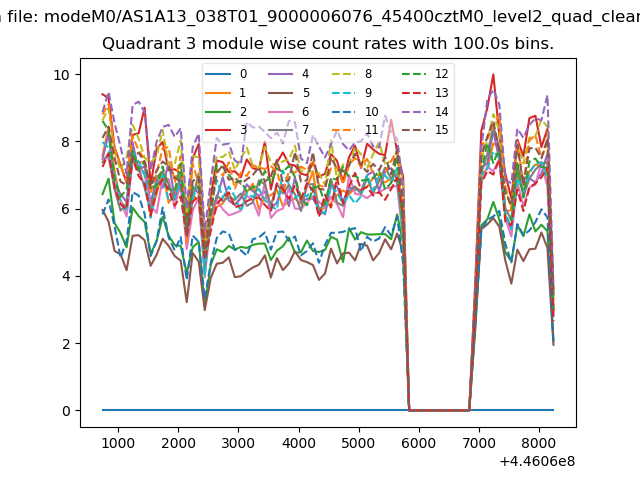
| Module-wise count rates for Quadrant A Data is divided into 100 sec bins |
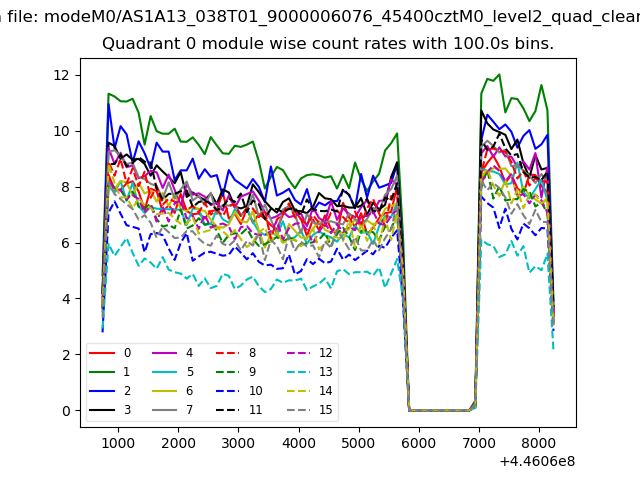 |
 |
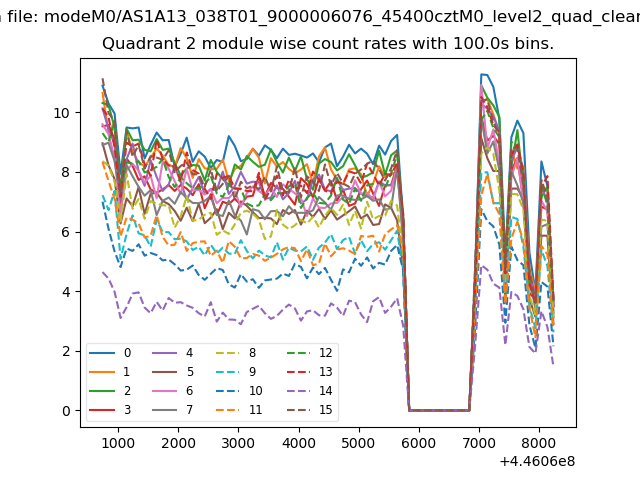
| Module-wise count rates for Quadrant B Data is divided into 100 sec bins |
 |
 |
| Module-wise count rates for Quadrant C Data is divided into 100 sec bins |
 |
 |
| Module-wise count rates for Quadrant D Data is divided into 100 sec bins |
 |
 |
| Parameter | Plot |
|---|---|
| CZT HV Monitor | 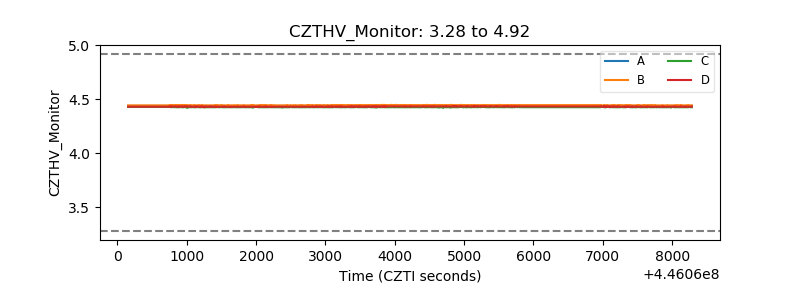 |
| D_VDD | 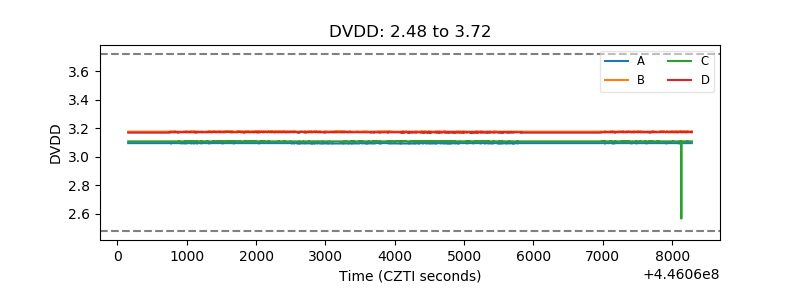 |
| Temperature 1 | 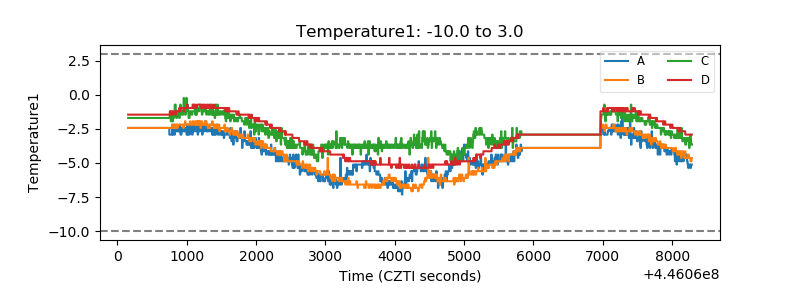 |
| Veto HV Monitor |  |
| Veto LLD | 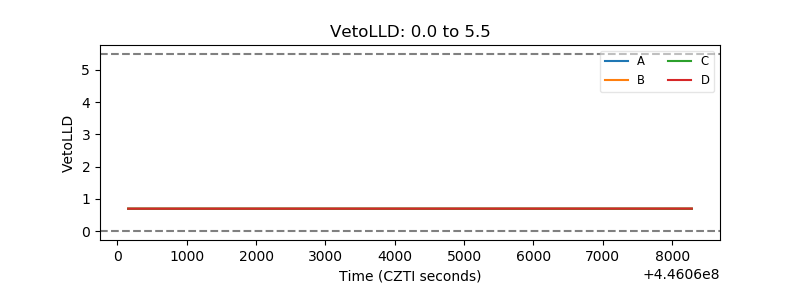 |
| Alpha Counter | 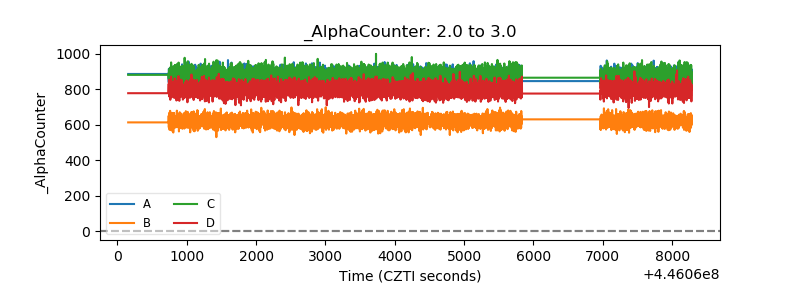 |
| _CPM_Rate | 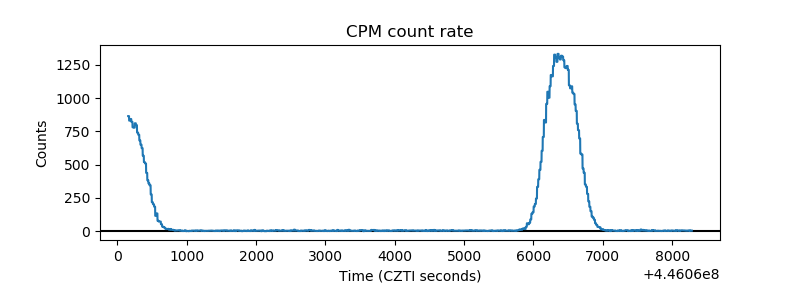 |
| CZT Counter | 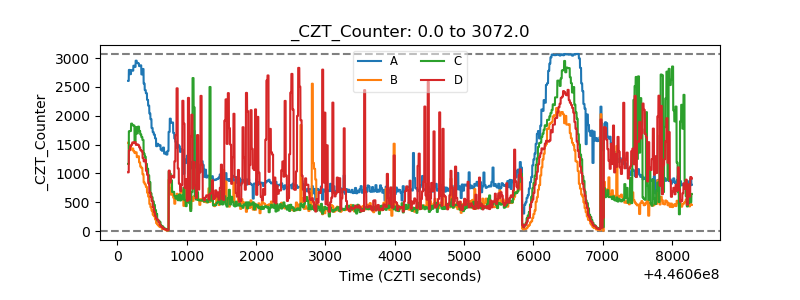 |
| +2.5 Volts monitor | 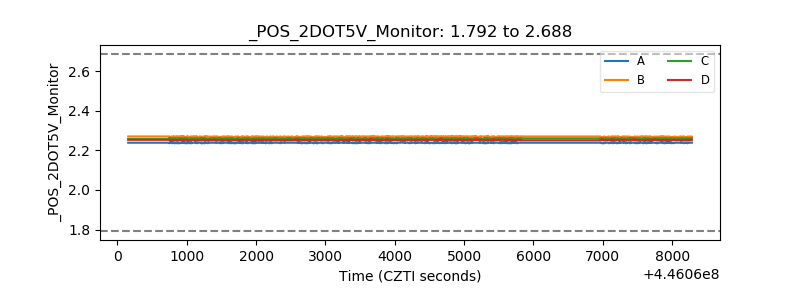 |
| +5 Volts monitor | 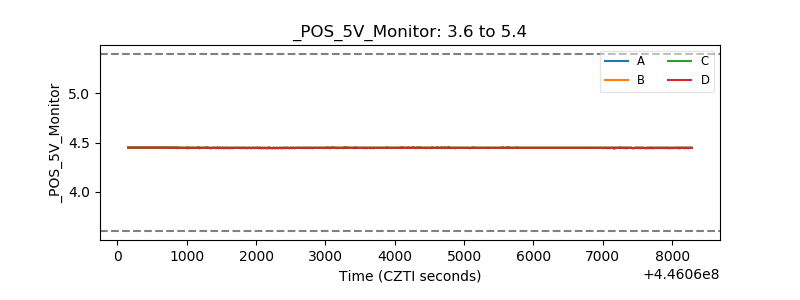 |
| _ROLL_ROT | 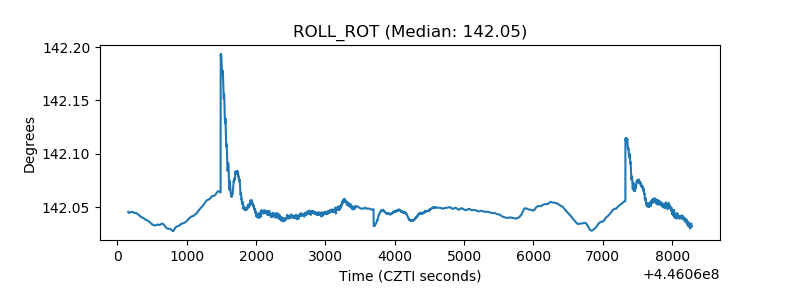 |
| _Roll_DEC | 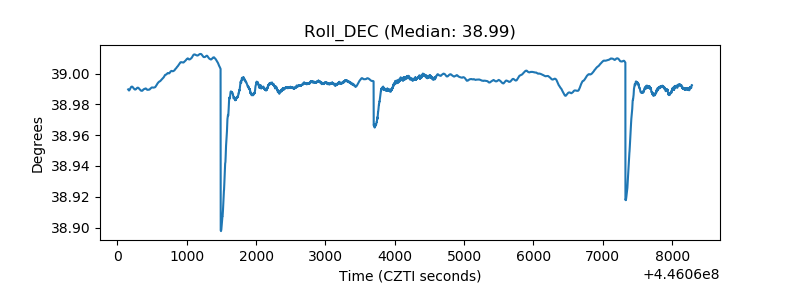 |
| _Roll_RA | 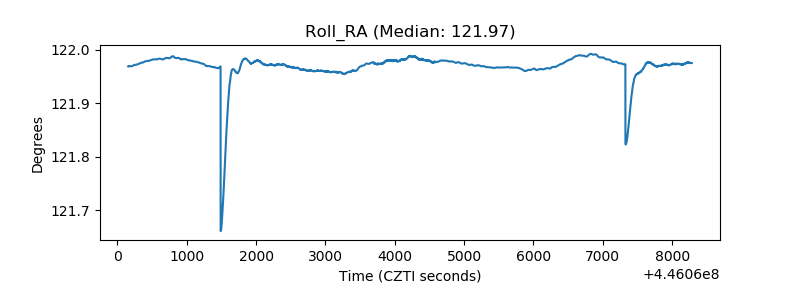 |
| Veto Counter | 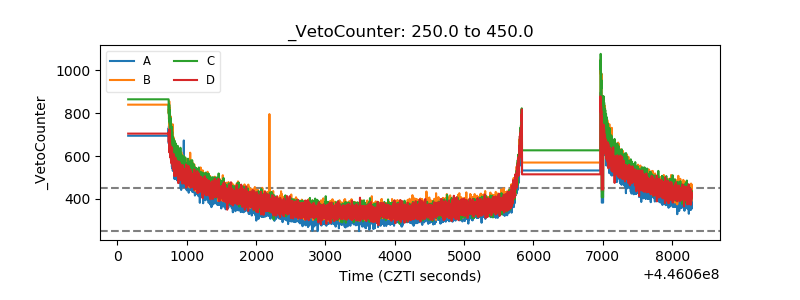 |