| Param | Original file | Final file |
|---|---|---|
| Filename | modeM0/AS1A13_041T08_9000006084_45445cztM0_level2.fits | modeM0/AS1A13_041T08_9000006084_45445cztM0_level2_quad_clean.evt |
| Size (bytes) | 431,717,760 | 100,010,880 |
| Size | 411.7 MB | 95.4 MB |
| Events in quadrant A | 5,530,892 | 652,804 |
| Events in quadrant B | 2,930,282 | 712,465 |
| Events in quadrant C | 3,132,447 | 658,854 |
| Events in quadrant D | 3,928,076 | 590,741 |
| Mode M9 | |||
|---|---|---|---|
| Quadrant | BADHDUFLAG | Total packets | Discarded packets |
| A | 0 | 12 | 0 |
| B | 0 | 13 | 0 |
| C | 0 | 13 | 0 |
| D | 0 | 13 | 0 |
| Mode SS | |||
|---|---|---|---|
| Quadrant | BADHDUFLAG | Total packets | Discarded packets |
| A | 0 | 122 | 0 |
| B | 0 | 122 | 0 |
| C | 0 | 122 | 0 |
| D | 0 | 122 | 0 |
| Mode M0 | |||
|---|---|---|---|
| Quadrant | BADHDUFLAG | Total packets | Discarded packets |
| A | 0 | 20658 | 2 |
| B | 0 | 12654 | 2 |
| C | 0 | 13484 | 2 |
| D | 0 | 15858 | 2 |
| Quadrant | Total seconds | Saturated seconds | Saturation percentage |
|---|---|---|---|
| A | 5910 | 321 | 5.431472% |
| B | 5910 | 78 | 1.319797% |
| C | 5910 | 103 | 1.742809% |
| D | 5910 | 200 | 3.384095% |
Noise dominated data is calculated using 1-second bins in cleaned event files. If a bin has >2000 counts, and if more than 50% of those come from <1% of pixels, then it is considered to be noise-dominated and hence unusable.
| Quadrant | # 1 sec bins | Bins with >0 counts | Bins with >2000 counts | High rate bins dominated by noise | Noise dominated (total time) | Noise dominated (detector-on time) | Marked lightcurve |
|---|---|---|---|---|---|---|---|
| A | 7110 | 5911 | 172 | 172 | 2.42% | 2.91% | 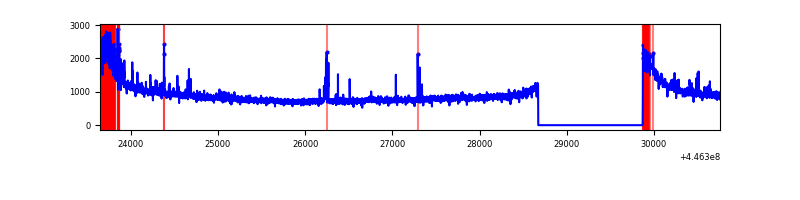 |
| B | 7110 | 5911 | 7 | 7 | 0.10% | 0.12% | 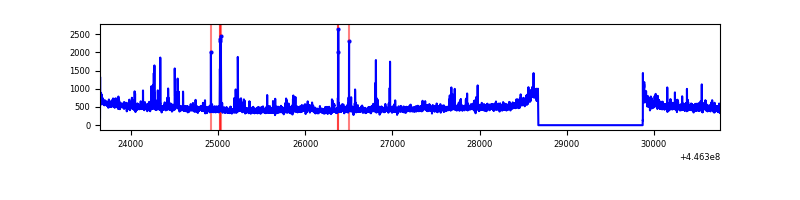 |
| C | 7110 | 5911 | 78 | 78 | 1.10% | 1.32% | 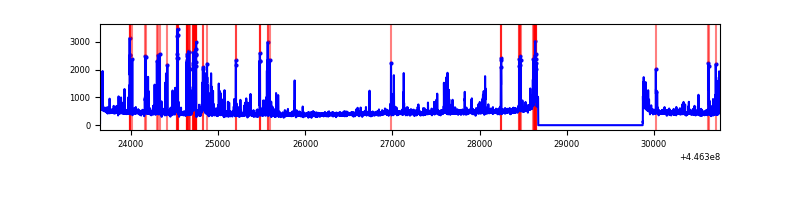 |
| D | 7110 | 5911 | 167 | 167 | 2.35% | 2.83% | 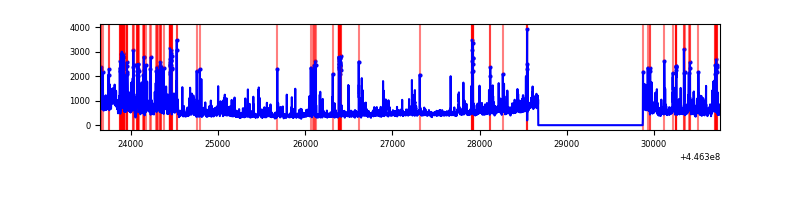 |
Top three noisy pixels from each quadrant. If the there are fewer than three noisy pixels in the level2.evt file, extra rows are filled as -1
| Pixel properties | Quadrant properties | ||||||
|---|---|---|---|---|---|---|---|
| Quadrant | DetID | PixID | Counts | Sigma | Mean | Median | Sigma |
| A | 10 | 83 | 2633089 | 19163.15 | 664 | 652 | 137.4 |
| A | 13 | 248 | 218593 | 1586.53 | 664 | 652 | 137.4 |
| A | 10 | 248 | 48447 | 347.93 | 664 | 652 | 137.4 |
| B | 4 | 170 | 38044 | 284.68 | 681 | 662 | 131.3 |
| B | 5 | 172 | 36698 | 274.43 | 681 | 662 | 131.3 |
| B | 15 | 201 | 34890 | 260.66 | 681 | 662 | 131.3 |
| C | 14 | 254 | 277618 | 1796.37 | 653 | 654 | 154.2 |
| C | 12 | 2 | 95410 | 614.58 | 653 | 654 | 154.2 |
| C | 14 | 96 | 77893 | 500.97 | 653 | 654 | 154.2 |
| D | 11 | 241 | 355528 | 2208.93 | 640 | 621 | 160.7 |
| D | 1 | 52 | 322384 | 2002.64 | 640 | 621 | 160.7 |
| D | 13 | 249 | 199207 | 1235.99 | 640 | 621 | 160.7 |
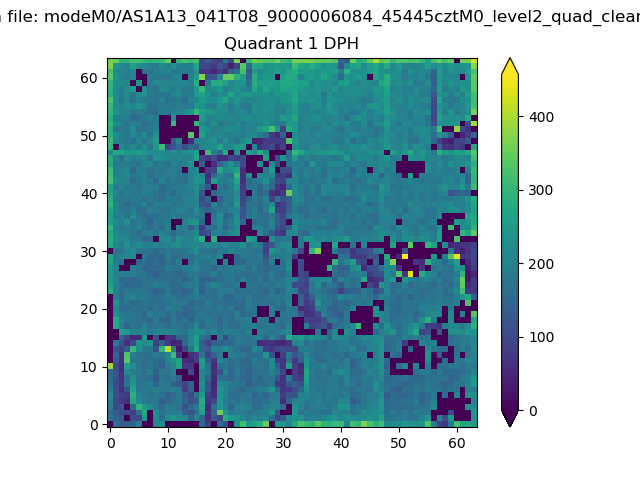
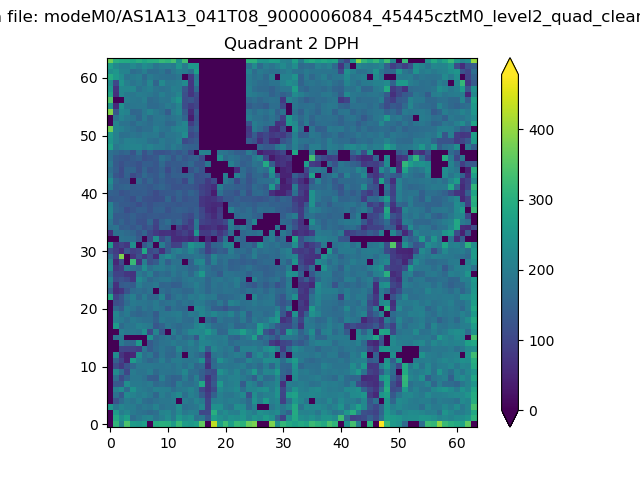
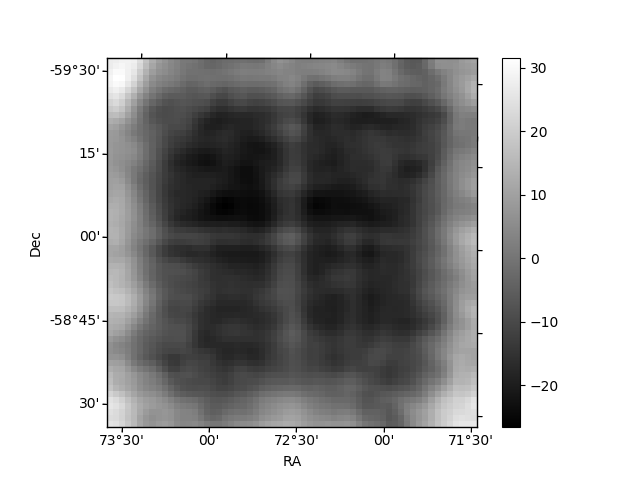
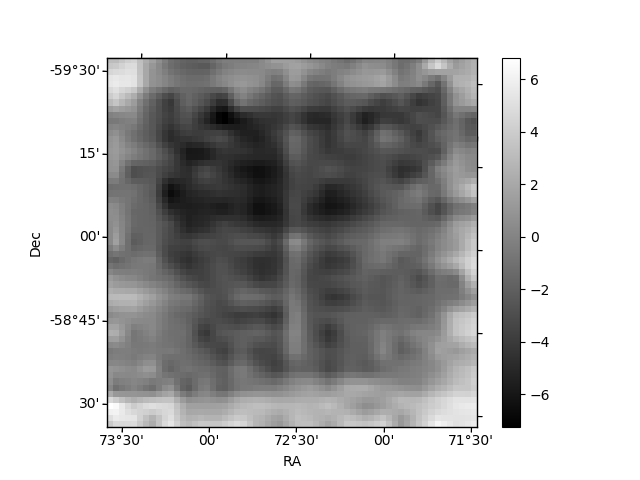
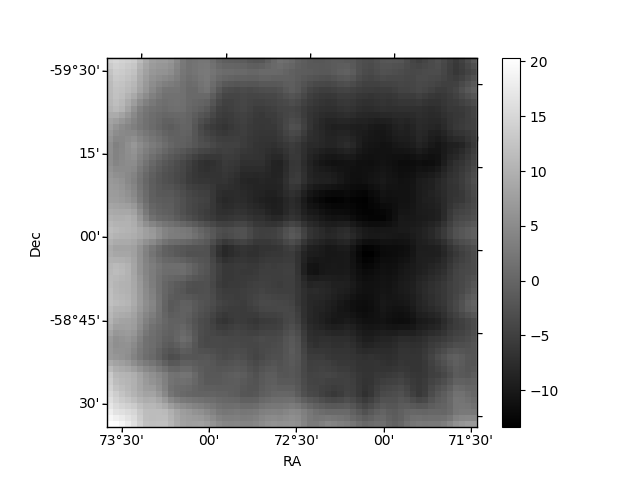
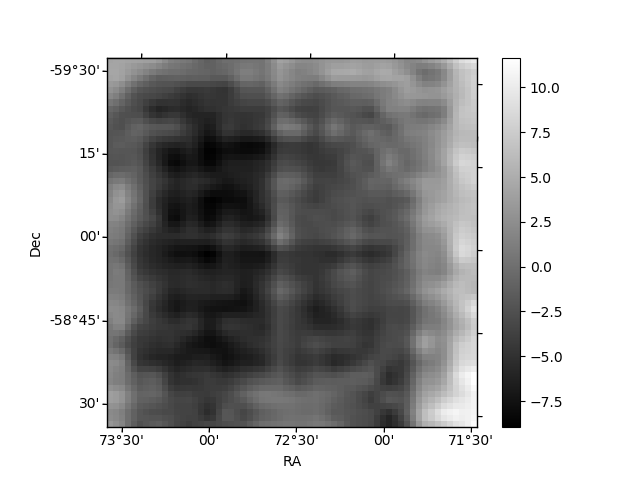
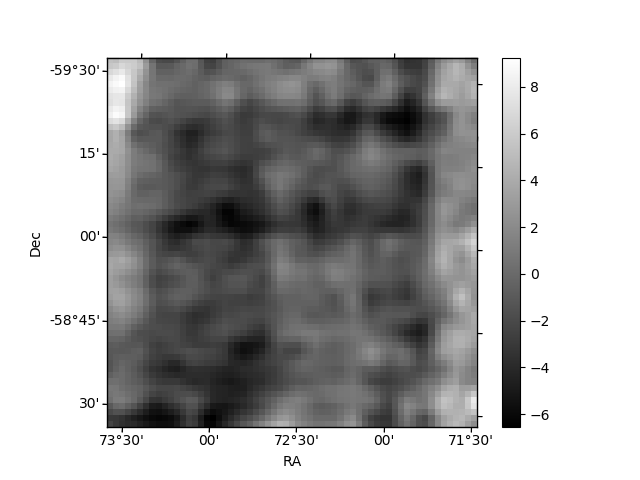
Histogram calculated using DETX and DETY for each event in the final _common_clean file
| Quadrant A |  |
 |
Quadrant B |
|---|---|---|---|
| Quadrant D | 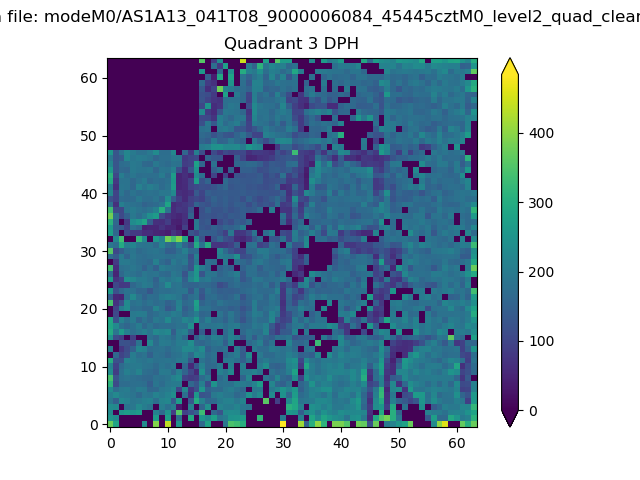 |
 |
Quadrant C |
| Plot type | Count rate plots | Images |
|---|---|---|
| Comparison with Poisson distribution Blue bars denote a histogram of data divided into 1 sec bins. Red curve is a Poisson curve with rate = median count rate of data. |
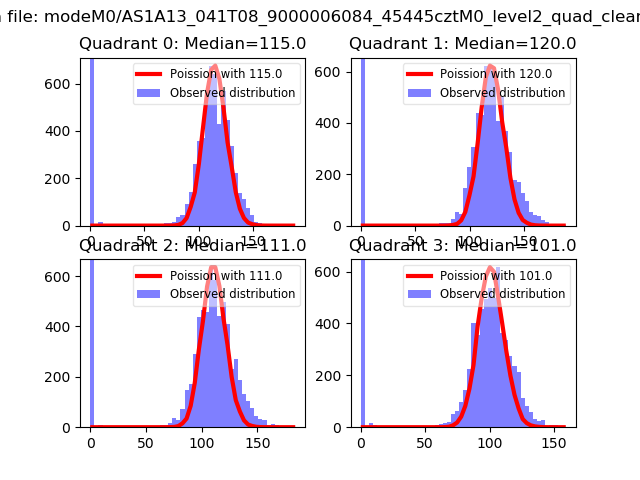 |
 |
| Quadrant-wise count rates Data is divided into 100 sec bins |
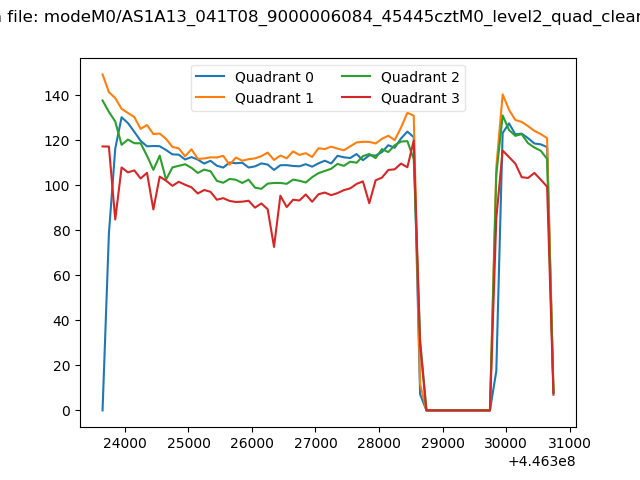 |
|
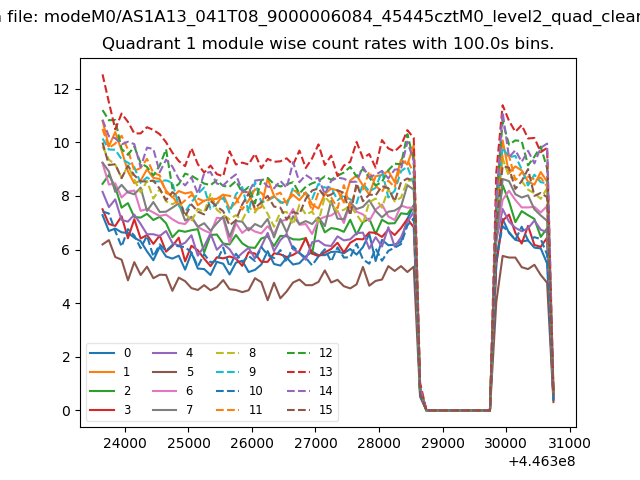
| Module-wise count rates for Quadrant A Data is divided into 100 sec bins |
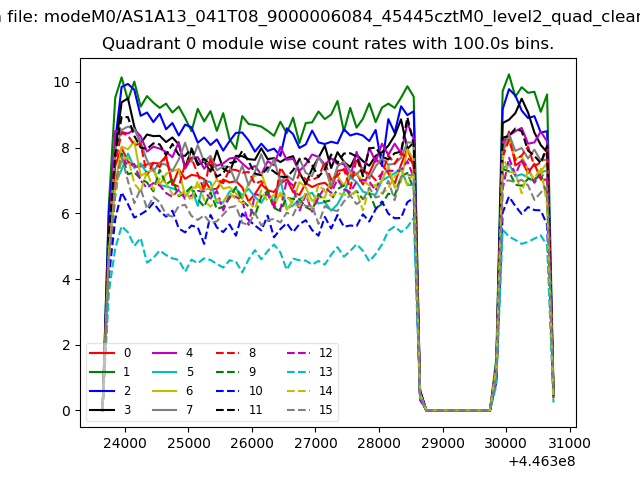 |
 |
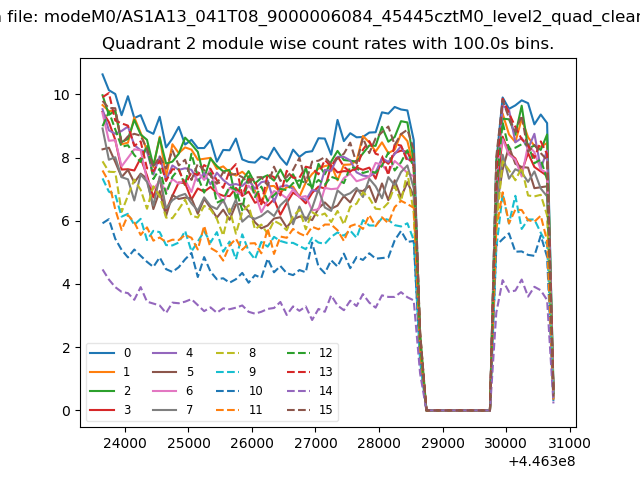
| Module-wise count rates for Quadrant B Data is divided into 100 sec bins |
 |
 |
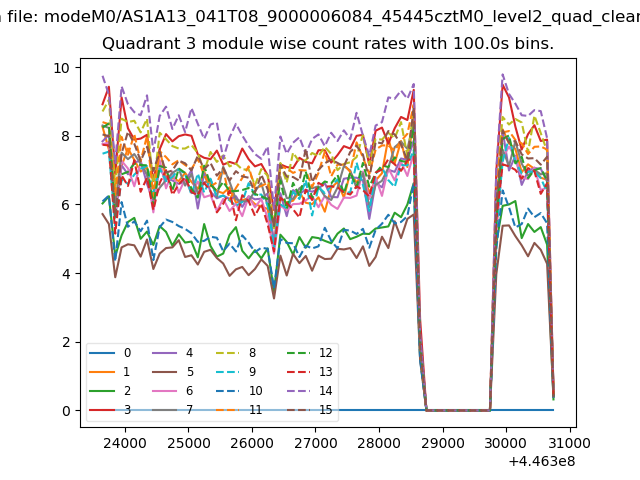
| Module-wise count rates for Quadrant C Data is divided into 100 sec bins |
 |
 |
| Module-wise count rates for Quadrant D Data is divided into 100 sec bins |
 |
 |
| Parameter | Plot |
|---|---|
| CZT HV Monitor | 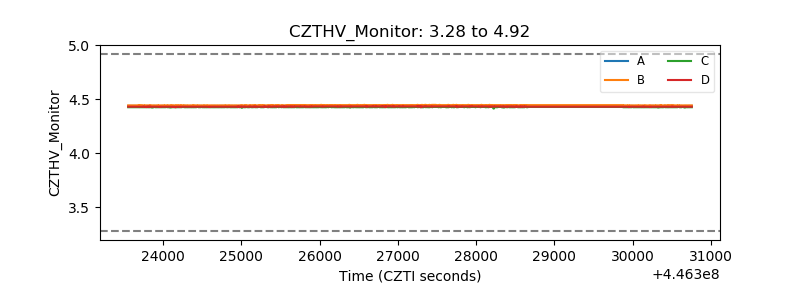 |
| D_VDD | 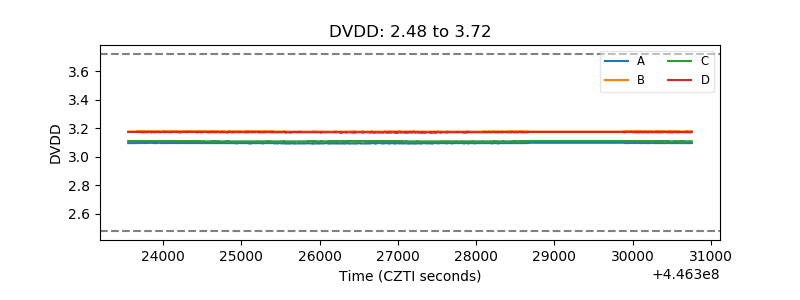 |
| Temperature 1 | 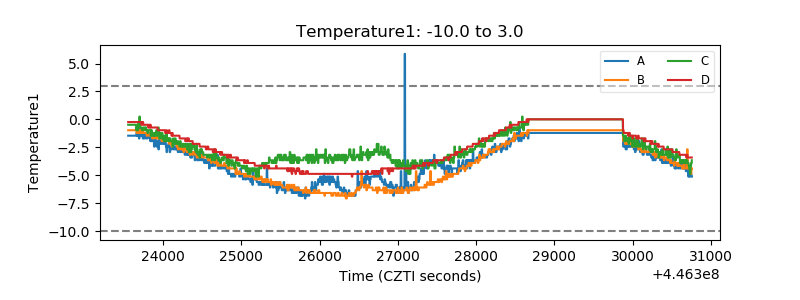 |
| Veto HV Monitor | 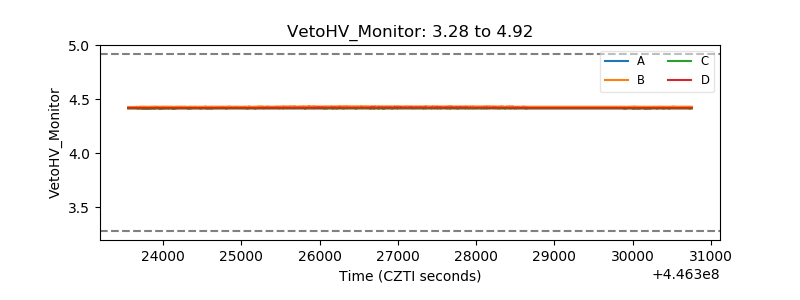 |
| Veto LLD | 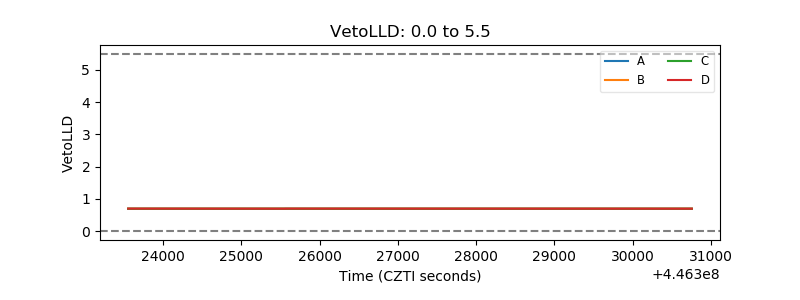 |
| Alpha Counter | 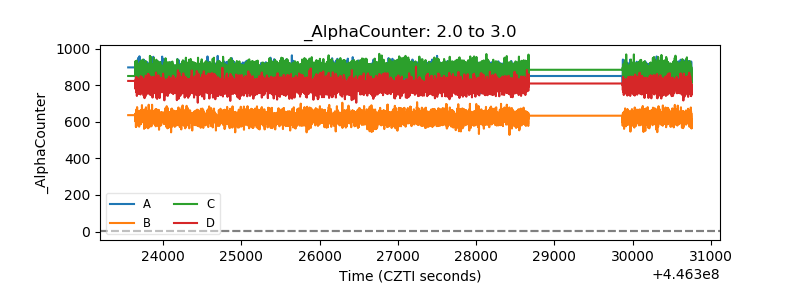 |
| _CPM_Rate | 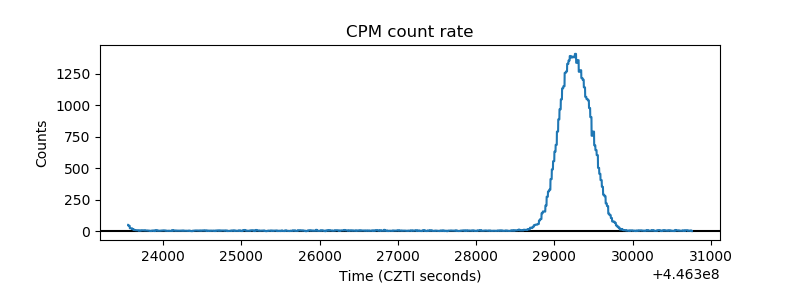 |
| CZT Counter | 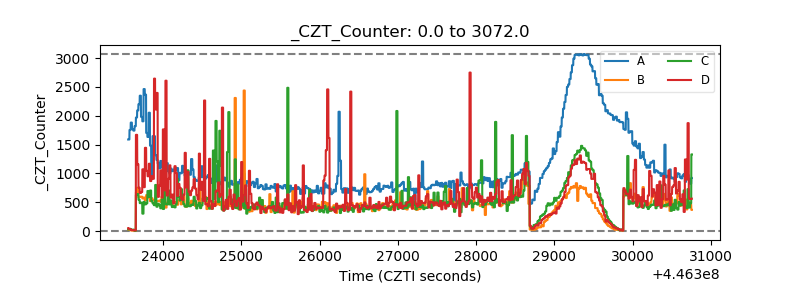 |
| +2.5 Volts monitor | 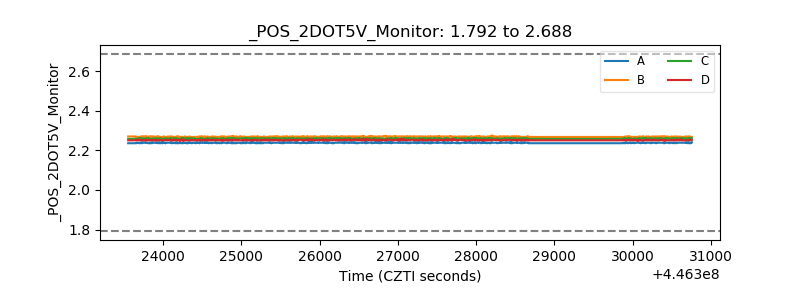 |
| +5 Volts monitor | 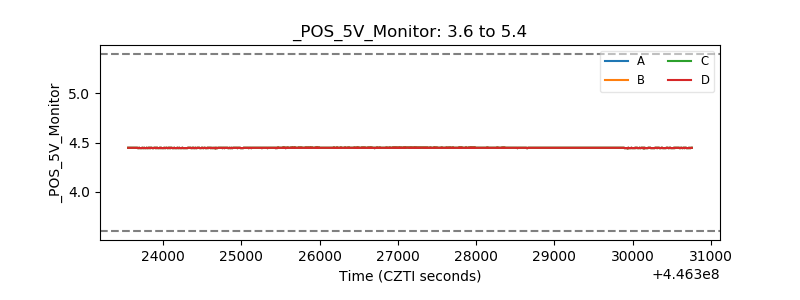 |
| _ROLL_ROT | 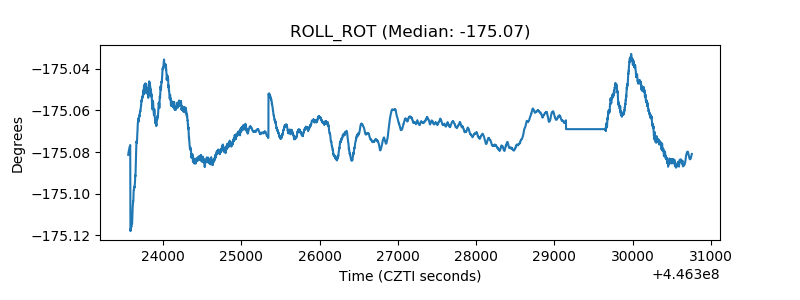 |
| _Roll_DEC | 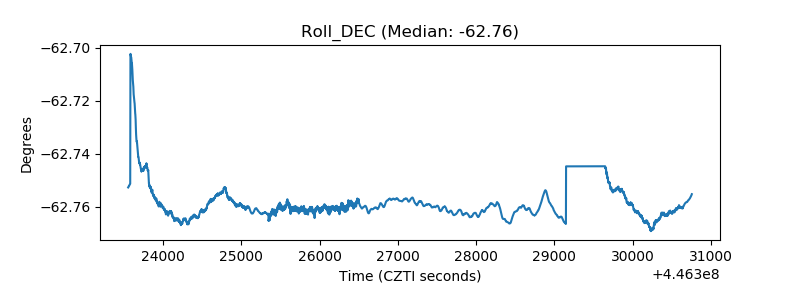 |
| _Roll_RA | 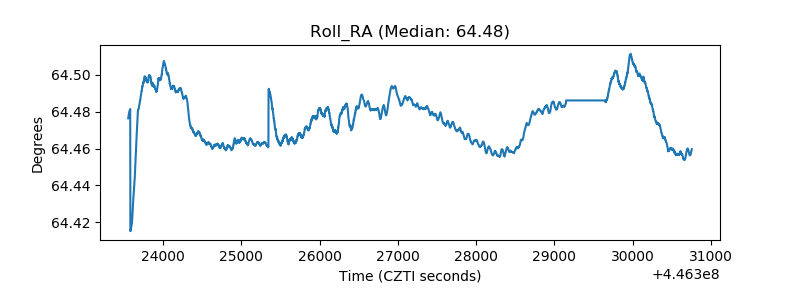 |
| Veto Counter | 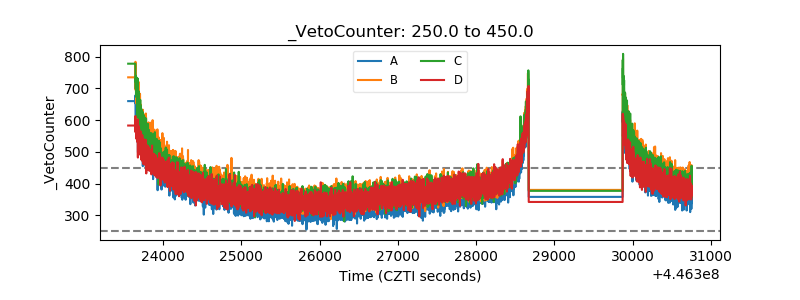 |