| Param | Original file | Final file |
|---|---|---|
| Filename | modeM0/AS1A13_041T15_9000006086_45447cztM0_level2.fits | modeM0/AS1A13_041T15_9000006086_45447cztM0_level2_quad_clean.evt |
| Size (bytes) | 488,813,760 | 106,499,520 |
| Size | 466.2 MB | 101.6 MB |
| Events in quadrant A | 5,786,578 | 701,053 |
| Events in quadrant B | 3,510,974 | 740,322 |
| Events in quadrant C | 3,703,073 | 702,801 |
| Events in quadrant D | 4,588,138 | 625,765 |
| Mode M9 | |||
|---|---|---|---|
| Quadrant | BADHDUFLAG | Total packets | Discarded packets |
| A | 0 | 20 | 0 |
| B | 0 | 21 | 0 |
| C | 0 | 21 | 0 |
| D | 0 | 21 | 0 |
| Mode M0 | |||
|---|---|---|---|
| Quadrant | BADHDUFLAG | Total packets | Discarded packets |
| A | 0 | 21866 | 2 |
| B | 0 | 14829 | 2 |
| C | 0 | 15645 | 2 |
| D | 0 | 18031 | 2 |
| Mode SS | |||
|---|---|---|---|
| Quadrant | BADHDUFLAG | Total packets | Discarded packets |
| A | 0 | 134 | 0 |
| B | 0 | 134 | 0 |
| C | 0 | 134 | 0 |
| D | 0 | 134 | 0 |
| Quadrant | Total seconds | Saturated seconds | Saturation percentage |
|---|---|---|---|
| A | 6516 | 248 | 3.806016% |
| B | 6516 | 130 | 1.995089% |
| C | 6516 | 152 | 2.332719% |
| D | 6516 | 283 | 4.343155% |
Noise dominated data is calculated using 1-second bins in cleaned event files. If a bin has >2000 counts, and if more than 50% of those come from <1% of pixels, then it is considered to be noise-dominated and hence unusable.
| Quadrant | # 1 sec bins | Bins with >0 counts | Bins with >2000 counts | High rate bins dominated by noise | Noise dominated (total time) | Noise dominated (detector-on time) | Marked lightcurve |
|---|---|---|---|---|---|---|---|
| A | 7576 | 6517 | 133 | 133 | 1.76% | 2.04% | 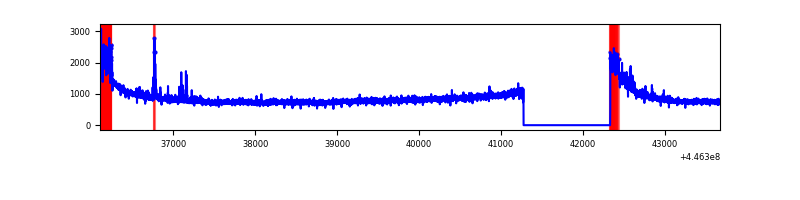 |
| B | 7576 | 6517 | 62 | 62 | 0.82% | 0.95% | 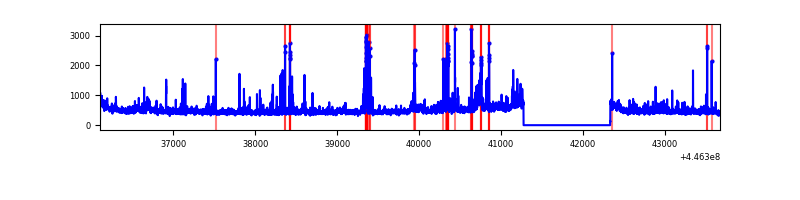 |
| C | 7576 | 6517 | 130 | 130 | 1.72% | 1.99% | 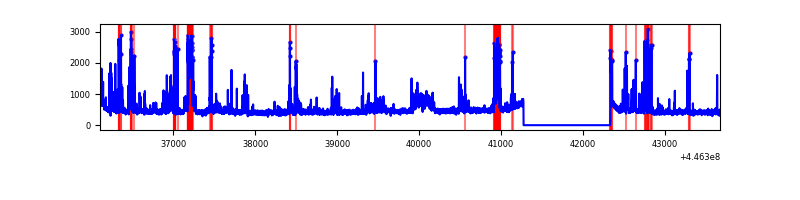 |
| D | 7576 | 6517 | 312 | 312 | 4.12% | 4.79% | 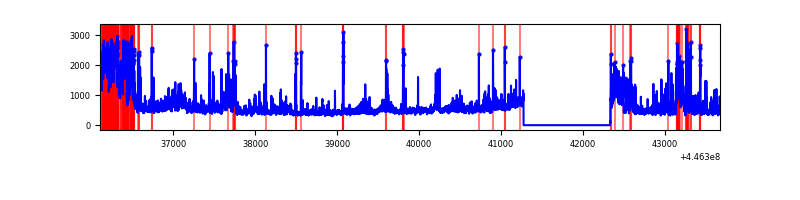 |
Top three noisy pixels from each quadrant. If the there are fewer than three noisy pixels in the level2.evt file, extra rows are filled as -1
| Pixel properties | Quadrant properties | ||||||
|---|---|---|---|---|---|---|---|
| Quadrant | DetID | PixID | Counts | Sigma | Mean | Median | Sigma |
| A | 10 | 83 | 2765153 | 18485.36 | 721 | 707 | 149.5 |
| A | 13 | 248 | 152992 | 1018.3 | 721 | 707 | 149.5 |
| A | 0 | 243 | 35238 | 230.9 | 721 | 707 | 149.5 |
| B | 5 | 172 | 133484 | 922.02 | 733 | 712 | 144.0 |
| B | 0 | 171 | 126864 | 876.05 | 733 | 712 | 144.0 |
| B | 0 | 186 | 105728 | 729.27 | 733 | 712 | 144.0 |
| C | 14 | 96 | 572048 | 3360.53 | 718 | 721 | 170.0 |
| C | 14 | 254 | 147934 | 865.9 | 718 | 721 | 170.0 |
| C | 1 | 3 | 102686 | 599.76 | 718 | 721 | 170.0 |
| D | 5 | 222 | 547194 | 3099.28 | 704 | 682 | 176.3 |
| D | 11 | 241 | 475448 | 2692.41 | 704 | 682 | 176.3 |
| D | 1 | 52 | 210910 | 1192.2 | 704 | 682 | 176.3 |
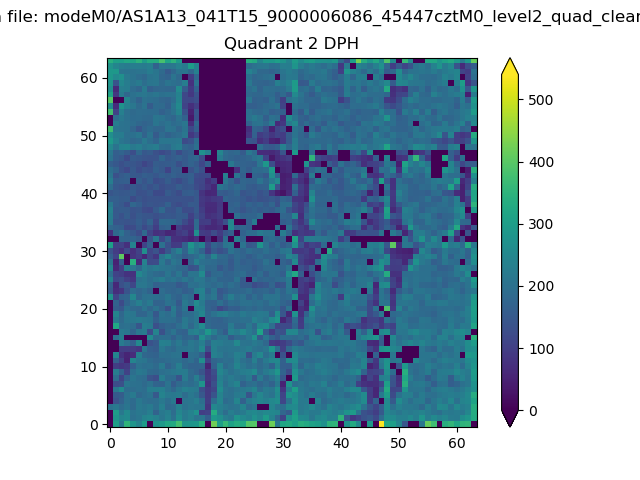
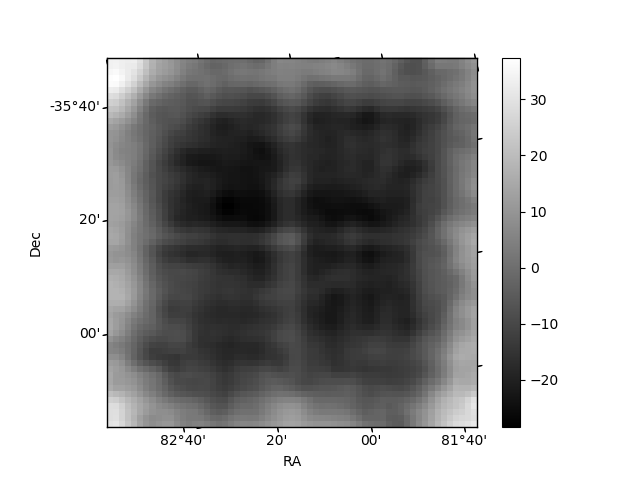
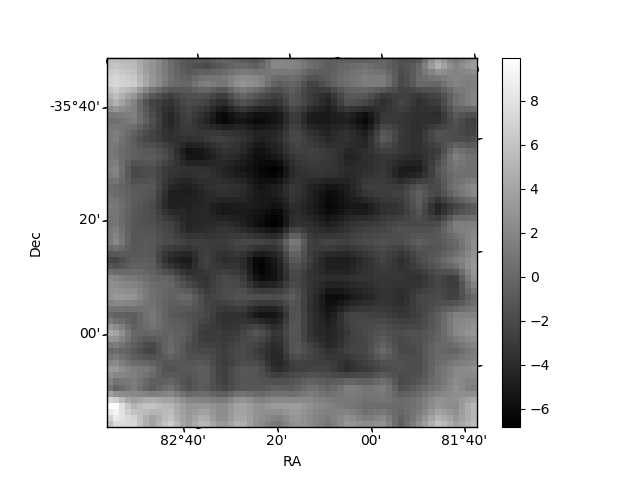
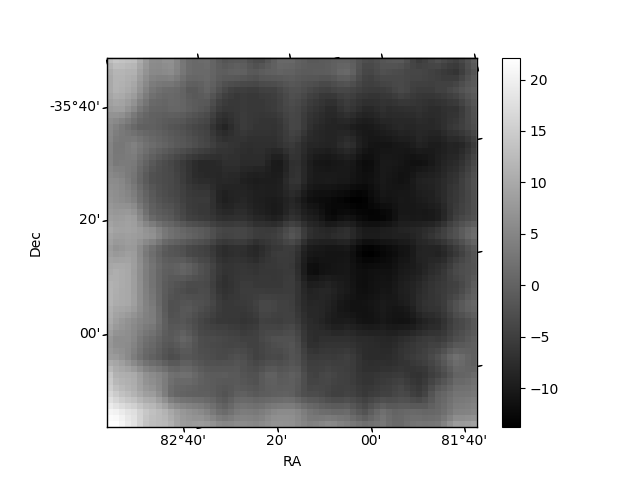
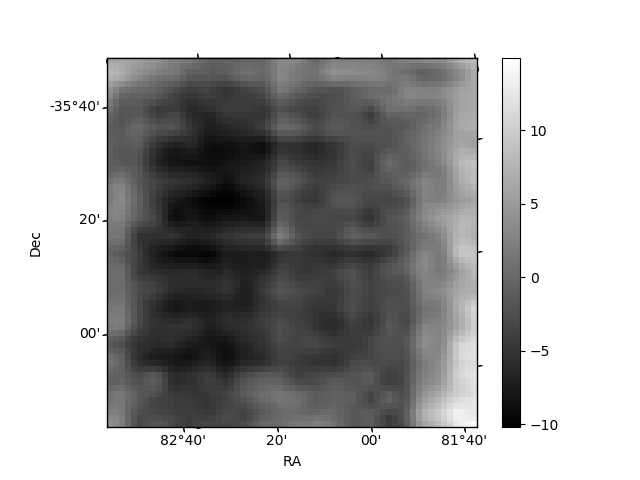
Histogram calculated using DETX and DETY for each event in the final _common_clean file
| Quadrant A | 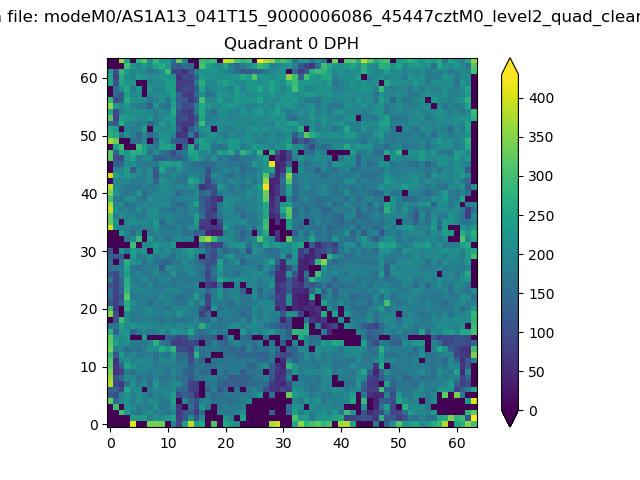 |
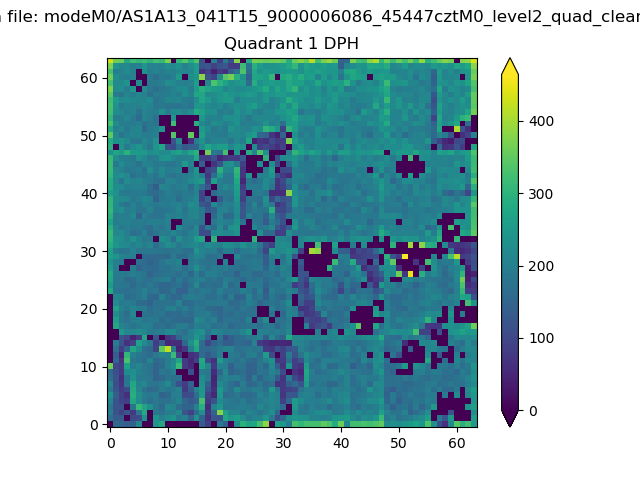 |
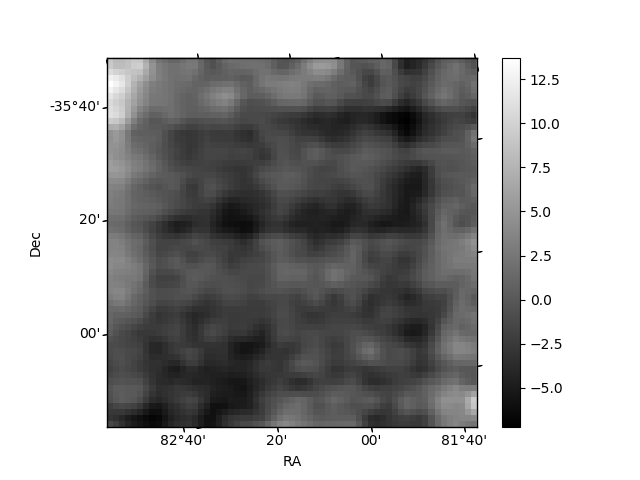
Quadrant B |
|---|---|---|---|
| Quadrant D | 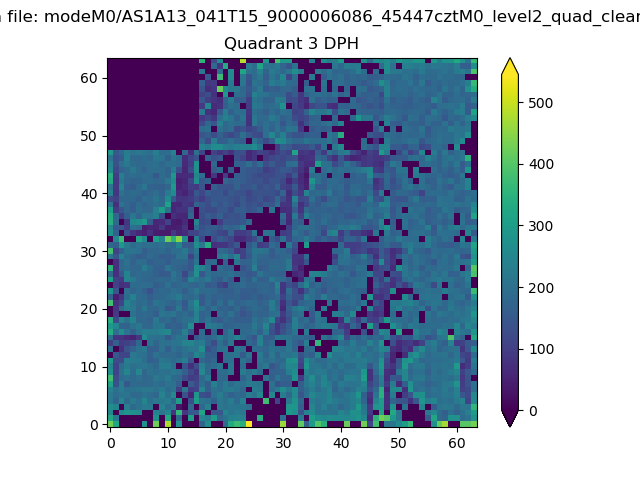 |
 |
Quadrant C |
| Plot type | Count rate plots | Images |
|---|---|---|
| Comparison with Poisson distribution Blue bars denote a histogram of data divided into 1 sec bins. Red curve is a Poisson curve with rate = median count rate of data. |
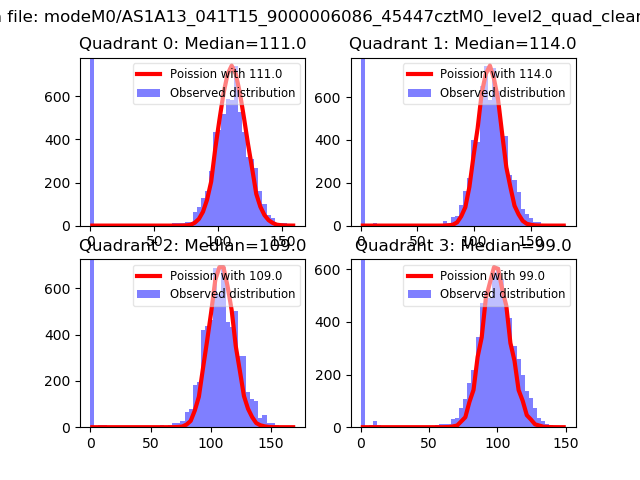 |
 |
| Quadrant-wise count rates Data is divided into 100 sec bins |
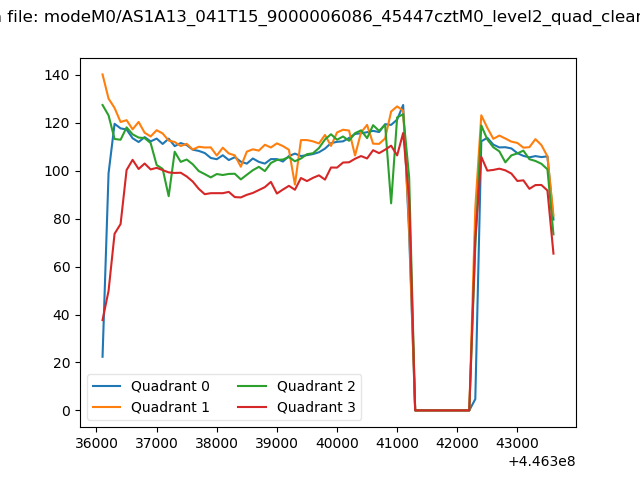 |
|
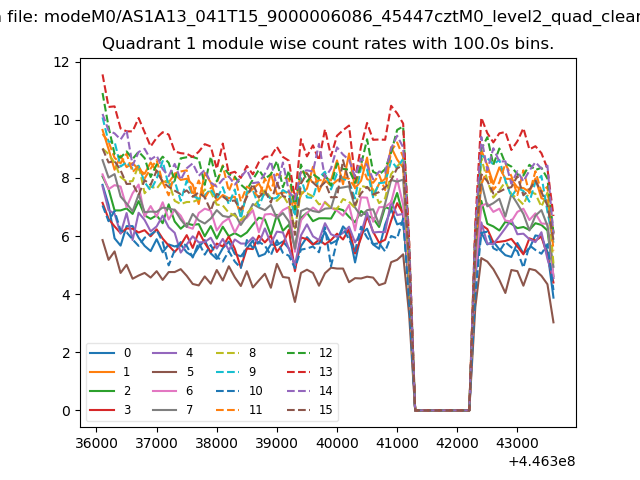
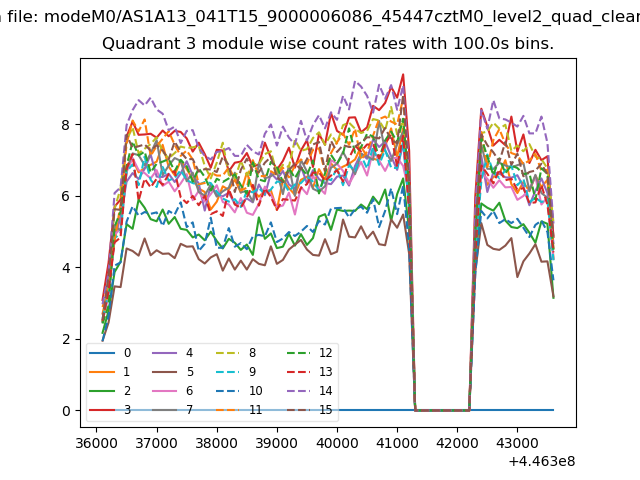
| Module-wise count rates for Quadrant A Data is divided into 100 sec bins |
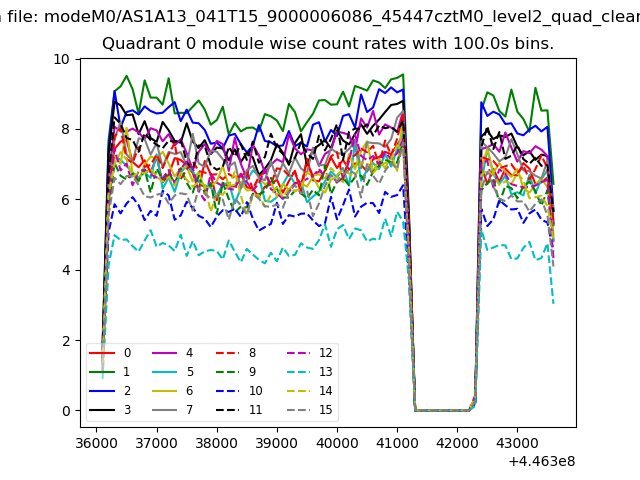 |
 |
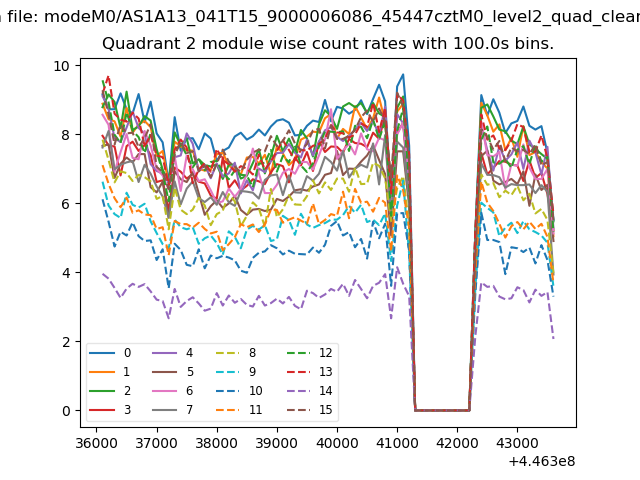
| Module-wise count rates for Quadrant B Data is divided into 100 sec bins |
 |
 |
| Module-wise count rates for Quadrant C Data is divided into 100 sec bins |
 |
 |
| Module-wise count rates for Quadrant D Data is divided into 100 sec bins |
 |
 |
| Parameter | Plot |
|---|---|
| CZT HV Monitor | 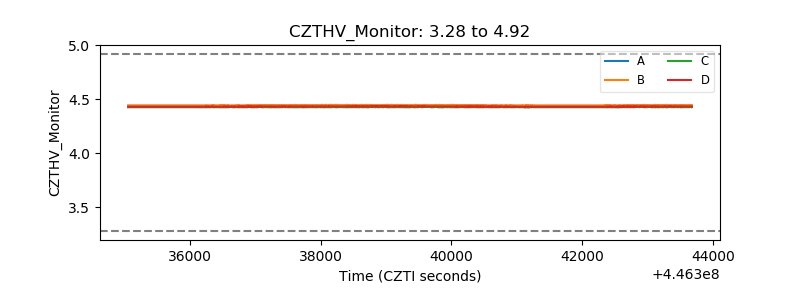 |
| D_VDD | 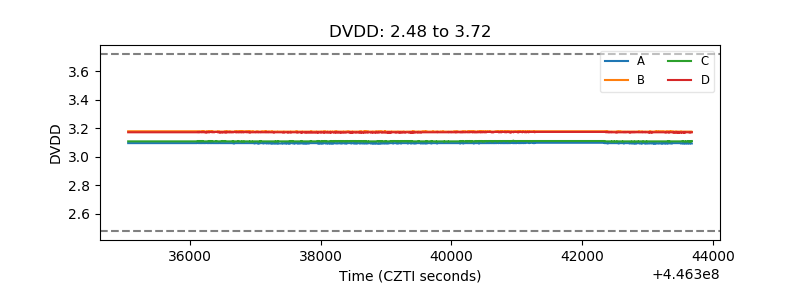 |
| Temperature 1 | 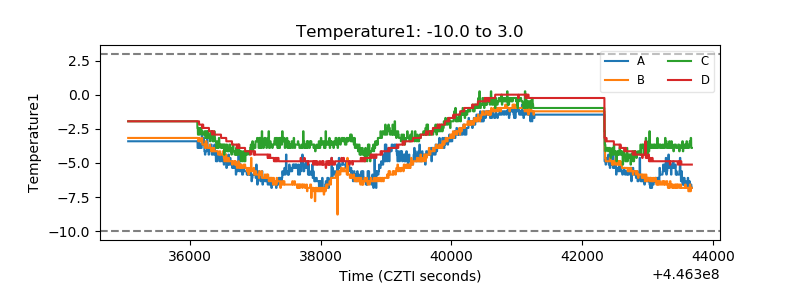 |
| Veto HV Monitor | 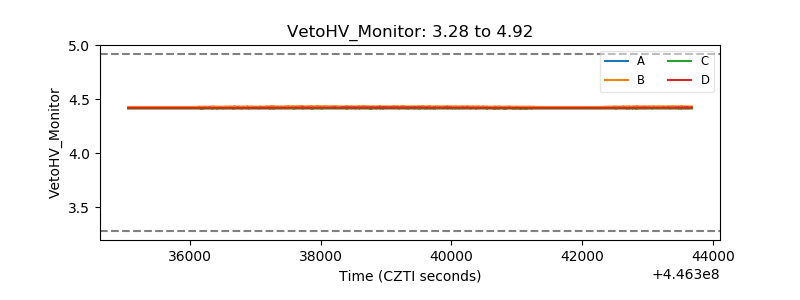 |
| Veto LLD | 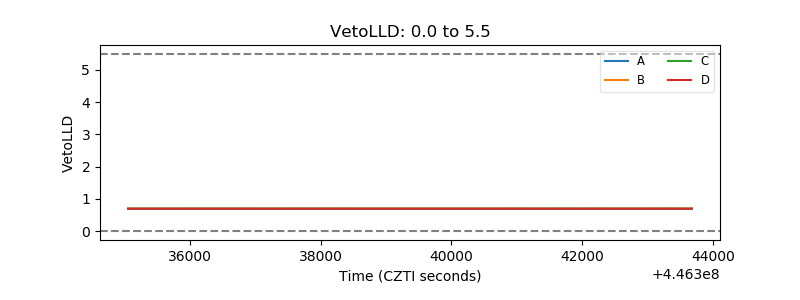 |
| Alpha Counter | 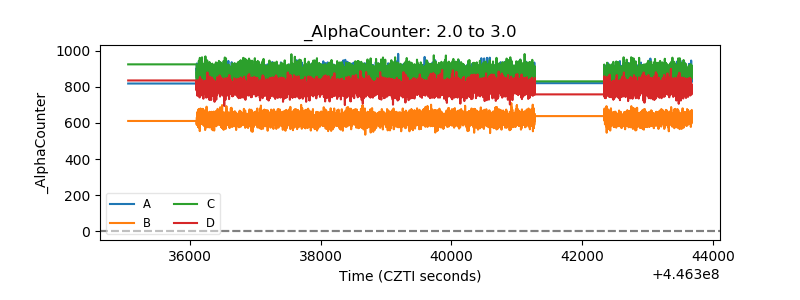 |
| _CPM_Rate | 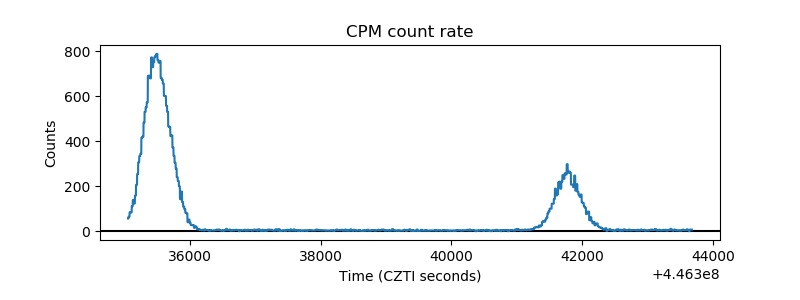 |
| CZT Counter | 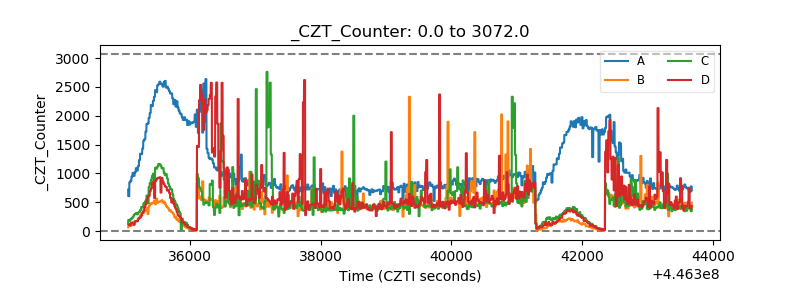 |
| +2.5 Volts monitor |  |
| +5 Volts monitor | 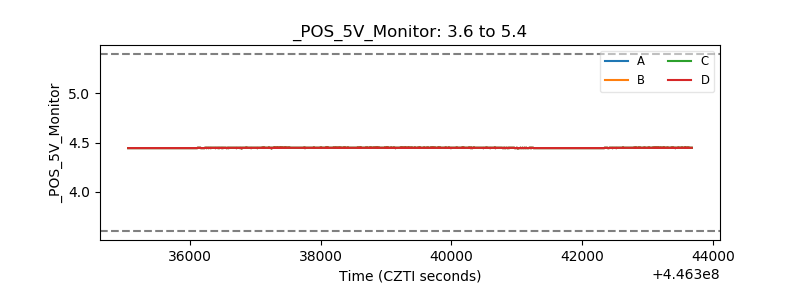 |
| _ROLL_ROT | 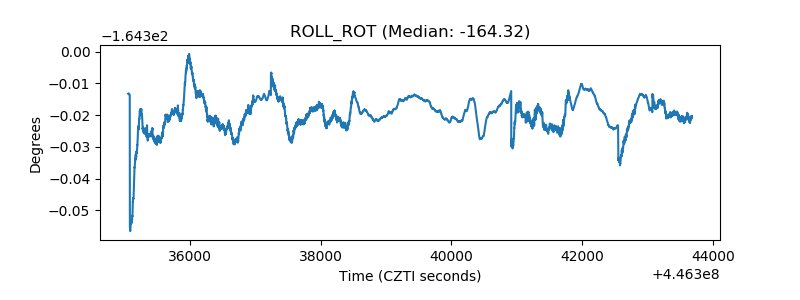 |
| _Roll_DEC | 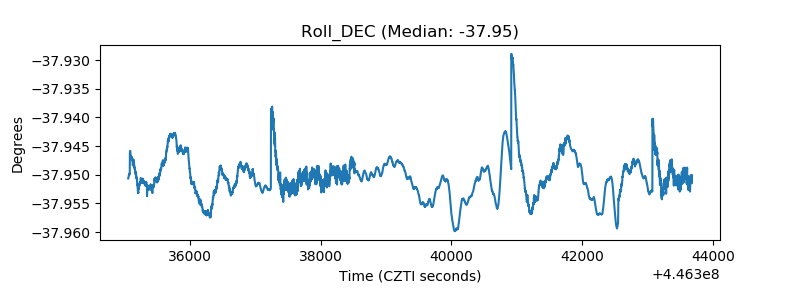 |
| _Roll_RA | 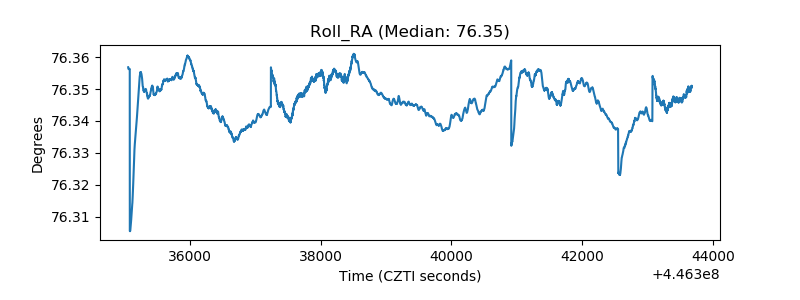 |
| Veto Counter | 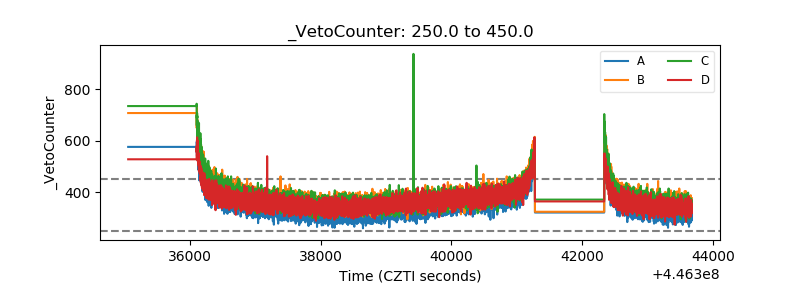 |