| Param | Original file | Final file |
|---|---|---|
| Filename | modeM0/AS1A13_041T15_9000006086_45448cztM0_level2.fits | modeM0/AS1A13_041T15_9000006086_45448cztM0_level2_quad_clean.evt |
| Size (bytes) | 500,676,480 | 116,349,120 |
| Size | 477.5 MB | 111.0 MB |
| Events in quadrant A | 6,281,188 | 759,761 |
| Events in quadrant B | 3,762,043 | 794,652 |
| Events in quadrant C | 3,501,328 | 769,189 |
| Events in quadrant D | 4,421,701 | 690,209 |
| Mode M9 | |||
|---|---|---|---|
| Quadrant | BADHDUFLAG | Total packets | Discarded packets |
| A | 0 | 17 | 0 |
| B | 0 | 17 | 0 |
| C | 0 | 17 | 0 |
| D | 0 | 17 | 0 |
| Mode M0 | |||
|---|---|---|---|
| Quadrant | BADHDUFLAG | Total packets | Discarded packets |
| A | 0 | 23890 | 2 |
| B | 0 | 16169 | 2 |
| C | 0 | 15809 | 2 |
| D | 0 | 18274 | 2 |
| Mode SS | |||
|---|---|---|---|
| Quadrant | BADHDUFLAG | Total packets | Discarded packets |
| A | 0 | 152 | 0 |
| B | 0 | 152 | 0 |
| C | 0 | 152 | 0 |
| D | 0 | 152 | 0 |
| Quadrant | Total seconds | Saturated seconds | Saturation percentage |
|---|---|---|---|
| A | 7307 | 265 | 3.626659% |
| B | 7307 | 171 | 2.340222% |
| C | 7307 | 93 | 1.272752% |
| D | 7307 | 166 | 2.271794% |
Noise dominated data is calculated using 1-second bins in cleaned event files. If a bin has >2000 counts, and if more than 50% of those come from <1% of pixels, then it is considered to be noise-dominated and hence unusable.
| Quadrant | # 1 sec bins | Bins with >0 counts | Bins with >2000 counts | High rate bins dominated by noise | Noise dominated (total time) | Noise dominated (detector-on time) | Marked lightcurve |
|---|---|---|---|---|---|---|---|
| A | 9047 | 7310 | 46 | 46 | 0.51% | 0.63% | 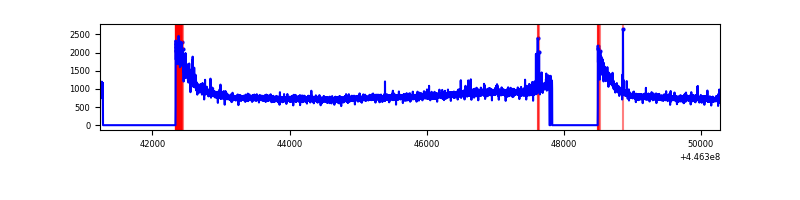 |
| B | 9047 | 7310 | 49 | 49 | 0.54% | 0.67% | 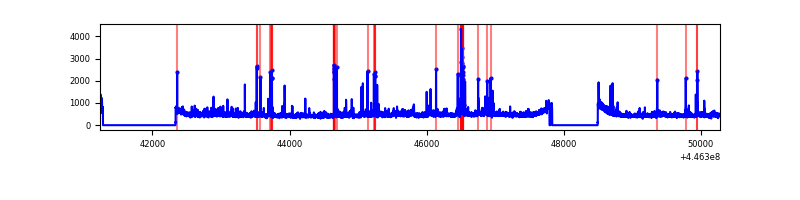 |
| C | 9047 | 7310 | 37 | 37 | 0.41% | 0.51% | 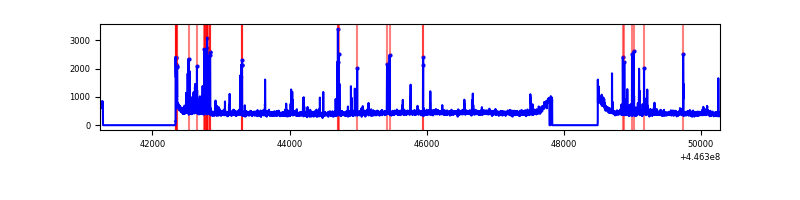 |
| D | 9047 | 7310 | 101 | 101 | 1.12% | 1.38% | 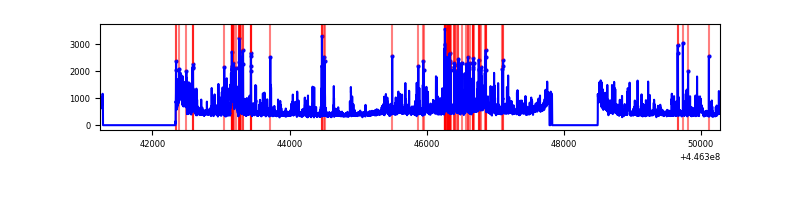 |
Top three noisy pixels from each quadrant. If the there are fewer than three noisy pixels in the level2.evt file, extra rows are filled as -1
| Pixel properties | Quadrant properties | ||||||
|---|---|---|---|---|---|---|---|
| Quadrant | DetID | PixID | Counts | Sigma | Mean | Median | Sigma |
| A | 10 | 83 | 3031047 | 17977.97 | 808 | 792 | 168.6 |
| A | 13 | 248 | 49077 | 286.47 | 808 | 792 | 168.6 |
| A | 0 | 243 | 46686 | 272.28 | 808 | 792 | 168.6 |
| B | 0 | 171 | 161712 | 986.46 | 819 | 794 | 163.1 |
| B | 5 | 172 | 133537 | 813.74 | 819 | 794 | 163.1 |
| B | 0 | 186 | 108505 | 660.29 | 819 | 794 | 163.1 |
| C | 14 | 96 | 158378 | 829.18 | 806 | 809 | 190.0 |
| C | 12 | 2 | 85660 | 446.51 | 806 | 809 | 190.0 |
| C | 14 | 254 | 59568 | 309.21 | 806 | 809 | 190.0 |
| D | 11 | 241 | 484695 | 2418.14 | 799 | 775 | 200.1 |
| D | 1 | 52 | 301865 | 1504.54 | 799 | 775 | 200.1 |
| D | 4 | 222 | 200655 | 998.8 | 799 | 775 | 200.1 |
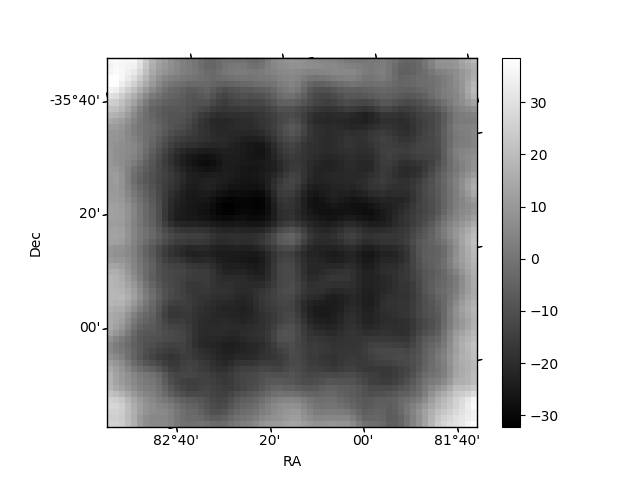
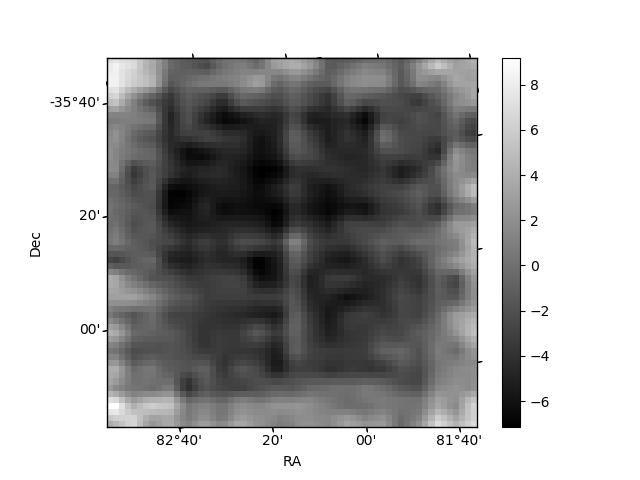
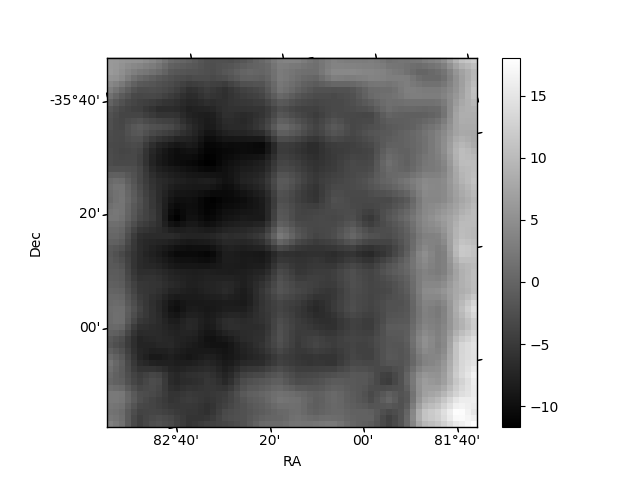
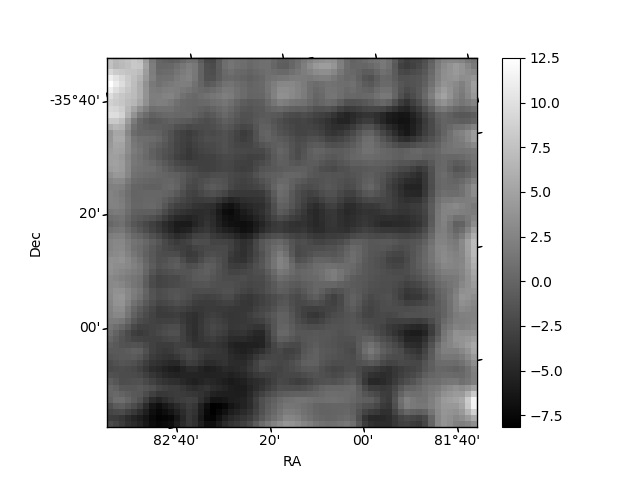
Histogram calculated using DETX and DETY for each event in the final _common_clean file
| Quadrant A | 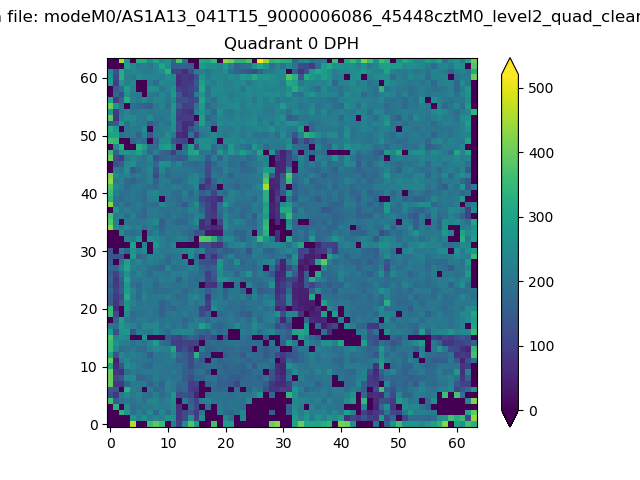 |
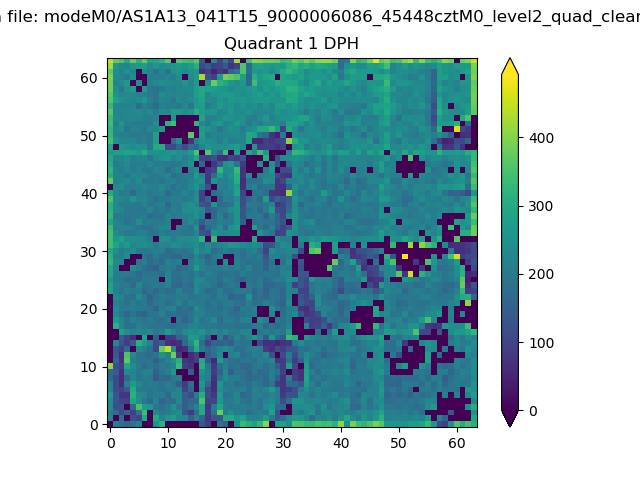 |
Quadrant B |
|---|---|---|---|
| Quadrant D | 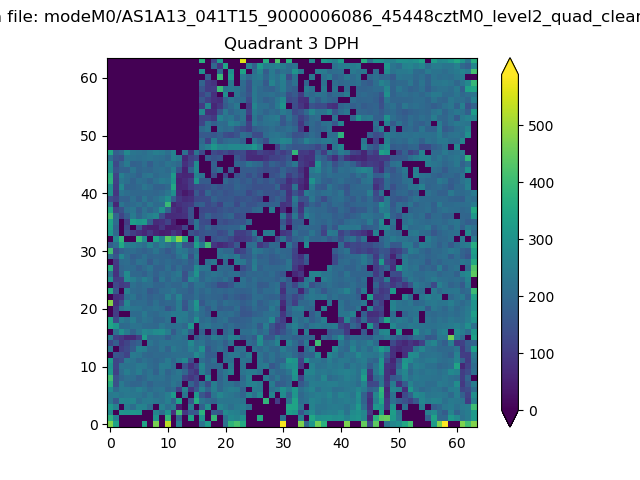 |
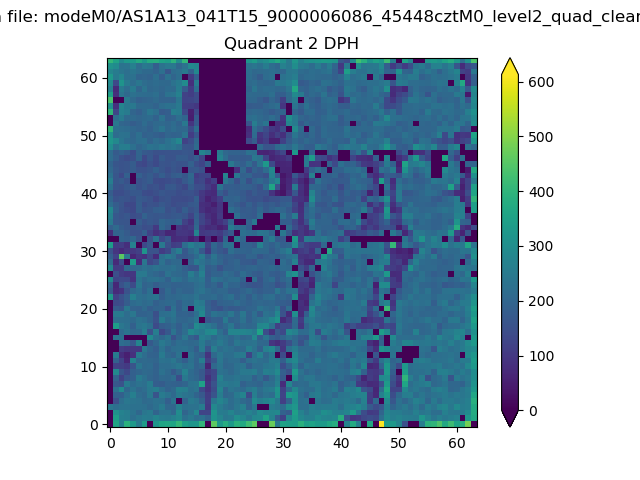 |
Quadrant C |
| Plot type | Count rate plots | Images |
|---|---|---|
| Comparison with Poisson distribution Blue bars denote a histogram of data divided into 1 sec bins. Red curve is a Poisson curve with rate = median count rate of data. |
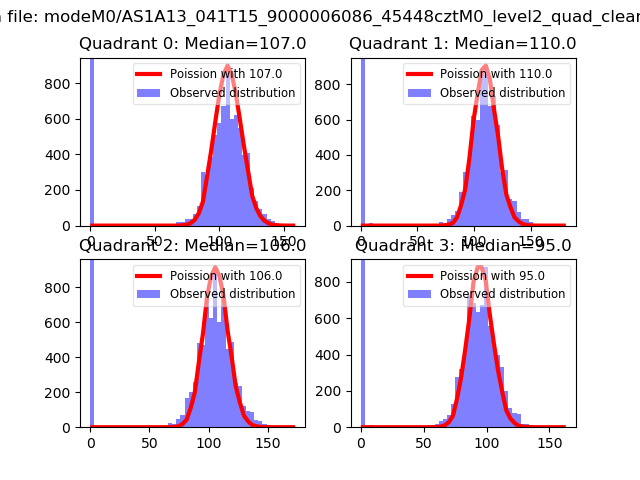 |
 |
| Quadrant-wise count rates Data is divided into 100 sec bins |
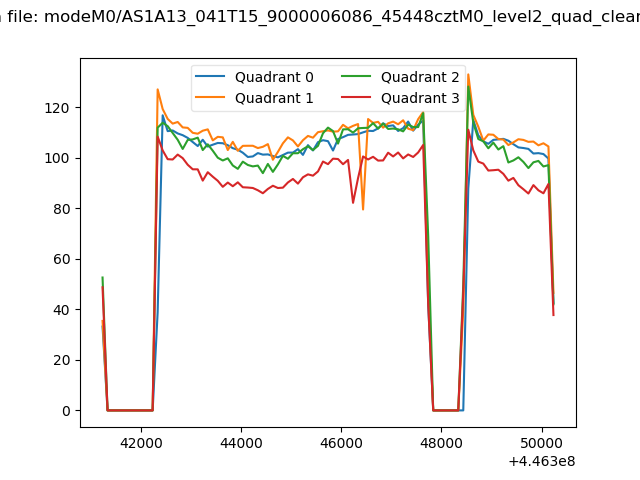 |
|
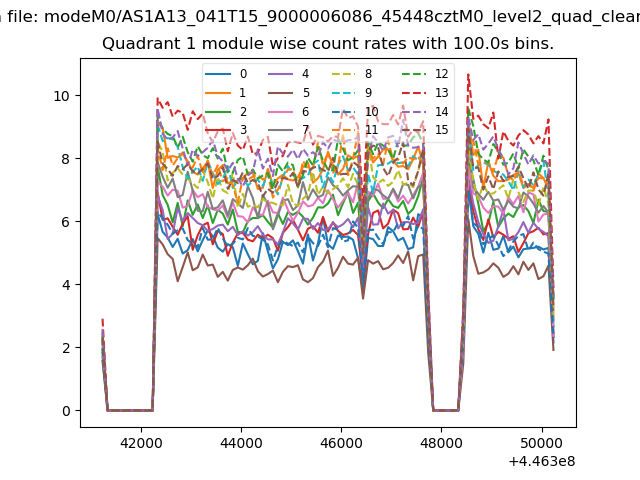
| Module-wise count rates for Quadrant A Data is divided into 100 sec bins |
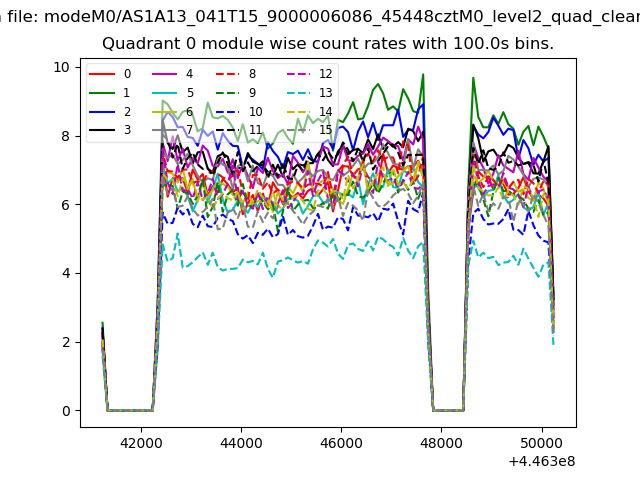 |
 |
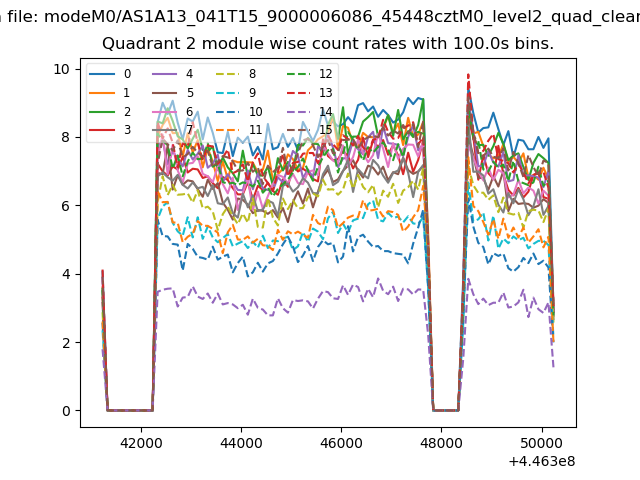
| Module-wise count rates for Quadrant B Data is divided into 100 sec bins |
 |
 |
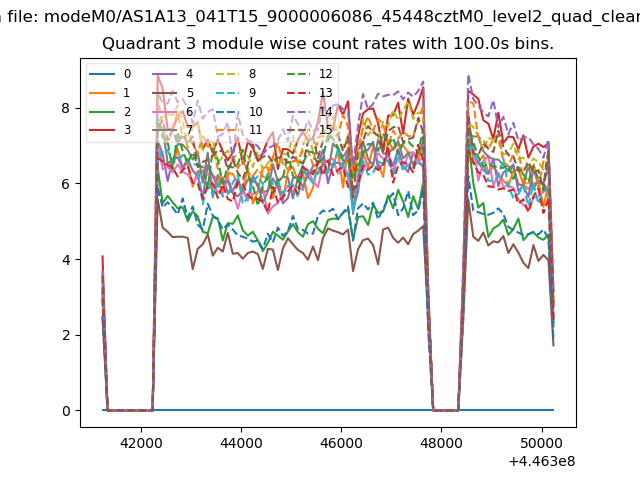
| Module-wise count rates for Quadrant C Data is divided into 100 sec bins |
 |
 |
| Module-wise count rates for Quadrant D Data is divided into 100 sec bins |
 |
 |
| Parameter | Plot |
|---|---|
| CZT HV Monitor | 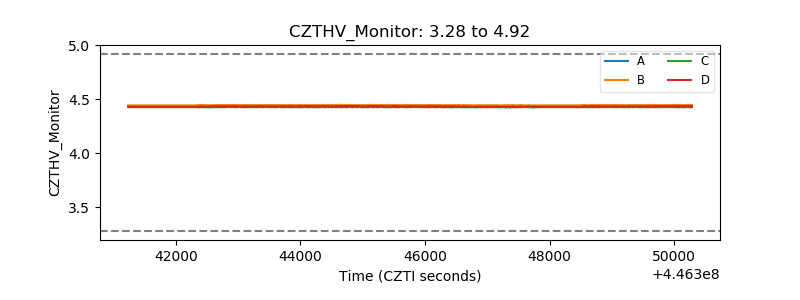 |
| D_VDD | 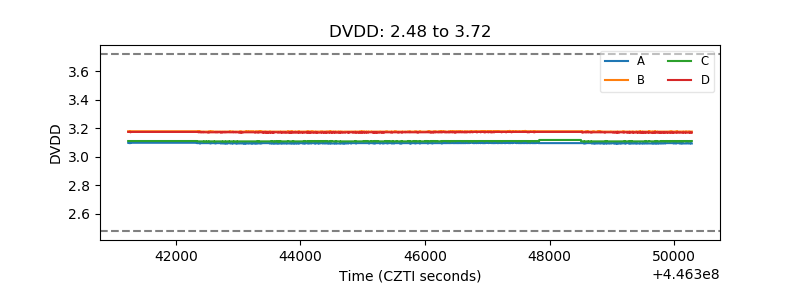 |
| Temperature 1 | 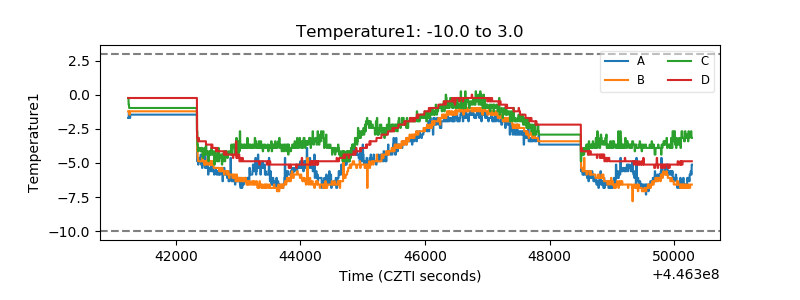 |
| Veto HV Monitor |  |
| Veto LLD | 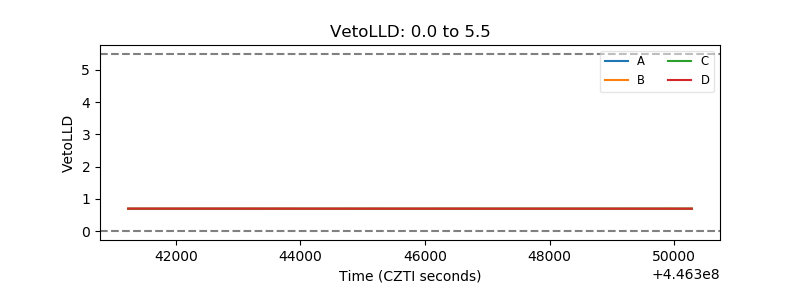 |
| Alpha Counter | 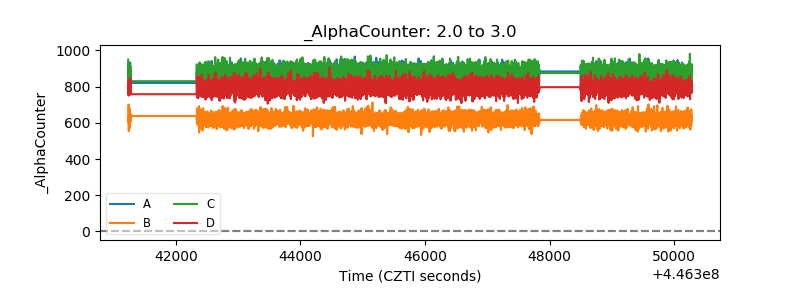 |
| _CPM_Rate | 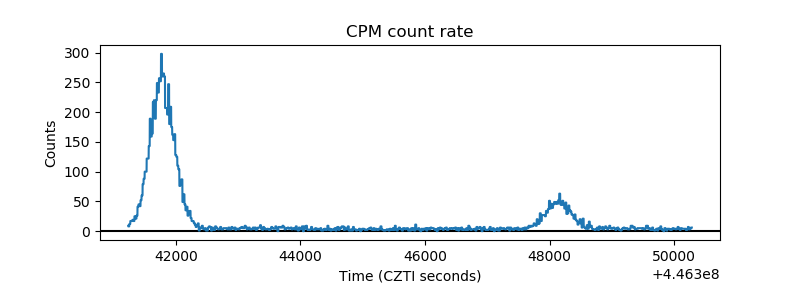 |
| CZT Counter | 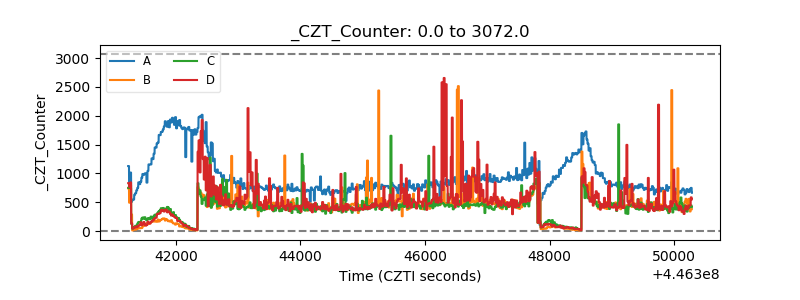 |
| +2.5 Volts monitor | 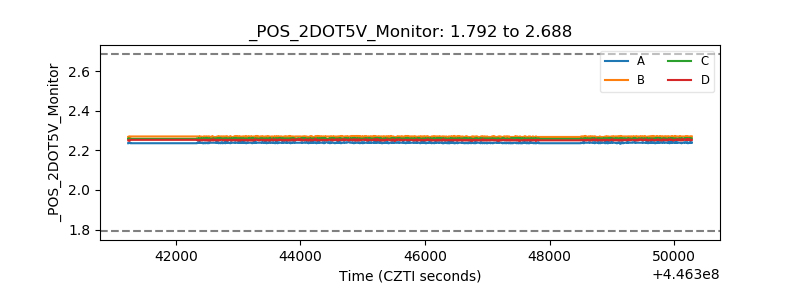 |
| +5 Volts monitor |  |
| _ROLL_ROT | 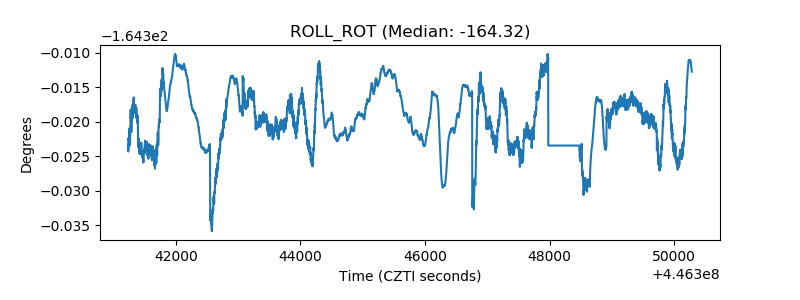 |
| _Roll_DEC | 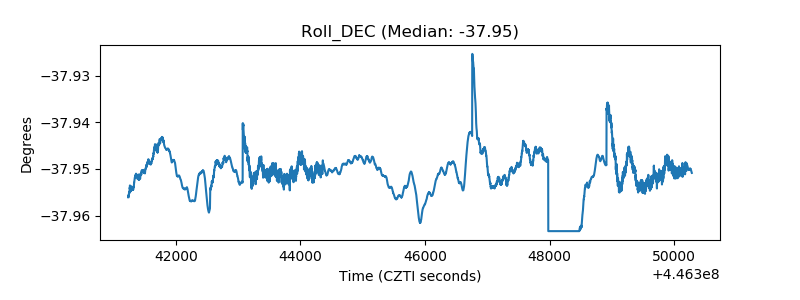 |
| _Roll_RA | 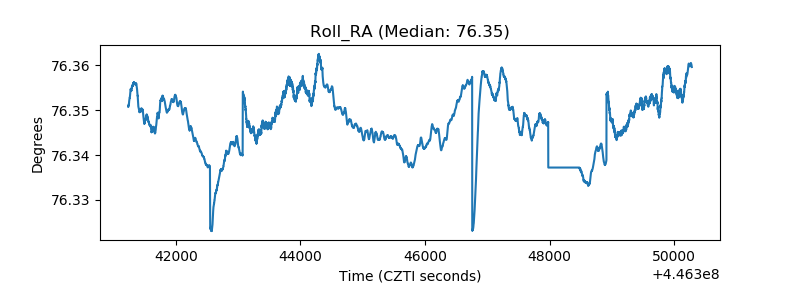 |
| Veto Counter | 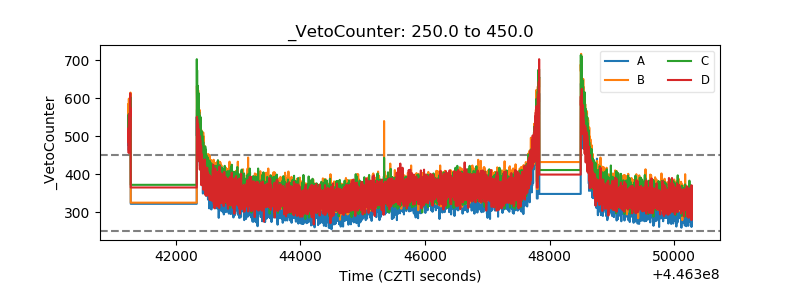 |