| Param | Original file | Final file |
|---|---|---|
| Filename | modeM0/AS1A13_041T15_9000006086_45449cztM0_level2.fits | modeM0/AS1A13_041T15_9000006086_45449cztM0_level2_quad_clean.evt |
| Size (bytes) | 536,544,000 | 121,213,440 |
| Size | 511.7 MB | 115.6 MB |
| Events in quadrant A | 6,429,066 | 797,071 |
| Events in quadrant B | 4,000,663 | 828,533 |
| Events in quadrant C | 3,653,616 | 799,709 |
| Events in quadrant D | 5,180,676 | 709,808 |
| Mode M9 | |||
|---|---|---|---|
| Quadrant | BADHDUFLAG | Total packets | Discarded packets |
| A | 0 | 2 | 0 |
| B | 0 | 2 | 0 |
| C | 0 | 2 | 0 |
| D | 0 | 2 | 0 |
| Mode M0 | |||
|---|---|---|---|
| Quadrant | BADHDUFLAG | Total packets | Discarded packets |
| A | 0 | 24501 | 3 |
| B | 0 | 17084 | 2 |
| C | 0 | 16582 | 2 |
| D | 0 | 20778 | 2 |
| Mode SS | |||
|---|---|---|---|
| Quadrant | BADHDUFLAG | Total packets | Discarded packets |
| A | 0 | 154 | 0 |
| B | 0 | 154 | 0 |
| C | 0 | 154 | 0 |
| D | 0 | 154 | 0 |
| Quadrant | Total seconds | Saturated seconds | Saturation percentage |
|---|---|---|---|
| A | 7694 | 296 | 3.847154% |
| B | 7695 | 230 | 2.988954% |
| C | 7695 | 134 | 1.741391% |
| D | 7695 | 353 | 4.587394% |
Noise dominated data is calculated using 1-second bins in cleaned event files. If a bin has >2000 counts, and if more than 50% of those come from <1% of pixels, then it is considered to be noise-dominated and hence unusable.
| Quadrant | # 1 sec bins | Bins with >0 counts | Bins with >2000 counts | High rate bins dominated by noise | Noise dominated (total time) | Noise dominated (detector-on time) | Marked lightcurve |
|---|---|---|---|---|---|---|---|
| A | 7849 | 7695 | 27 | 27 | 0.34% | 0.35% | 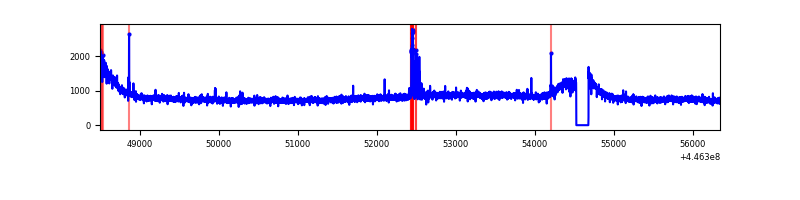 |
| B | 7850 | 7696 | 25 | 25 | 0.32% | 0.32% | 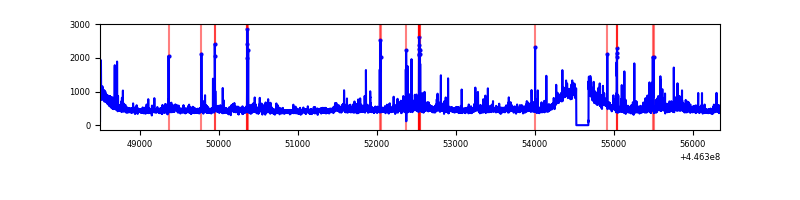 |
| C | 7850 | 7696 | 17 | 17 | 0.22% | 0.22% |  |
| D | 7850 | 7696 | 195 | 195 | 2.48% | 2.53% | 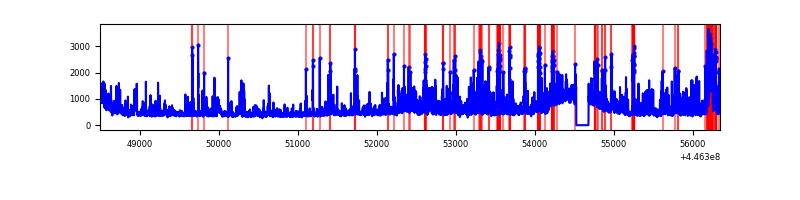 |
Top three noisy pixels from each quadrant. If the there are fewer than three noisy pixels in the level2.evt file, extra rows are filled as -1
| Pixel properties | Quadrant properties | ||||||
|---|---|---|---|---|---|---|---|
| Quadrant | DetID | PixID | Counts | Sigma | Mean | Median | Sigma |
| A | 10 | 83 | 2931223 | 16086.7 | 873 | 852 | 182.2 |
| A | 13 | 248 | 82062 | 445.81 | 873 | 852 | 182.2 |
| A | 0 | 243 | 20910 | 110.11 | 873 | 852 | 182.2 |
| B | 0 | 171 | 163169 | 913.64 | 883 | 854 | 177.7 |
| B | 5 | 172 | 104297 | 582.26 | 883 | 854 | 177.7 |
| B | 0 | 199 | 51243 | 283.63 | 883 | 854 | 177.7 |
| C | 12 | 2 | 129116 | 611.94 | 875 | 879 | 209.6 |
| C | 14 | 96 | 52613 | 246.87 | 875 | 879 | 209.6 |
| C | 1 | 3 | 23601 | 108.43 | 875 | 879 | 209.6 |
| D | 11 | 241 | 653797 | 2977.33 | 859 | 833 | 219.3 |
| D | 1 | 52 | 350191 | 1592.98 | 859 | 833 | 219.3 |
| D | 2 | 249 | 331914 | 1509.64 | 859 | 833 | 219.3 |
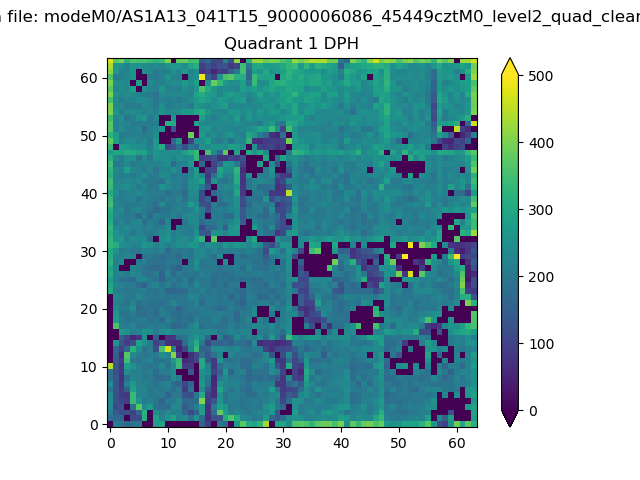
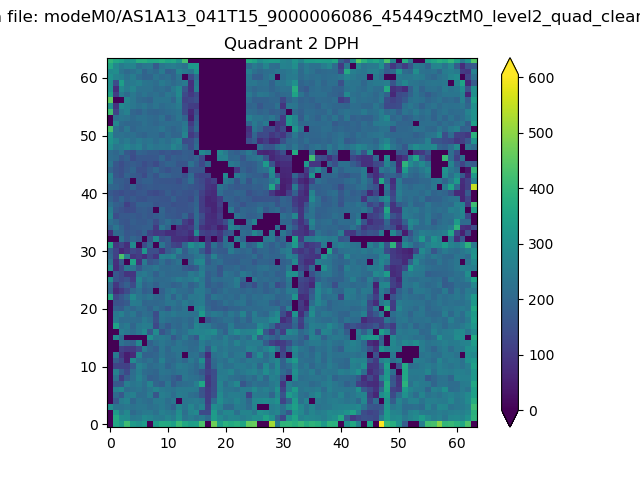
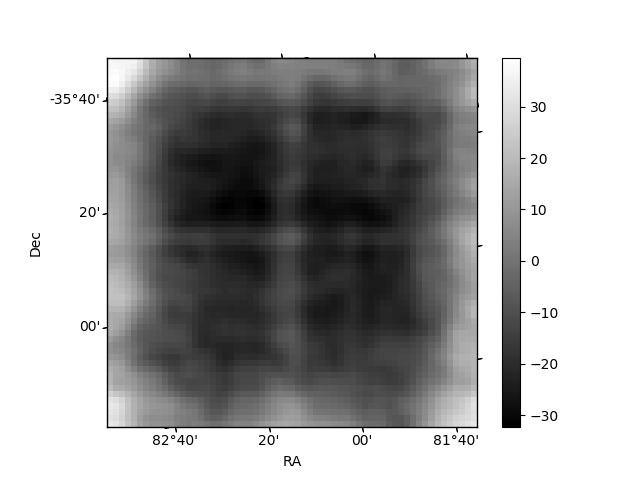
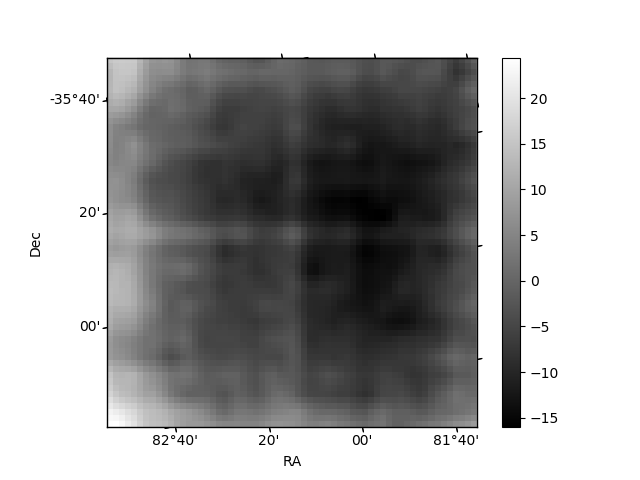
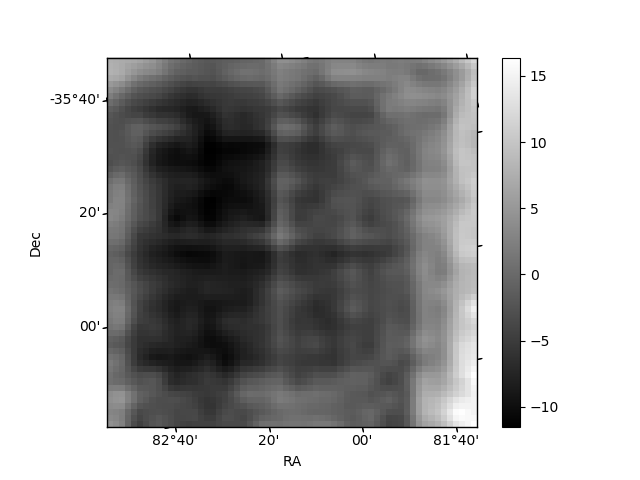
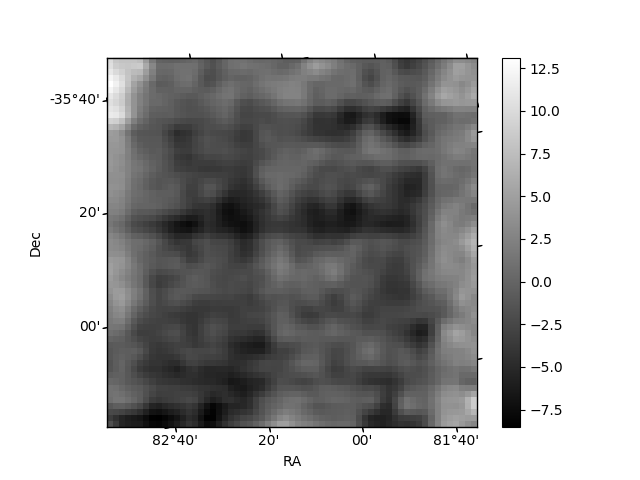
Histogram calculated using DETX and DETY for each event in the final _common_clean file
| Quadrant A | 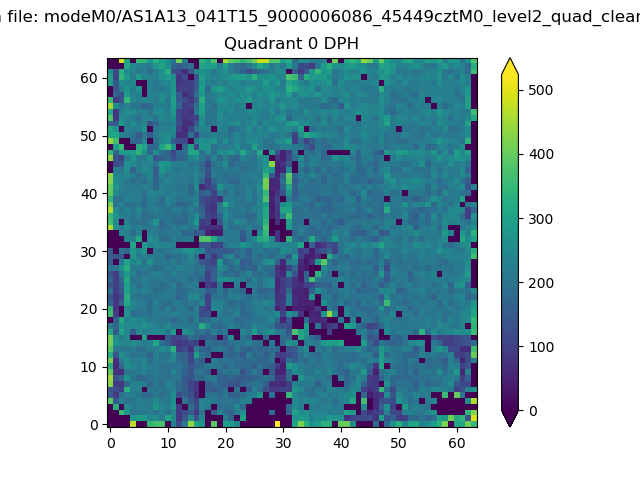 |
 |
Quadrant B |
|---|---|---|---|
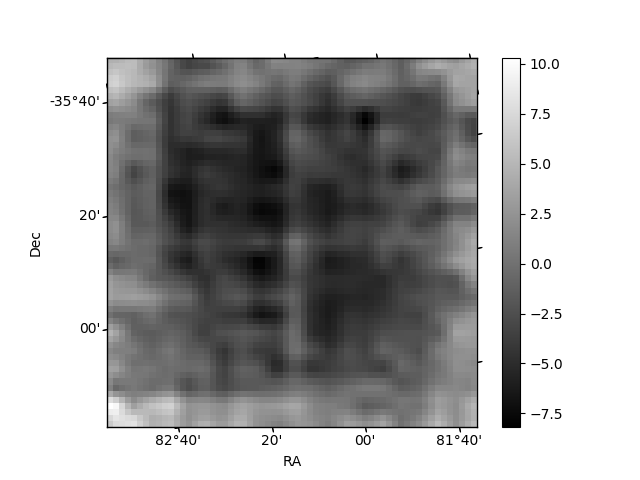
| Quadrant D | 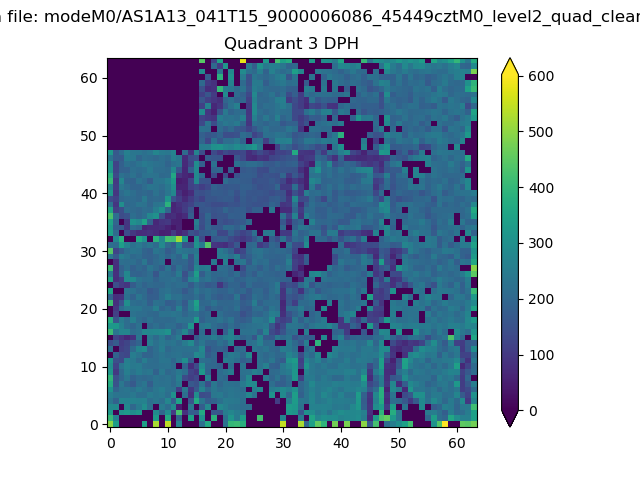 |
 |
Quadrant C |
| Plot type | Count rate plots | Images |
|---|---|---|
| Comparison with Poisson distribution Blue bars denote a histogram of data divided into 1 sec bins. Red curve is a Poisson curve with rate = median count rate of data. |
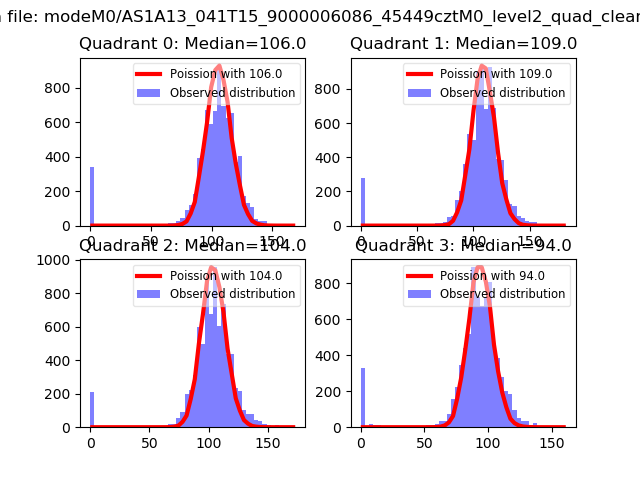 |
 |
| Quadrant-wise count rates Data is divided into 100 sec bins |
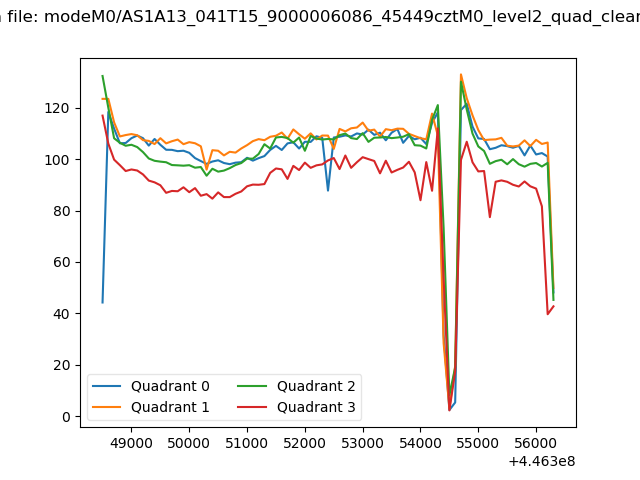 |
|
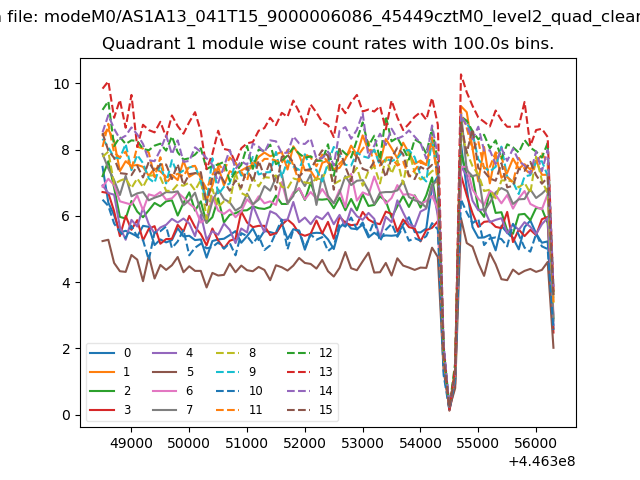
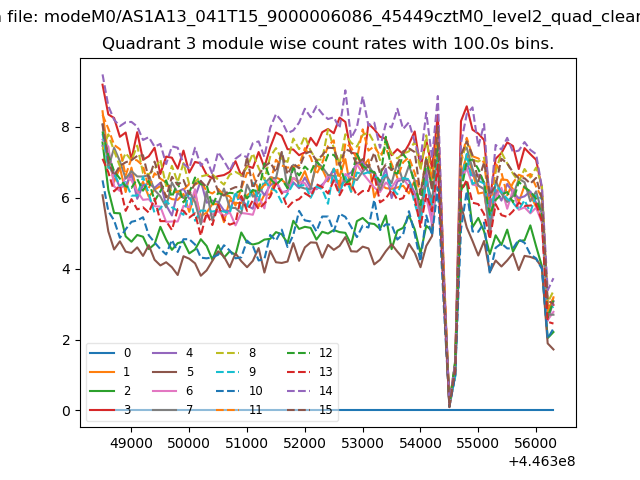
| Module-wise count rates for Quadrant A Data is divided into 100 sec bins |
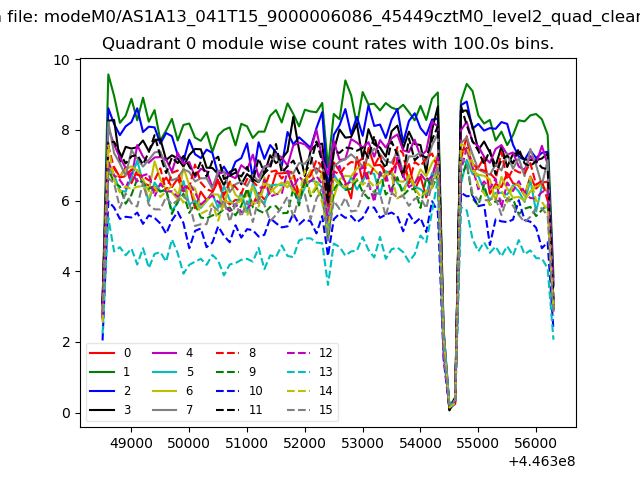 |
 |
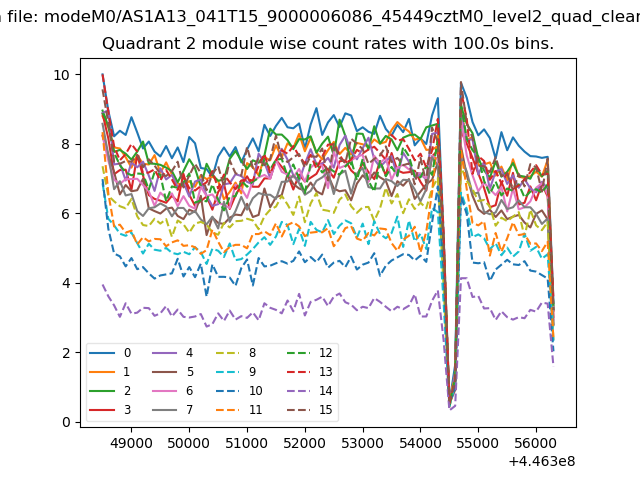
| Module-wise count rates for Quadrant B Data is divided into 100 sec bins |
 |
 |
| Module-wise count rates for Quadrant C Data is divided into 100 sec bins |
 |
 |
| Module-wise count rates for Quadrant D Data is divided into 100 sec bins |
 |
 |
| Parameter | Plot |
|---|---|
| CZT HV Monitor |  |
| D_VDD | 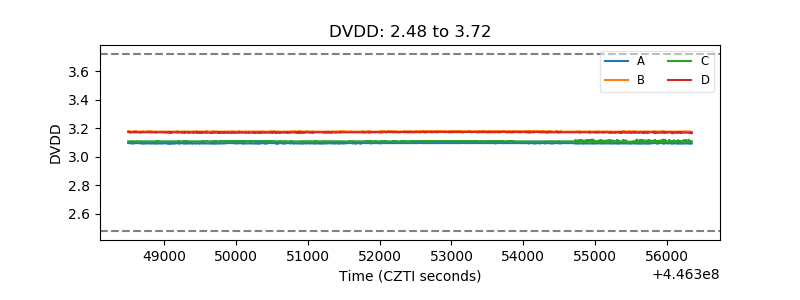 |
| Temperature 1 | 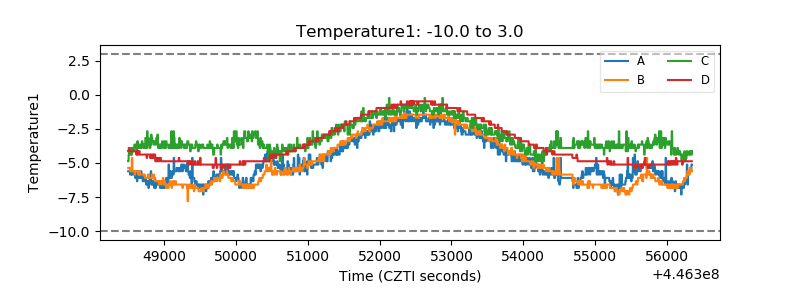 |
| Veto HV Monitor | 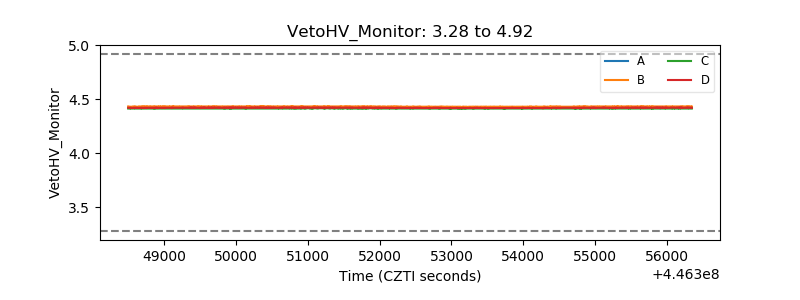 |
| Veto LLD | 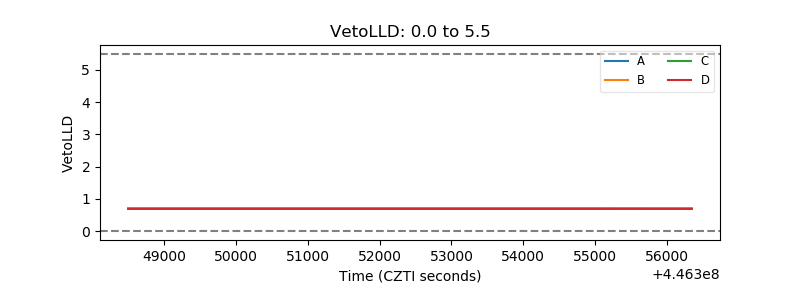 |
| Alpha Counter | 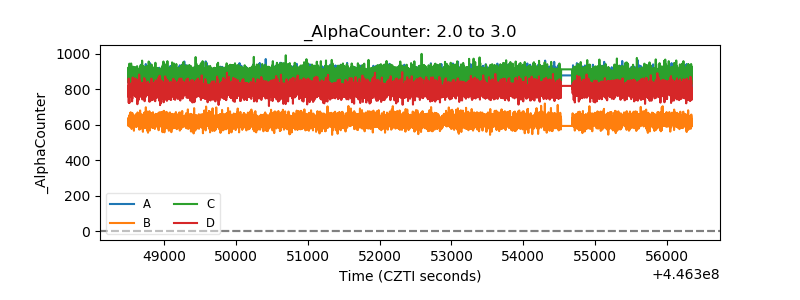 |
| _CPM_Rate | 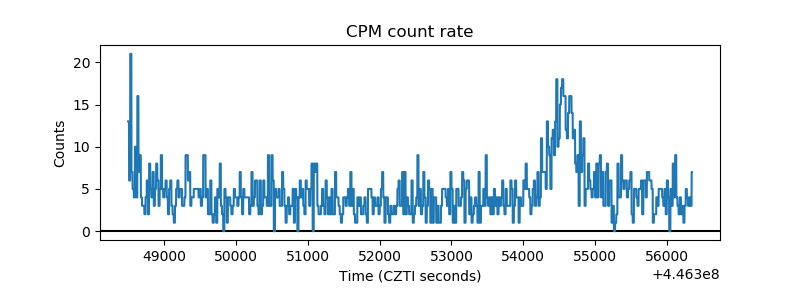 |
| CZT Counter | 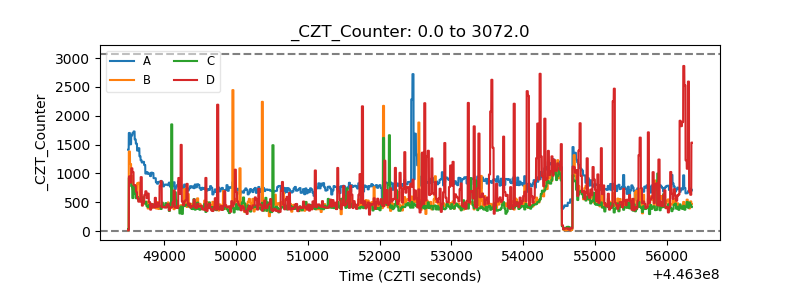 |
| +2.5 Volts monitor | 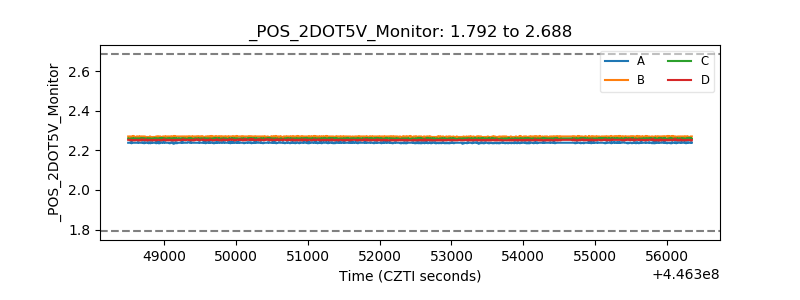 |
| +5 Volts monitor | 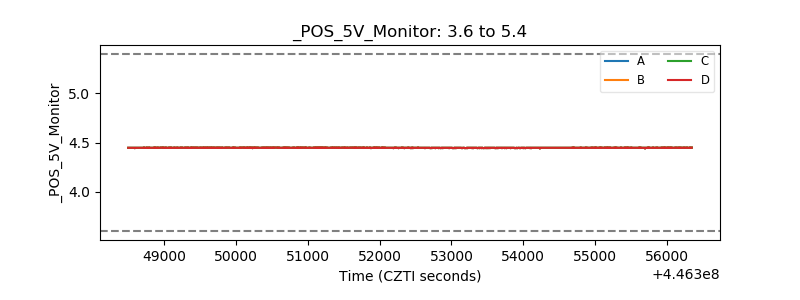 |
| _ROLL_ROT | 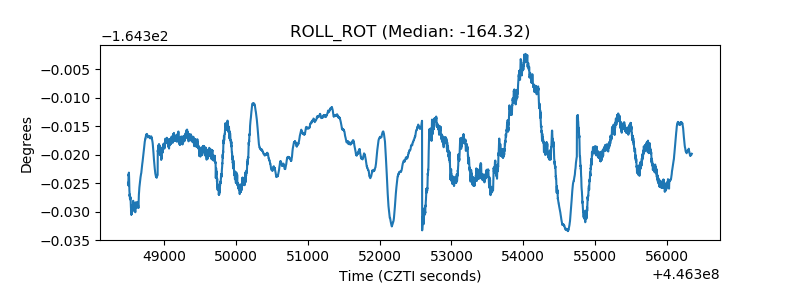 |
| _Roll_DEC | 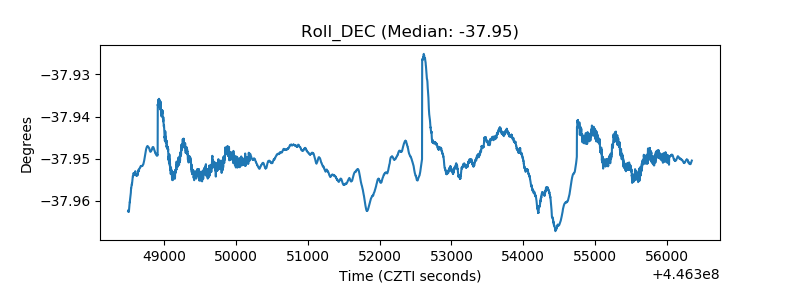 |
| _Roll_RA | 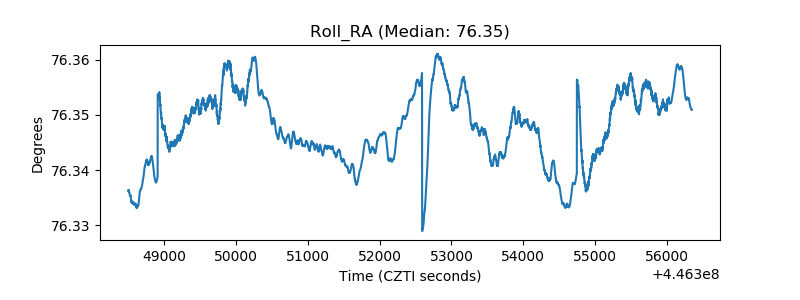 |
| Veto Counter | 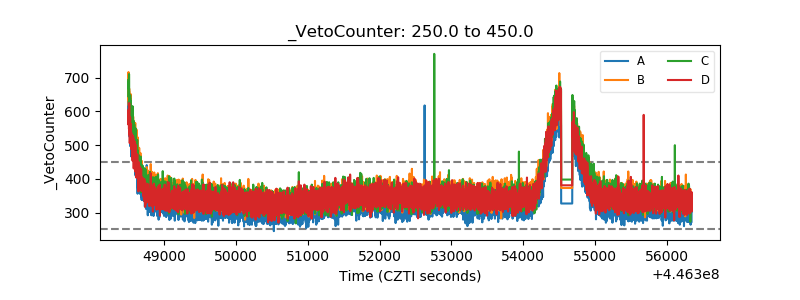 |