| Param | Original file | Final file |
|---|---|---|
| Filename | modeM0/AS1A13_041T15_9000006086_45450cztM0_level2.fits | modeM0/AS1A13_041T15_9000006086_45450cztM0_level2_quad_clean.evt |
| Size (bytes) | 524,773,440 | 120,277,440 |
| Size | 500.5 MB | 114.7 MB |
| Events in quadrant A | 6,073,710 | 802,440 |
| Events in quadrant B | 3,752,101 | 825,816 |
| Events in quadrant C | 3,534,873 | 790,458 |
| Events in quadrant D | 5,474,411 | 693,649 |
| Mode M0 | |||
|---|---|---|---|
| Quadrant | BADHDUFLAG | Total packets | Discarded packets |
| A | 0 | 23298 | 0 |
| B | 0 | 16354 | 0 |
| C | 0 | 16203 | 0 |
| D | 0 | 21441 | 0 |
| Mode SS | |||
|---|---|---|---|
| Quadrant | BADHDUFLAG | Total packets | Discarded packets |
| A | 0 | 152 | 0 |
| B | 0 | 152 | 0 |
| C | 0 | 152 | 0 |
| D | 0 | 152 | 0 |
| Quadrant | Total seconds | Saturated seconds | Saturation percentage |
|---|---|---|---|
| A | 7610 | 52 | 0.683311% |
| B | 7611 | 57 | 0.748916% |
| C | 7611 | 28 | 0.367889% |
| D | 7611 | 369 | 4.848246% |
Noise dominated data is calculated using 1-second bins in cleaned event files. If a bin has >2000 counts, and if more than 50% of those come from <1% of pixels, then it is considered to be noise-dominated and hence unusable.
| Quadrant | # 1 sec bins | Bins with >0 counts | Bins with >2000 counts | High rate bins dominated by noise | Noise dominated (total time) | Noise dominated (detector-on time) | Marked lightcurve |
|---|---|---|---|---|---|---|---|
| A | 7610 | 7610 | 0 | 0 | 0.00% | 0.00% | 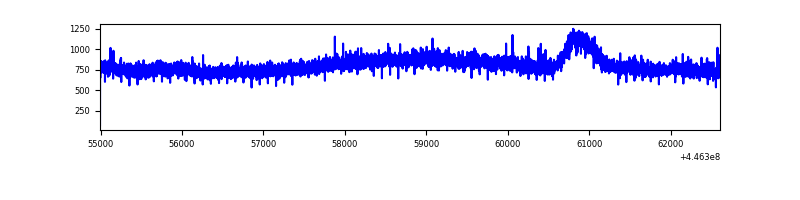 |
| B | 7611 | 7611 | 11 | 11 | 0.14% | 0.14% | 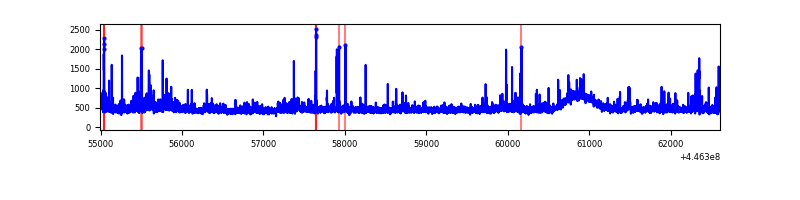 |
| C | 7611 | 7611 | 9 | 9 | 0.12% | 0.12% |  |
| D | 7611 | 7611 | 302 | 302 | 3.97% | 3.97% | 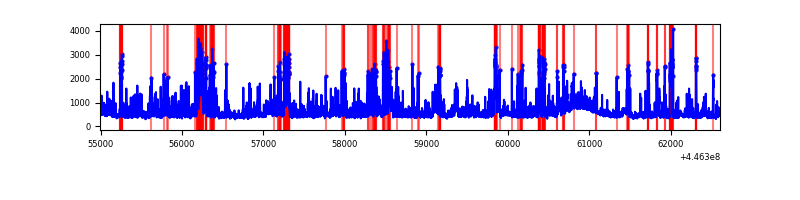 |
Top three noisy pixels from each quadrant. If the there are fewer than three noisy pixels in the level2.evt file, extra rows are filled as -1
| Pixel properties | Quadrant properties | ||||||
|---|---|---|---|---|---|---|---|
| Quadrant | DetID | PixID | Counts | Sigma | Mean | Median | Sigma |
| A | 10 | 83 | 2769979 | 15585.54 | 849 | 830 | 177.7 |
| A | 9 | 191 | 11029 | 57.4 | 849 | 830 | 177.7 |
| A | 0 | 243 | 10191 | 52.69 | 849 | 830 | 177.7 |
| B | 0 | 171 | 119293 | 696.73 | 853 | 826 | 170.0 |
| B | 5 | 172 | 94583 | 551.4 | 853 | 826 | 170.0 |
| B | 10 | 3 | 32152 | 184.23 | 853 | 826 | 170.0 |
| C | 0 | 239 | 167553 | 832.55 | 840 | 842 | 200.2 |
| C | 14 | 96 | 46166 | 226.35 | 840 | 842 | 200.2 |
| C | 14 | 254 | 14827 | 69.84 | 840 | 842 | 200.2 |
| D | 1 | 52 | 664159 | 3151.38 | 819 | 792 | 210.5 |
| D | 11 | 241 | 376447 | 1784.58 | 819 | 792 | 210.5 |
| D | 13 | 249 | 375796 | 1781.49 | 819 | 792 | 210.5 |
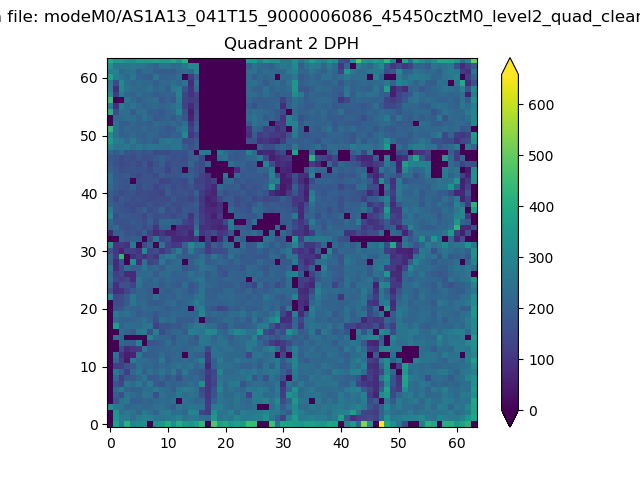
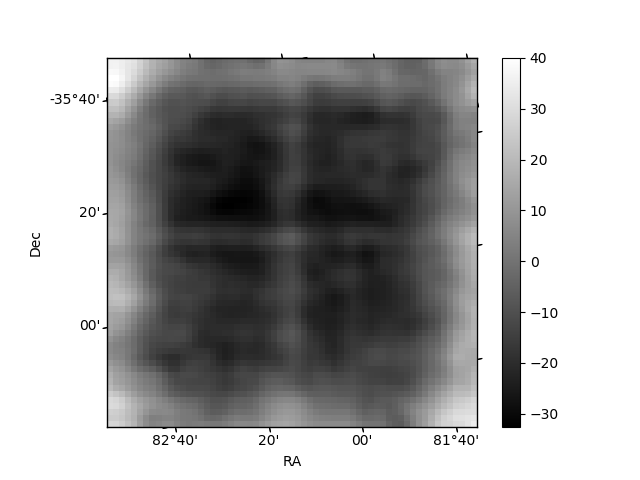
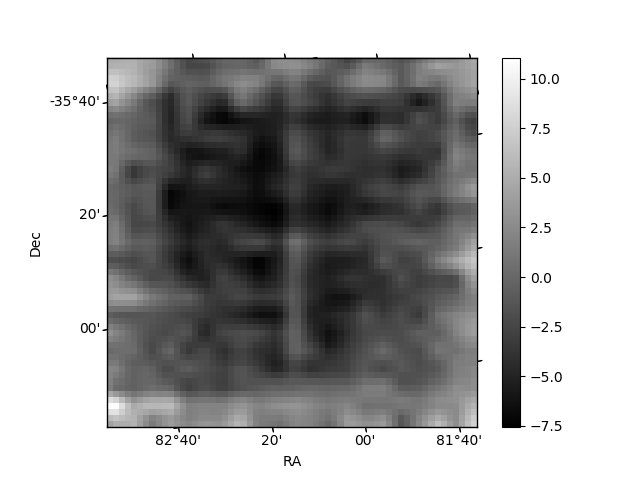
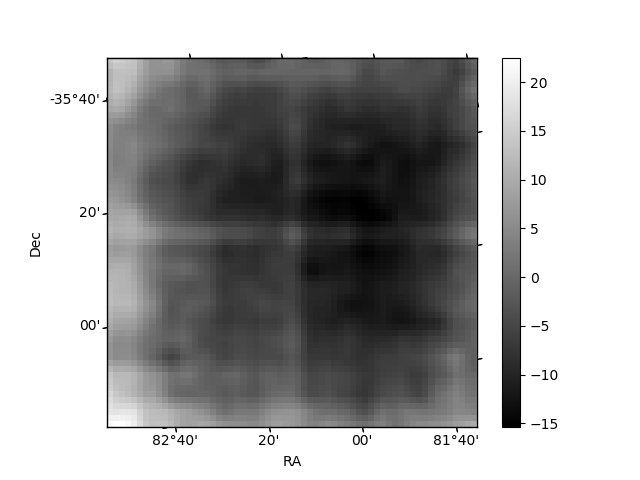
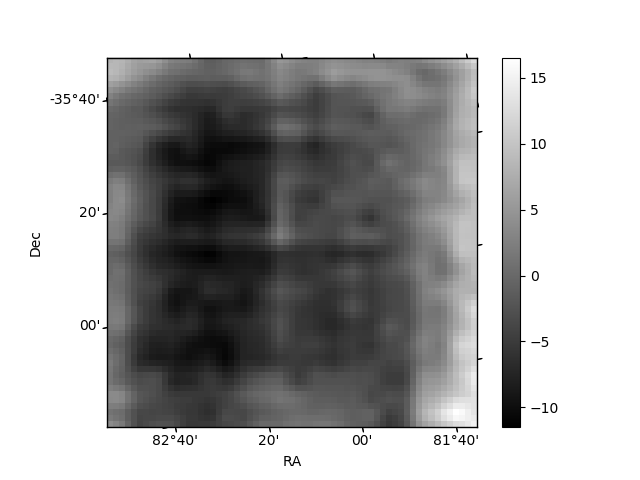
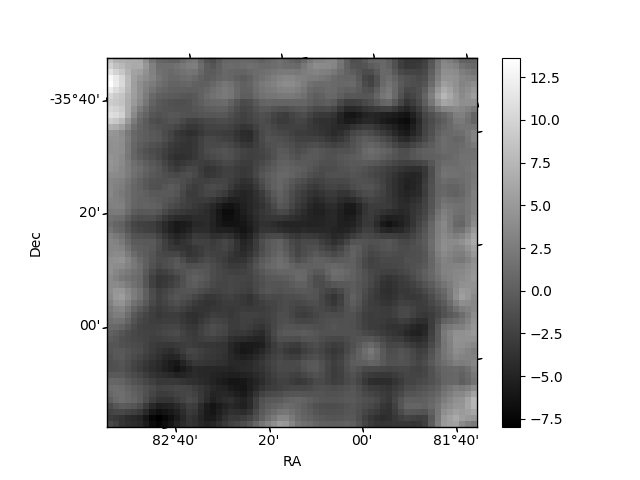
Histogram calculated using DETX and DETY for each event in the final _common_clean file
| Quadrant A | 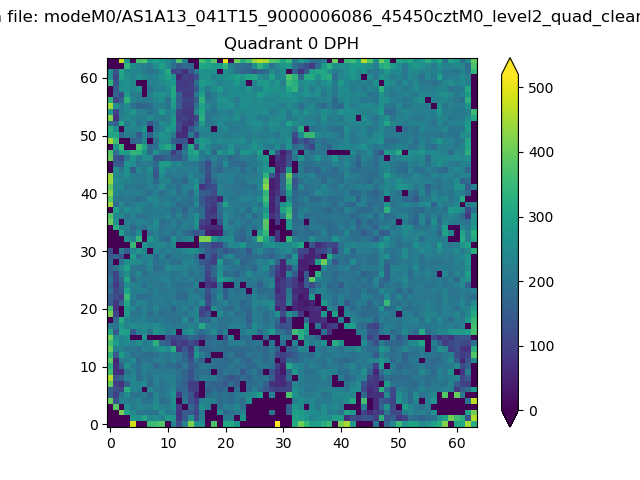 |
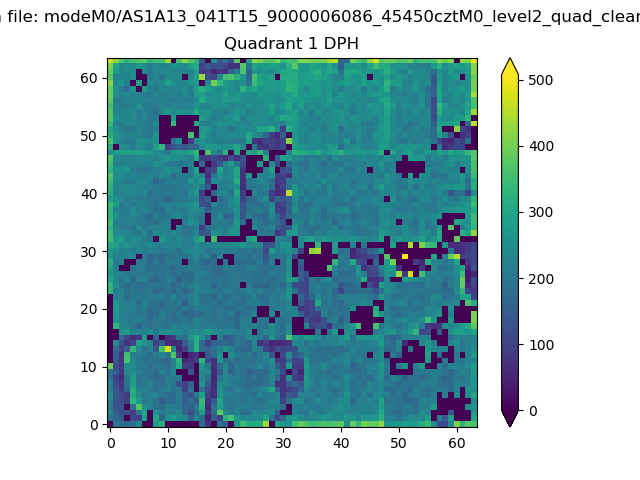 |
Quadrant B |
|---|---|---|---|
| Quadrant D | 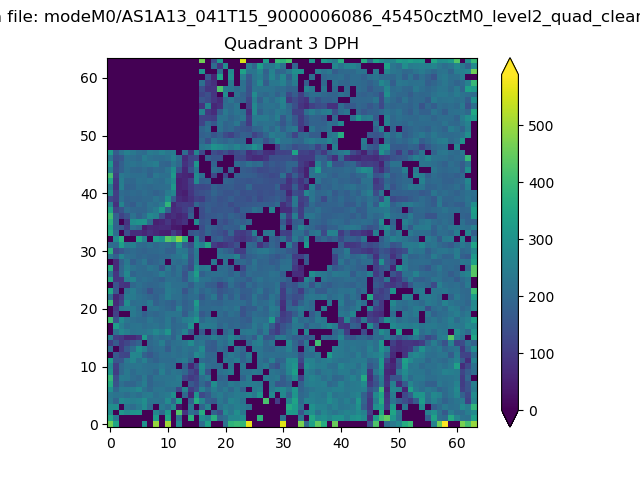 |
 |
Quadrant C |
| Plot type | Count rate plots | Images |
|---|---|---|
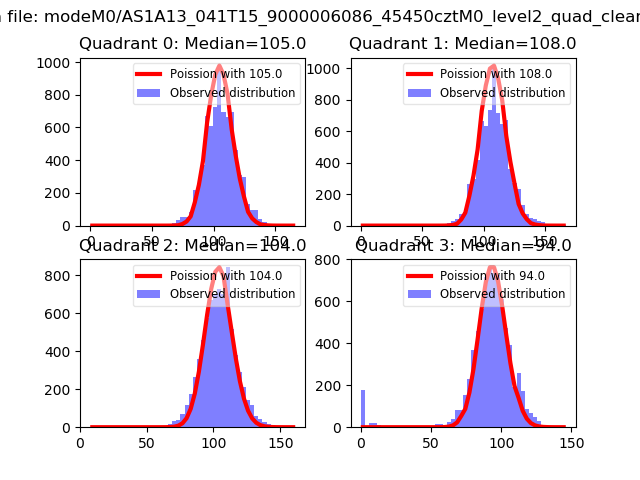
| Comparison with Poisson distribution Blue bars denote a histogram of data divided into 1 sec bins. Red curve is a Poisson curve with rate = median count rate of data. |
 |
 |
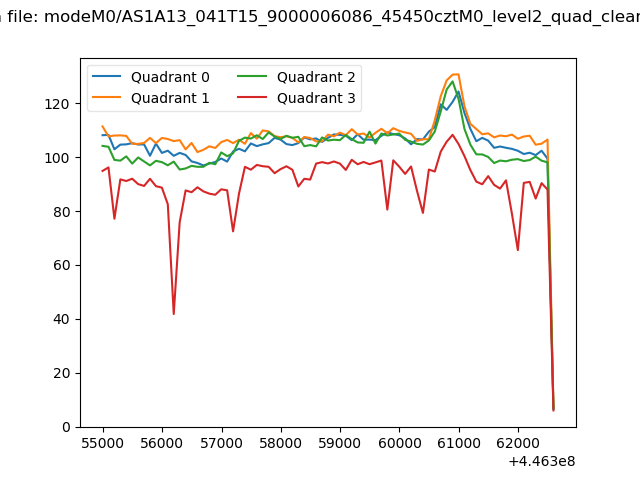
| Quadrant-wise count rates Data is divided into 100 sec bins |
 |
|
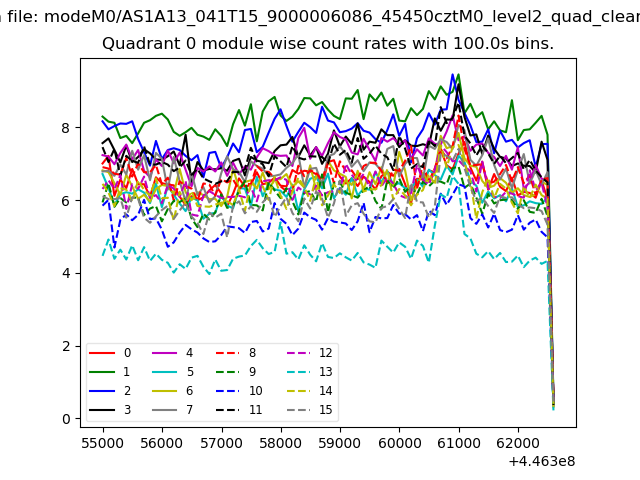
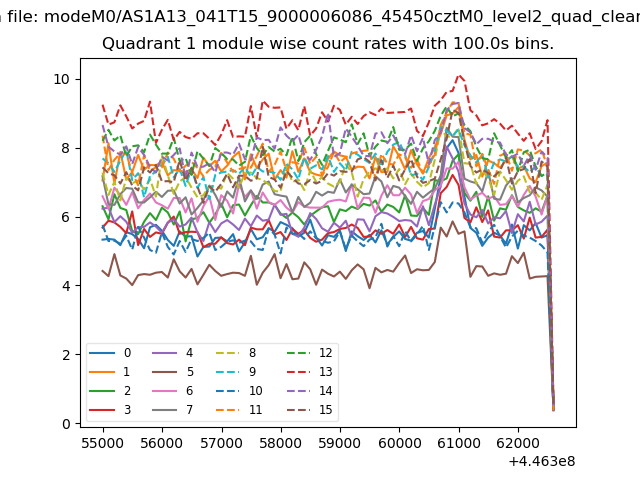
| Module-wise count rates for Quadrant A Data is divided into 100 sec bins |
 |
 |
| Module-wise count rates for Quadrant B Data is divided into 100 sec bins |
 |
 |
| Module-wise count rates for Quadrant C Data is divided into 100 sec bins |
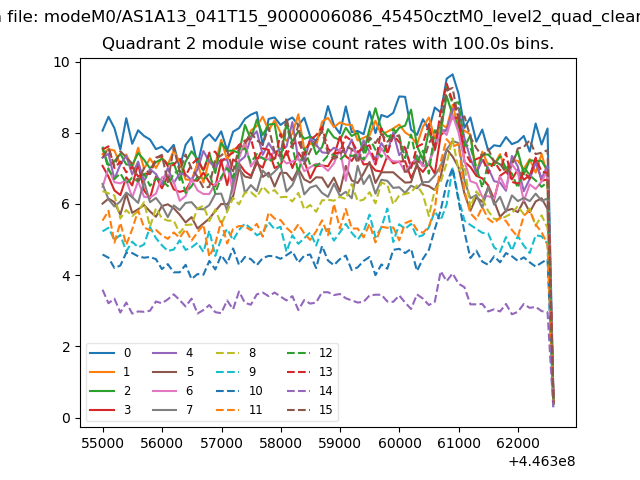 |
 |
| Module-wise count rates for Quadrant D Data is divided into 100 sec bins |
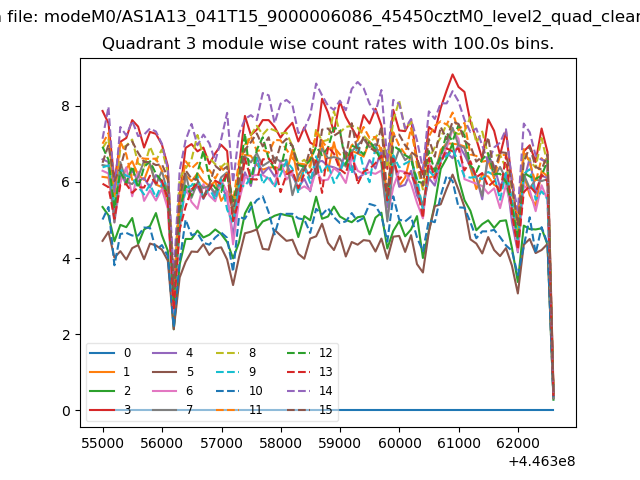 |
 |
| Parameter | Plot |
|---|---|
| CZT HV Monitor | 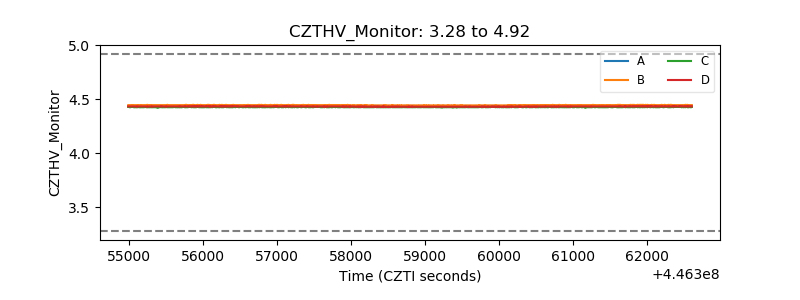 |
| D_VDD | 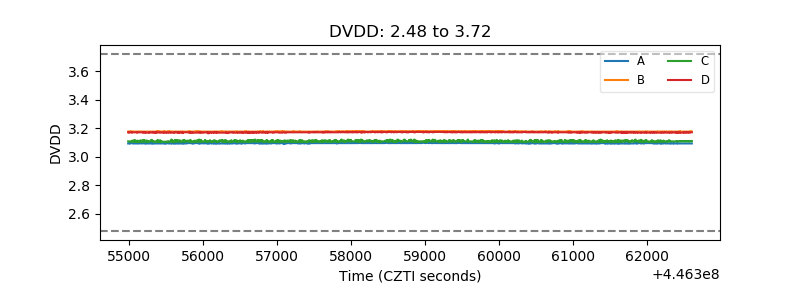 |
| Temperature 1 | 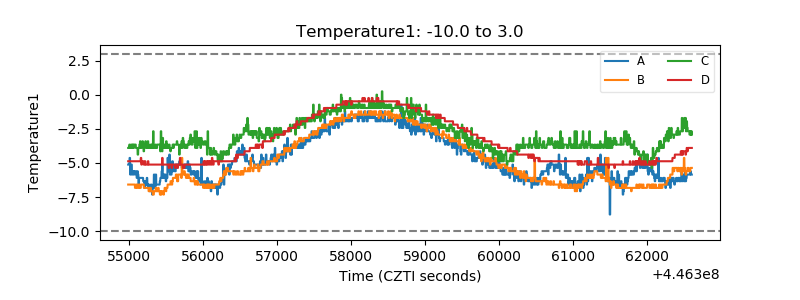 |
| Veto HV Monitor | 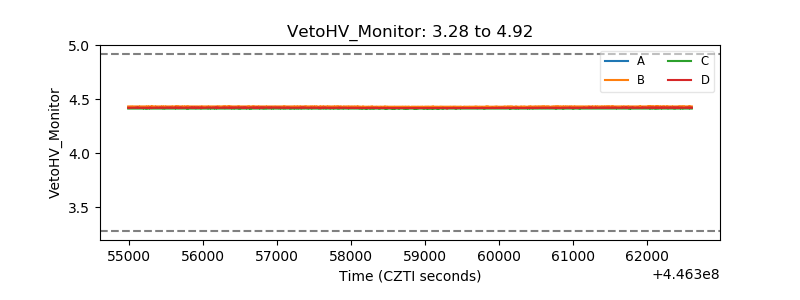 |
| Veto LLD | 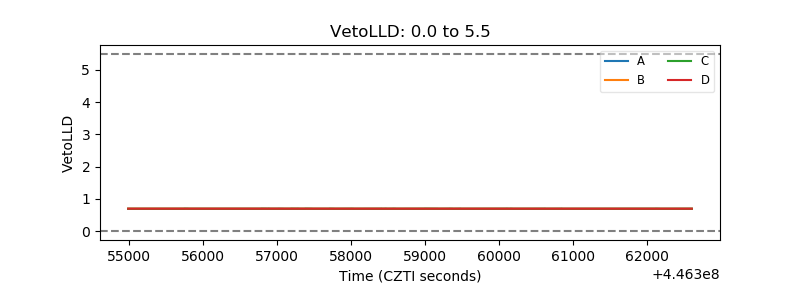 |
| Alpha Counter | 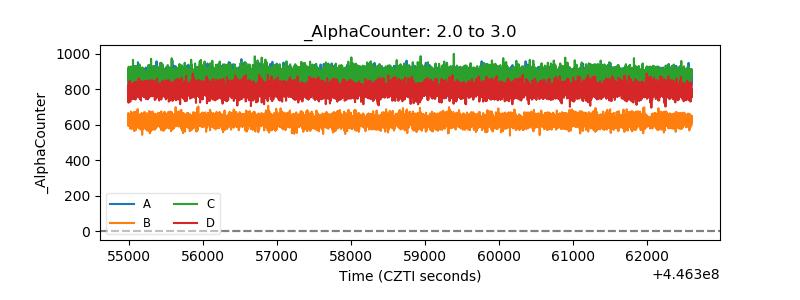 |
| _CPM_Rate | 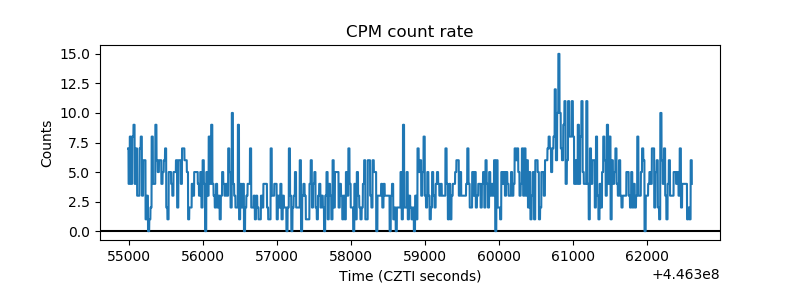 |
| CZT Counter | 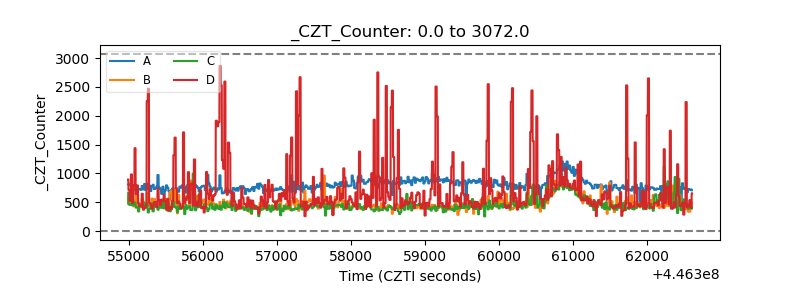 |
| +2.5 Volts monitor | 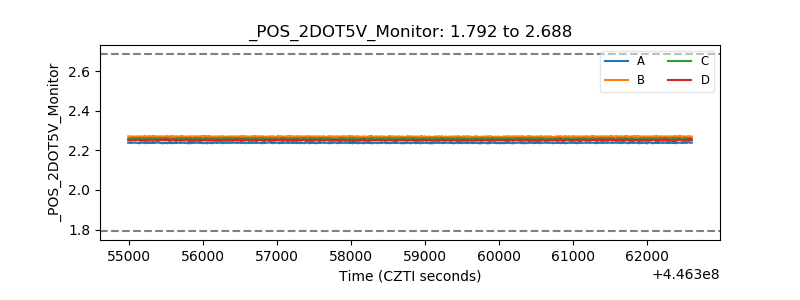 |
| +5 Volts monitor | 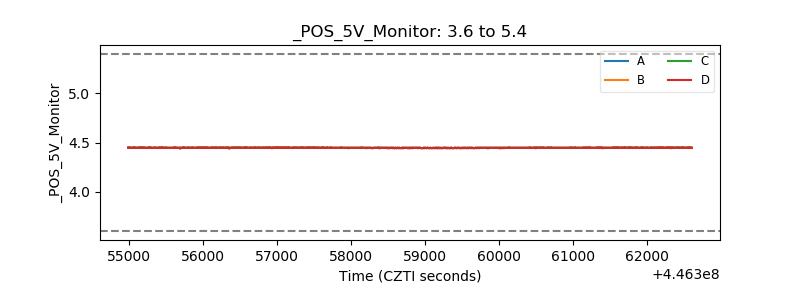 |
| _ROLL_ROT | 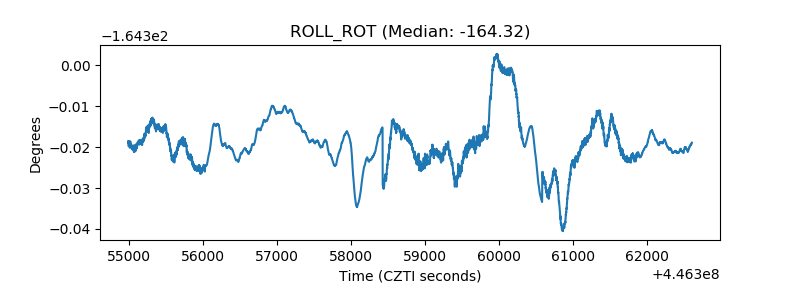 |
| _Roll_DEC | 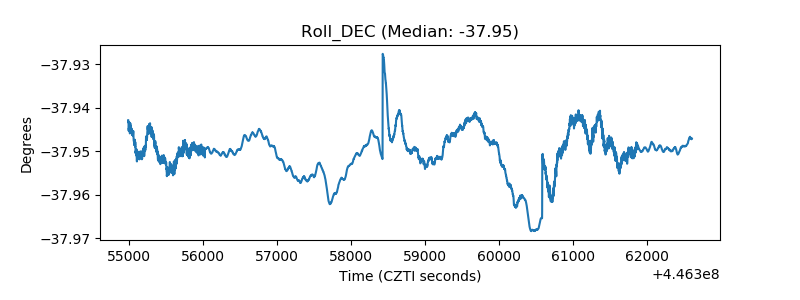 |
| _Roll_RA | 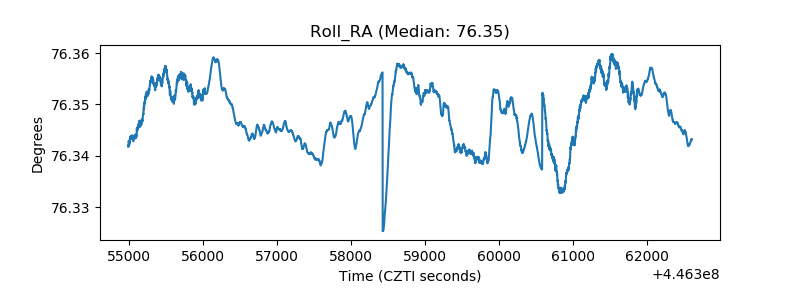 |
| Veto Counter | 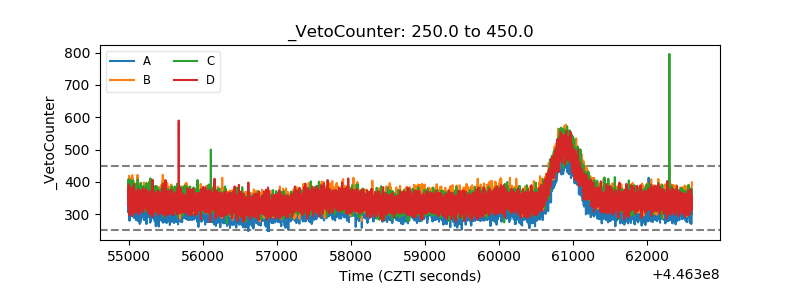 |