| Param | Original file | Final file |
|---|---|---|
| Filename | modeM0/AS1A13_041T15_9000006086_45451cztM0_level2.fits | modeM0/AS1A13_041T15_9000006086_45451cztM0_level2_quad_clean.evt |
| Size (bytes) | 547,683,840 | 124,989,120 |
| Size | 522.3 MB | 119.2 MB |
| Events in quadrant A | 6,349,599 | 819,555 |
| Events in quadrant B | 4,077,755 | 855,874 |
| Events in quadrant C | 3,889,802 | 824,898 |
| Events in quadrant D | 5,336,354 | 729,224 |
| Mode M0 | |||
|---|---|---|---|
| Quadrant | BADHDUFLAG | Total packets | Discarded packets |
| A | 0 | 24463 | 0 |
| B | 0 | 17583 | 0 |
| C | 0 | 17357 | 0 |
| D | 0 | 21303 | 0 |
| Mode SS | |||
|---|---|---|---|
| Quadrant | BADHDUFLAG | Total packets | Discarded packets |
| A | 0 | 158 | 0 |
| B | 0 | 158 | 0 |
| C | 0 | 158 | 0 |
| D | 0 | 158 | 0 |
| Quadrant | Total seconds | Saturated seconds | Saturation percentage |
|---|---|---|---|
| A | 7989 | 263 | 3.292027% |
| B | 7990 | 238 | 2.978723% |
| C | 7990 | 158 | 1.977472% |
| D | 7990 | 444 | 5.556946% |
Noise dominated data is calculated using 1-second bins in cleaned event files. If a bin has >2000 counts, and if more than 50% of those come from <1% of pixels, then it is considered to be noise-dominated and hence unusable.
| Quadrant | # 1 sec bins | Bins with >0 counts | Bins with >2000 counts | High rate bins dominated by noise | Noise dominated (total time) | Noise dominated (detector-on time) | Marked lightcurve |
|---|---|---|---|---|---|---|---|
| A | 7989 | 7989 | 2 | 2 | 0.03% | 0.03% | 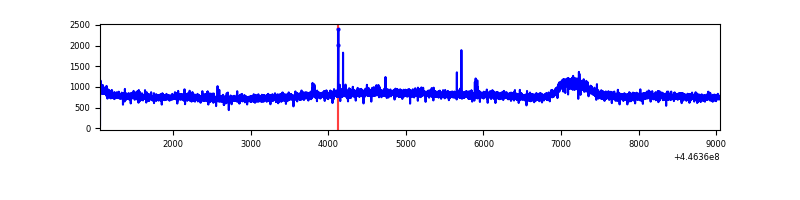 |
| B | 7990 | 7990 | 19 | 19 | 0.24% | 0.24% | 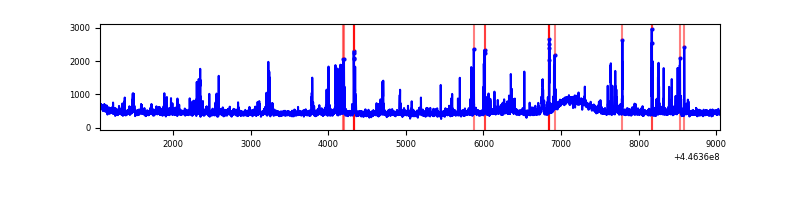 |
| C | 7990 | 7990 | 36 | 36 | 0.45% | 0.45% | 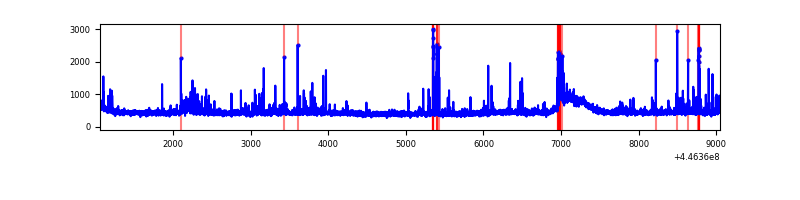 |
| D | 7990 | 7990 | 267 | 267 | 3.34% | 3.34% | 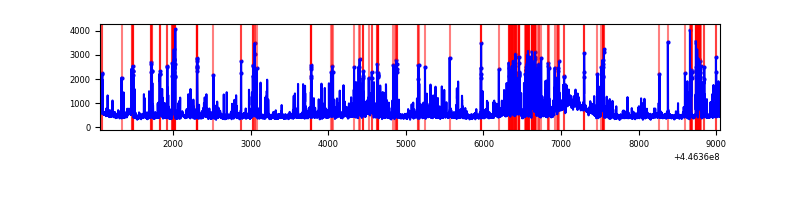 |
Top three noisy pixels from each quadrant. If the there are fewer than three noisy pixels in the level2.evt file, extra rows are filled as -1
| Pixel properties | Quadrant properties | ||||||
|---|---|---|---|---|---|---|---|
| Quadrant | DetID | PixID | Counts | Sigma | Mean | Median | Sigma |
| A | 10 | 83 | 2817475 | 14887.92 | 903 | 884 | 189.2 |
| A | 13 | 248 | 16494 | 82.51 | 903 | 884 | 189.2 |
| A | 3 | 137 | 10843 | 52.64 | 903 | 884 | 189.2 |
| B | 5 | 172 | 191364 | 1038.15 | 908 | 875 | 183.5 |
| B | 0 | 171 | 86610 | 467.25 | 908 | 875 | 183.5 |
| B | 15 | 201 | 64755 | 348.14 | 908 | 875 | 183.5 |
| C | 0 | 239 | 242267 | 1138.2 | 897 | 898 | 212.1 |
| C | 14 | 96 | 67589 | 314.49 | 897 | 898 | 212.1 |
| C | 14 | 254 | 58499 | 271.62 | 897 | 898 | 212.1 |
| D | 13 | 249 | 577705 | 2605.66 | 878 | 849 | 221.4 |
| D | 4 | 222 | 450981 | 2033.25 | 878 | 849 | 221.4 |
| D | 1 | 52 | 325941 | 1468.44 | 878 | 849 | 221.4 |
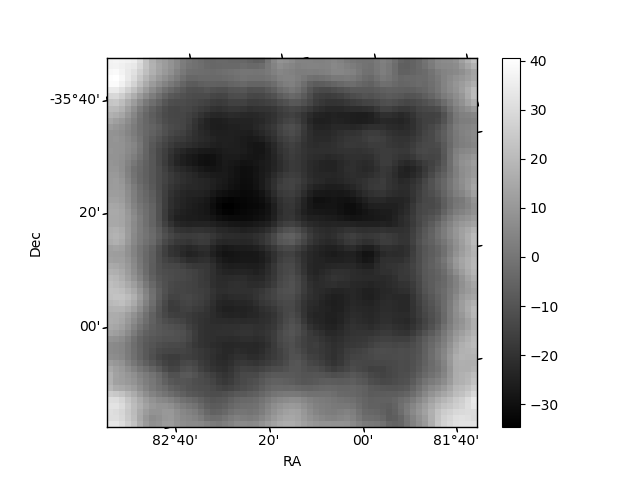
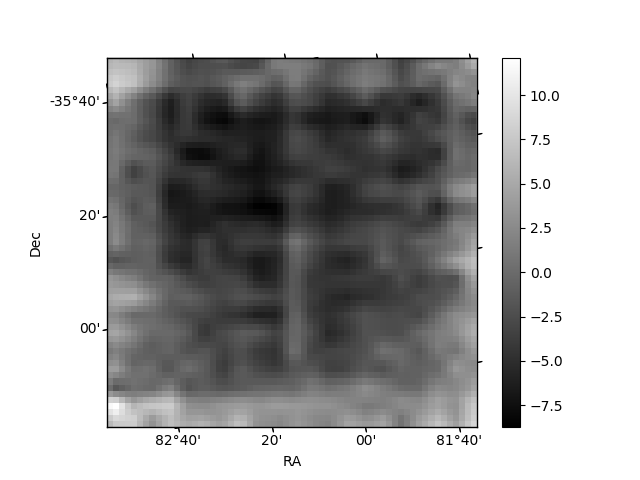
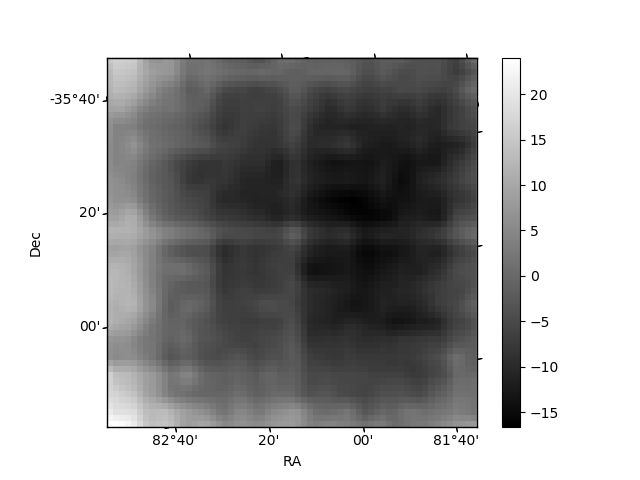
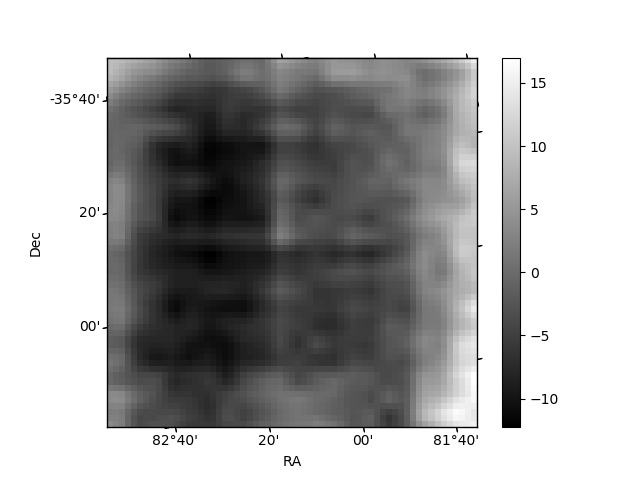
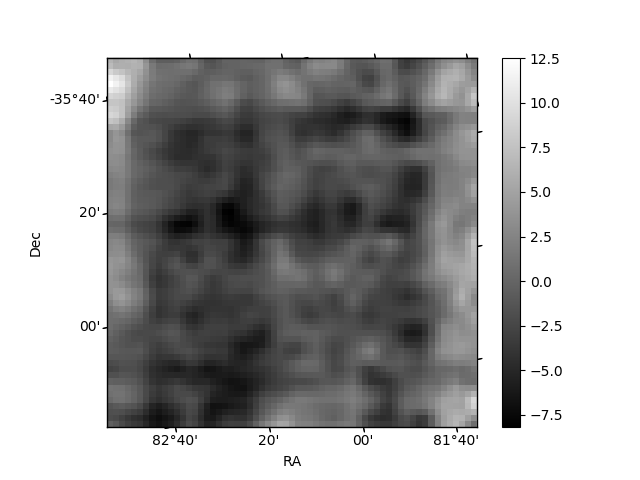
Histogram calculated using DETX and DETY for each event in the final _common_clean file
| Quadrant A | 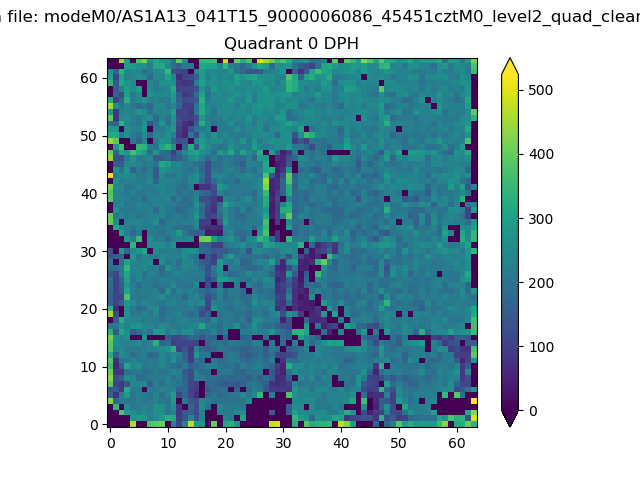 |
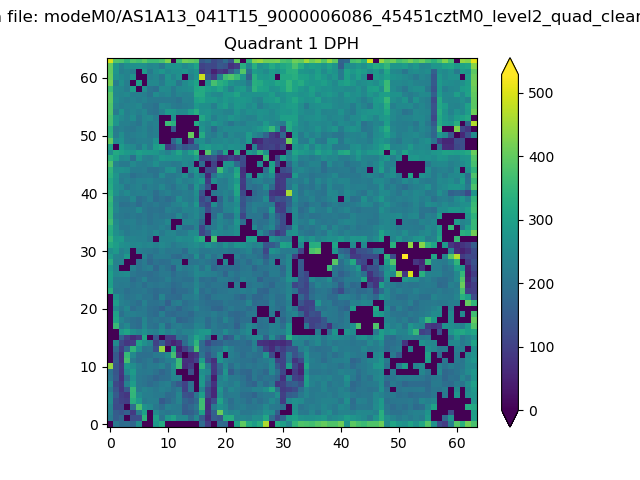 |
Quadrant B |
|---|---|---|---|
| Quadrant D | 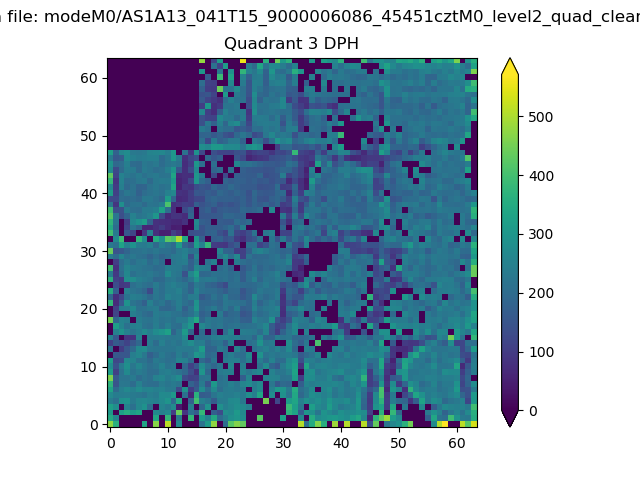 |
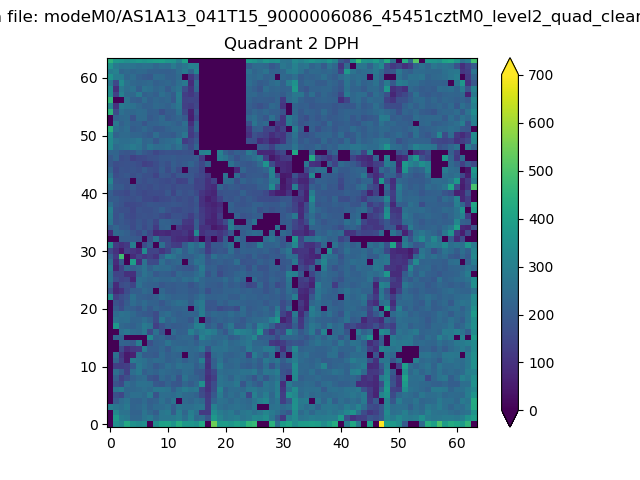 |
Quadrant C |
| Plot type | Count rate plots | Images |
|---|---|---|
| Comparison with Poisson distribution Blue bars denote a histogram of data divided into 1 sec bins. Red curve is a Poisson curve with rate = median count rate of data. |
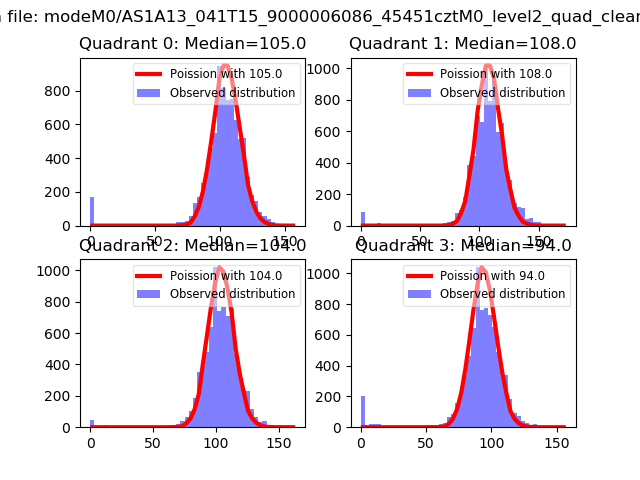 |
 |
| Quadrant-wise count rates Data is divided into 100 sec bins |
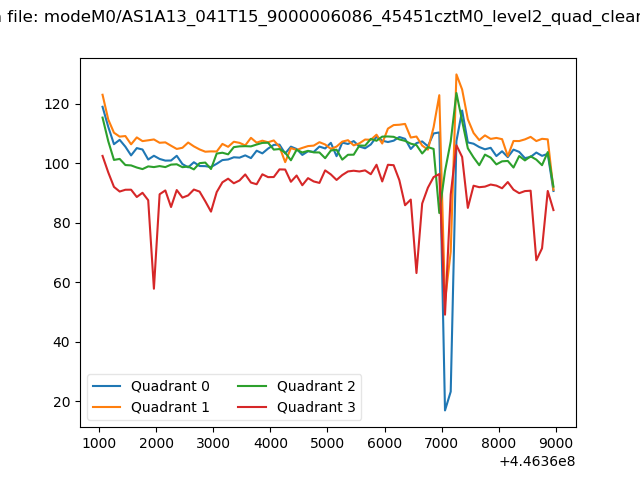 |
|
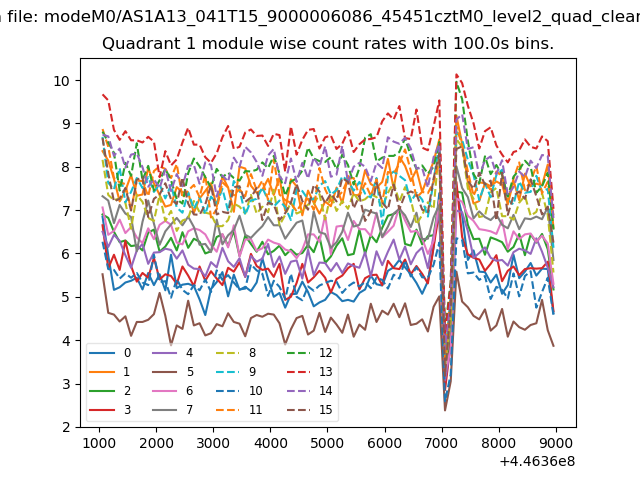
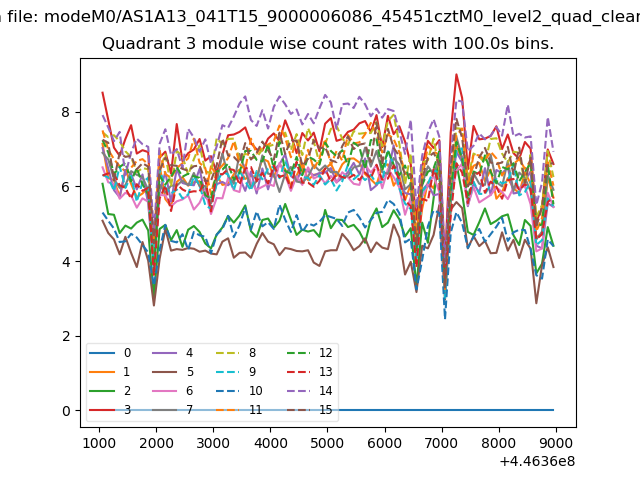
| Module-wise count rates for Quadrant A Data is divided into 100 sec bins |
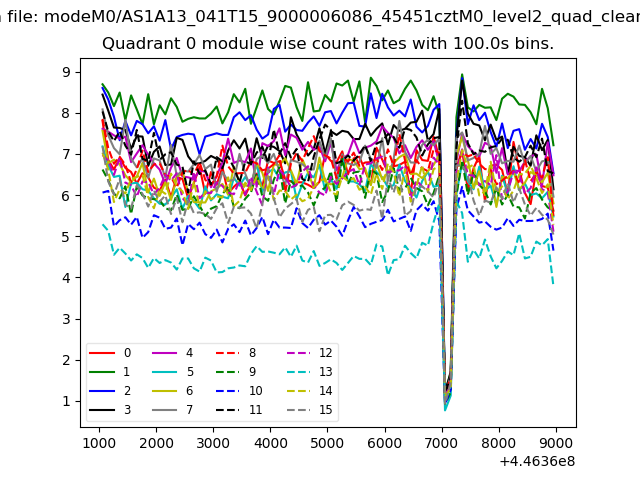 |
 |
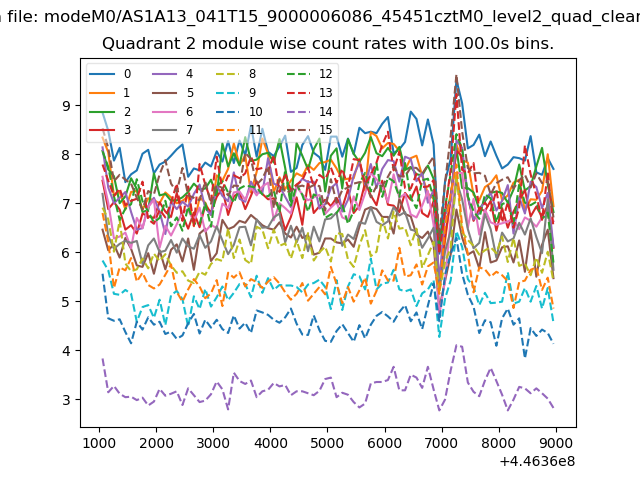
| Module-wise count rates for Quadrant B Data is divided into 100 sec bins |
 |
 |
| Module-wise count rates for Quadrant C Data is divided into 100 sec bins |
 |
 |
| Module-wise count rates for Quadrant D Data is divided into 100 sec bins |
 |
 |
| Parameter | Plot |
|---|---|
| CZT HV Monitor | 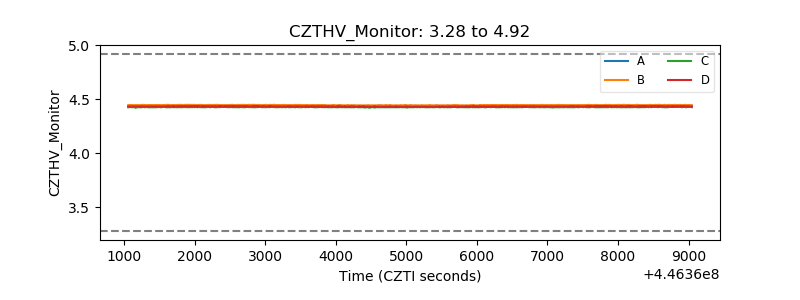 |
| D_VDD |  |
| Temperature 1 | 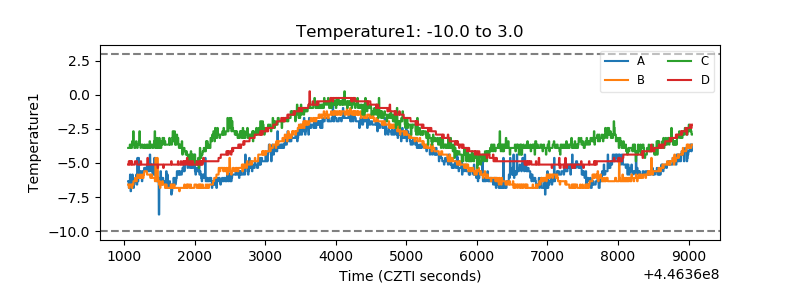 |
| Veto HV Monitor | 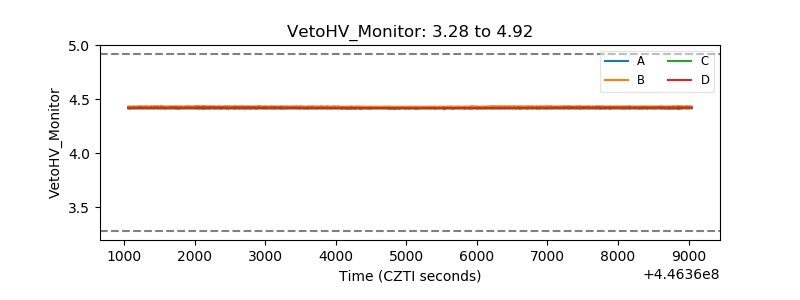 |
| Veto LLD |  |
| Alpha Counter | 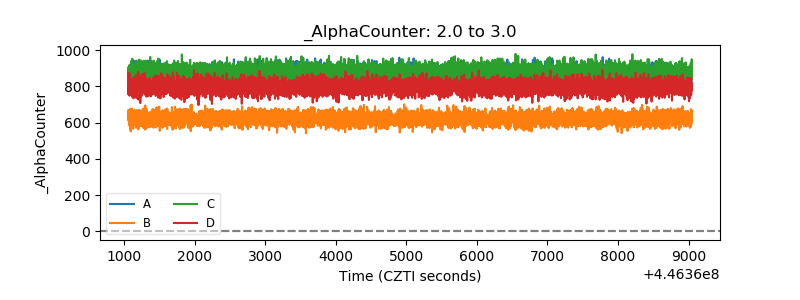 |
| _CPM_Rate | 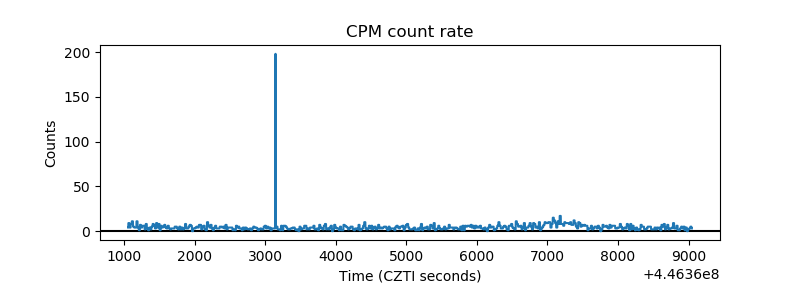 |
| CZT Counter | 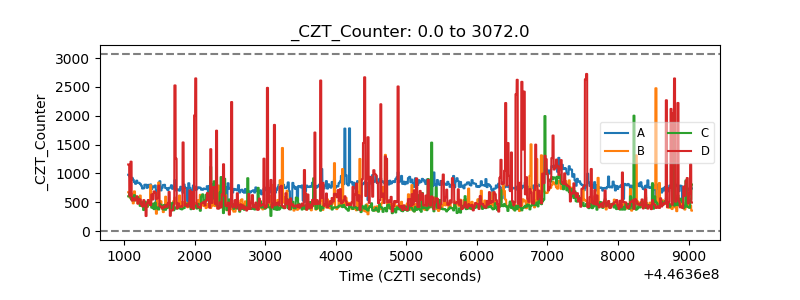 |
| +2.5 Volts monitor | 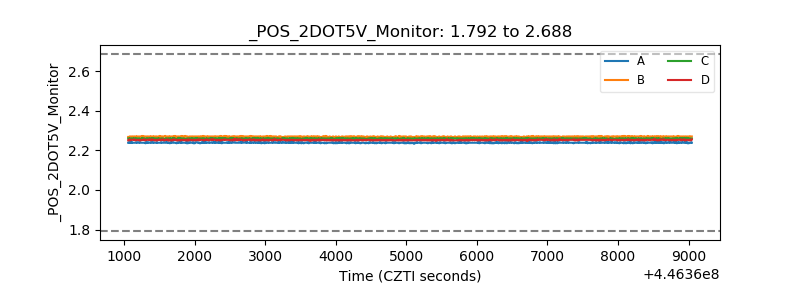 |
| +5 Volts monitor | 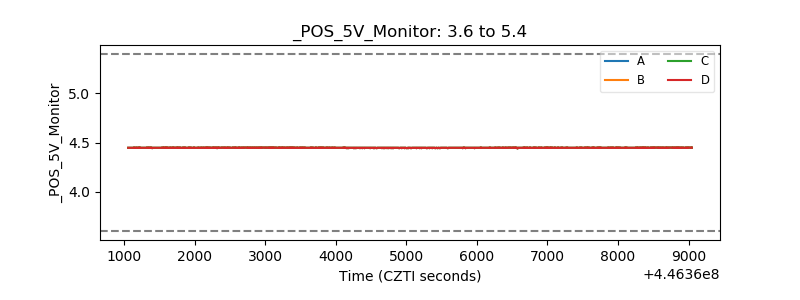 |
| _ROLL_ROT | 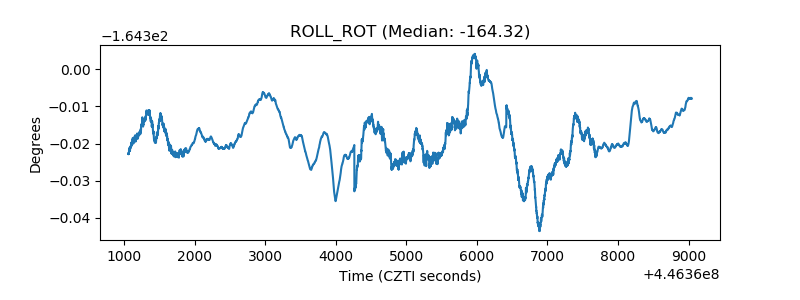 |
| _Roll_DEC | 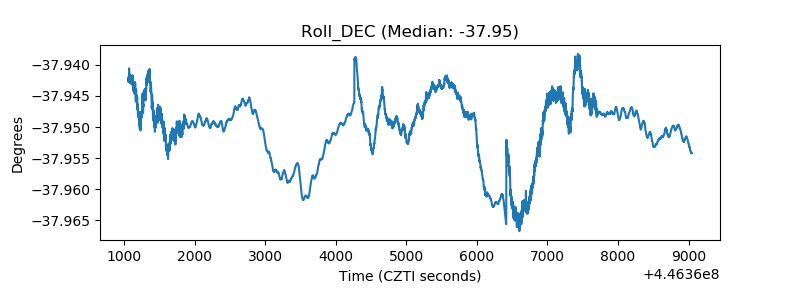 |
| _Roll_RA | 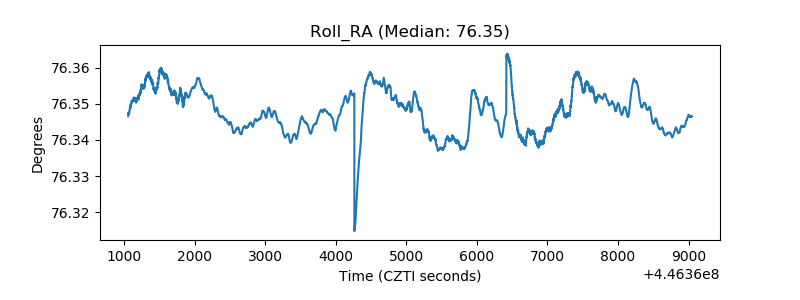 |
| Veto Counter | 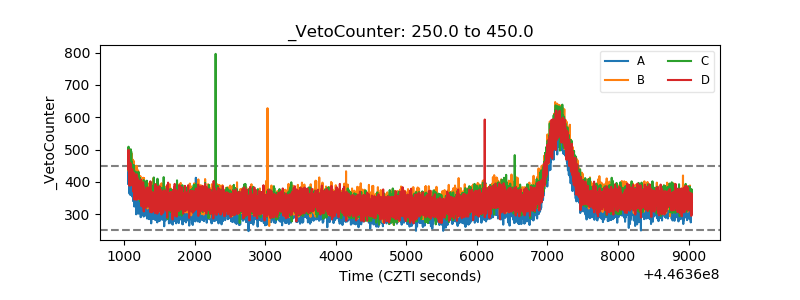 |