| Param | Original file | Final file |
|---|---|---|
| Filename | modeM0/AS1A13_041T15_9000006086_45454cztM0_level2.fits | modeM0/AS1A13_041T15_9000006086_45454cztM0_level2_quad_clean.evt |
| Size (bytes) | 283,656,960 | 65,237,760 |
| Size | 270.5 MB | 62.2 MB |
| Events in quadrant A | 3,300,175 | 429,448 |
| Events in quadrant B | 2,327,642 | 438,248 |
| Events in quadrant C | 1,876,163 | 430,921 |
| Events in quadrant D | 2,671,740 | 383,616 |
| Mode M0 | |||
|---|---|---|---|
| Quadrant | BADHDUFLAG | Total packets | Discarded packets |
| A | 0 | 12781 | 283 |
| B | 0 | 10010 | 190 |
| C | 0 | 8840 | 130 |
| D | 0 | 10996 | 262 |
| Mode SS | |||
|---|---|---|---|
| Quadrant | BADHDUFLAG | Total packets | Discarded packets |
| A | 0 | 86 | 0 |
| B | 0 | 86 | 0 |
| C | 0 | 85 | 0 |
| D | 0 | 85 | 1 |
| Quadrant | Total seconds | Saturated seconds | Saturation percentage |
|---|---|---|---|
| A | 4131 | 17 | 0.411523% |
| B | 4174 | 116 | 2.779109% |
| C | 4171 | 12 | 0.287701% |
| D | 4144 | 128 | 3.088803% |
Noise dominated data is calculated using 1-second bins in cleaned event files. If a bin has >2000 counts, and if more than 50% of those come from <1% of pixels, then it is considered to be noise-dominated and hence unusable.
| Quadrant | # 1 sec bins | Bins with >0 counts | Bins with >2000 counts | High rate bins dominated by noise | Noise dominated (total time) | Noise dominated (detector-on time) | Marked lightcurve |
|---|---|---|---|---|---|---|---|
| A | 4251 | 4219 | 3 | 3 | 0.07% | 0.07% | 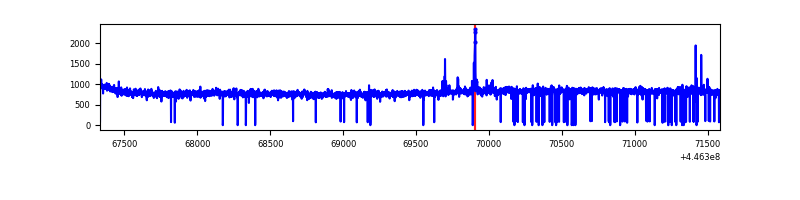 |
| B | 4251 | 4228 | 67 | 67 | 1.58% | 1.58% | 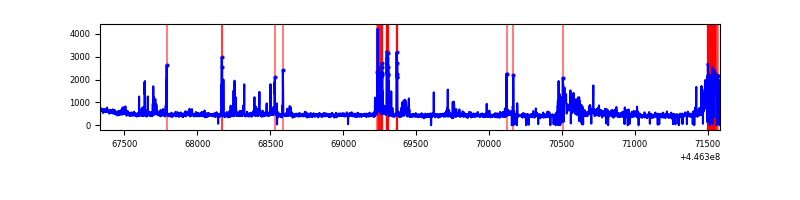 |
| C | 4252 | 4228 | 13 | 13 | 0.31% | 0.31% | 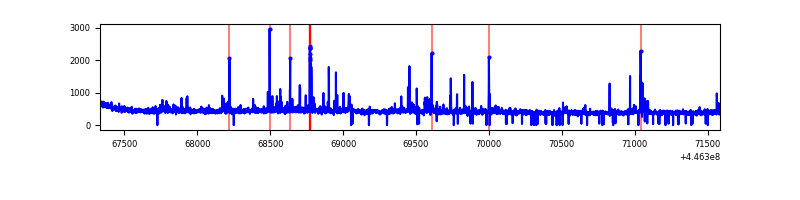 |
| D | 4252 | 4214 | 99 | 99 | 2.33% | 2.35% | 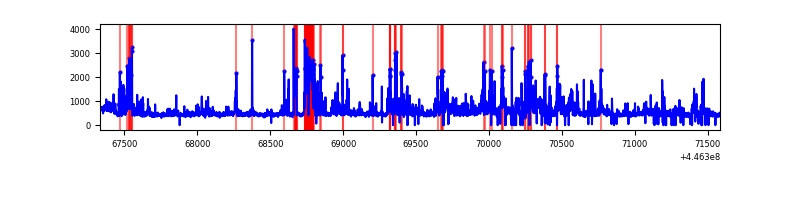 |
Top three noisy pixels from each quadrant. If the there are fewer than three noisy pixels in the level2.evt file, extra rows are filled as -1
| Pixel properties | Quadrant properties | ||||||
|---|---|---|---|---|---|---|---|
| Quadrant | DetID | PixID | Counts | Sigma | Mean | Median | Sigma |
| A | 10 | 83 | 1539805 | 16323.66 | 445 | 435 | 94.3 |
| A | 13 | 248 | 19221 | 199.21 | 445 | 435 | 94.3 |
| A | 0 | 243 | 7521 | 75.14 | 445 | 435 | 94.3 |
| B | 5 | 172 | 183509 | 2058.62 | 444 | 431 | 88.9 |
| B | 12 | 2 | 136240 | 1527.1 | 444 | 431 | 88.9 |
| B | 15 | 201 | 116666 | 1307.0 | 444 | 431 | 88.9 |
| C | 14 | 96 | 97280 | 927.77 | 440 | 443 | 104.4 |
| C | 14 | 254 | 22683 | 213.08 | 440 | 443 | 104.4 |
| C | 0 | 239 | 13644 | 126.48 | 440 | 443 | 104.4 |
| D | 13 | 249 | 333243 | 3036.31 | 432 | 417 | 109.6 |
| D | 1 | 52 | 182045 | 1656.96 | 432 | 417 | 109.6 |
| D | 4 | 222 | 167495 | 1524.22 | 432 | 417 | 109.6 |
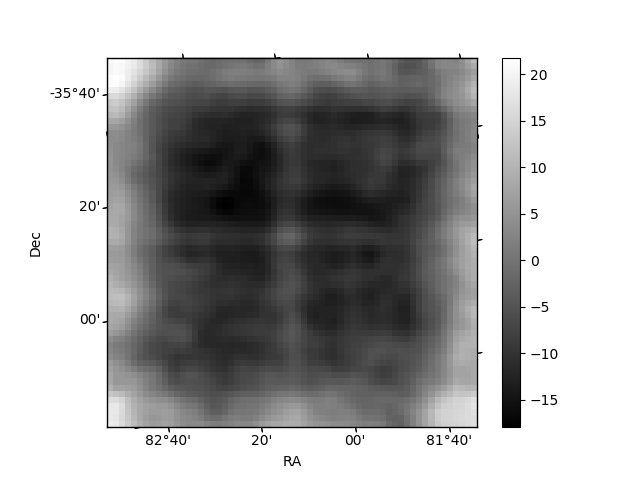
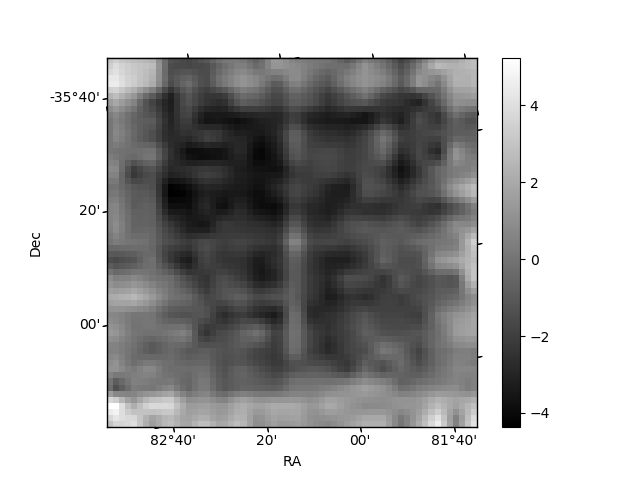
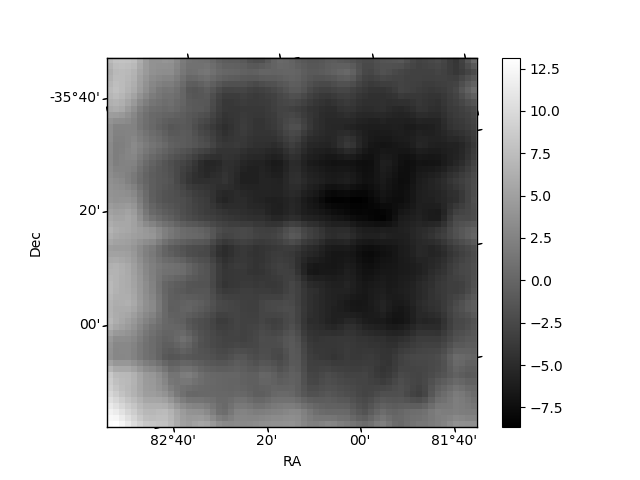
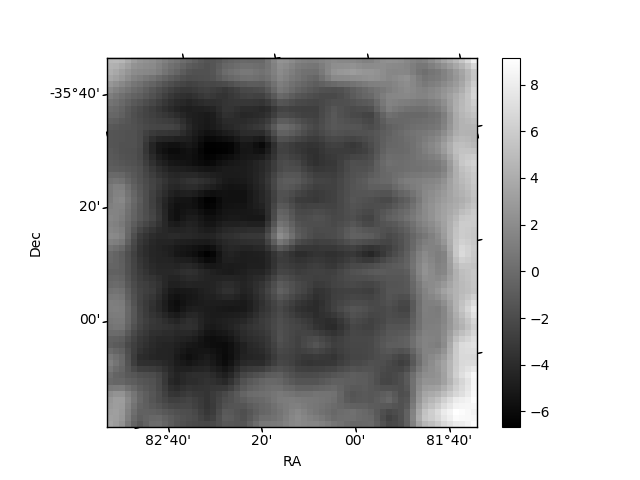
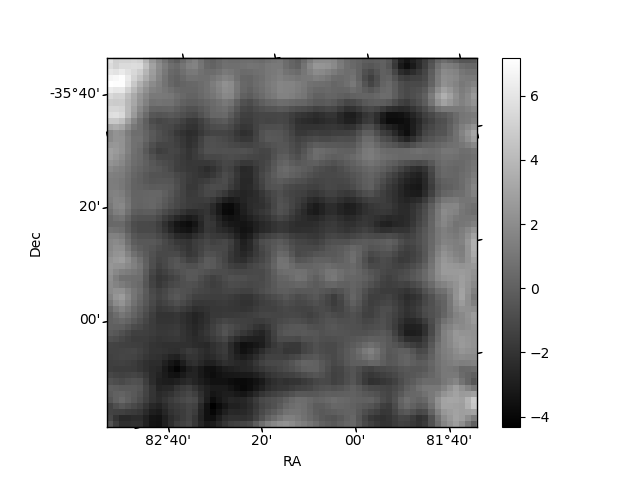
Histogram calculated using DETX and DETY for each event in the final _common_clean file
| Quadrant A | 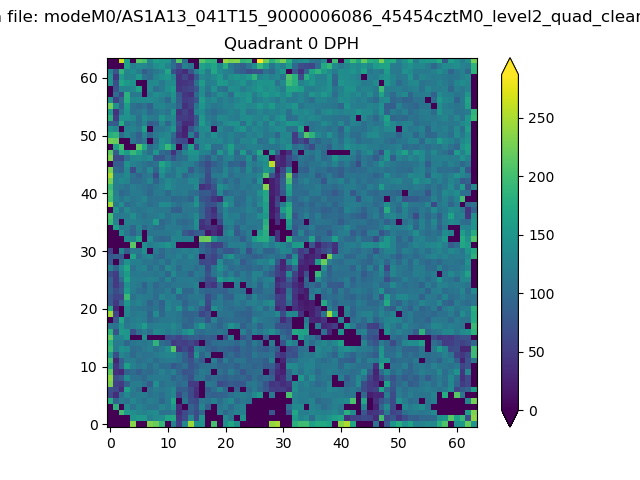 |
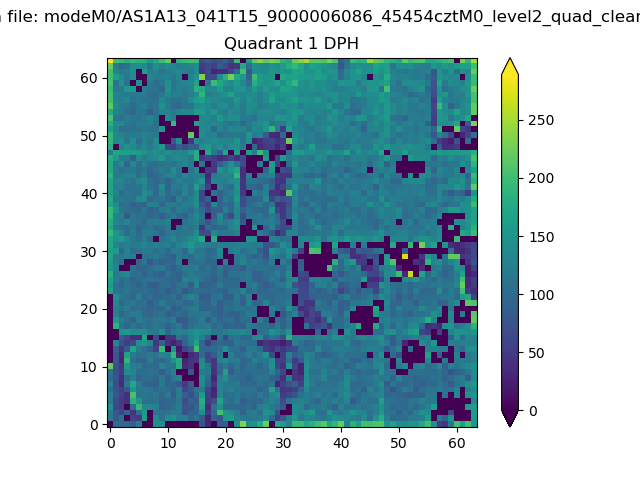 |
Quadrant B |
|---|---|---|---|
| Quadrant D | 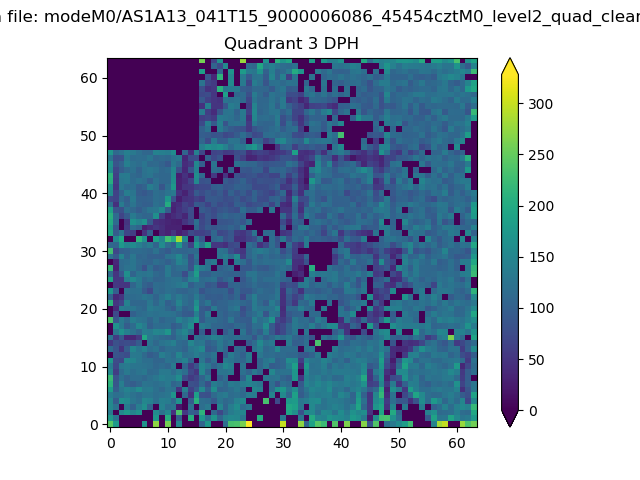 |
 |
Quadrant C |
| Plot type | Count rate plots | Images |
|---|---|---|
| Comparison with Poisson distribution Blue bars denote a histogram of data divided into 1 sec bins. Red curve is a Poisson curve with rate = median count rate of data. |
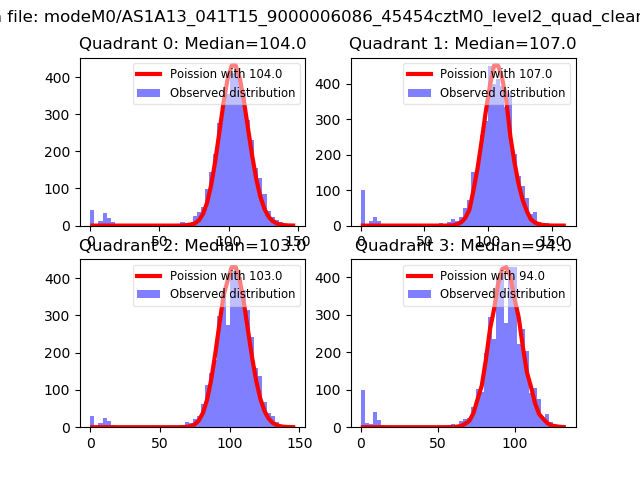 |
 |
| Quadrant-wise count rates Data is divided into 100 sec bins |
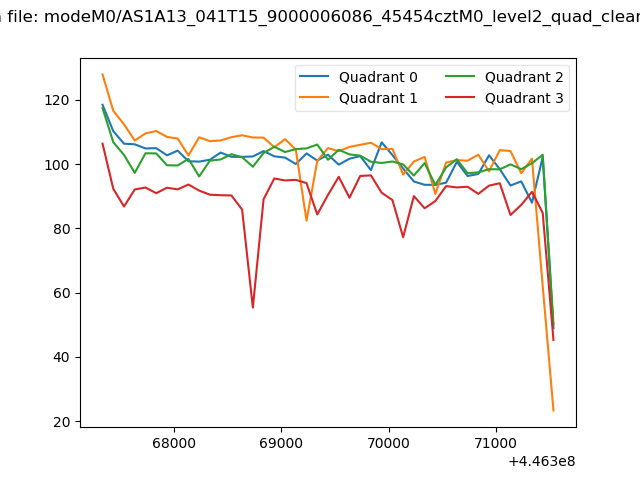 |
|
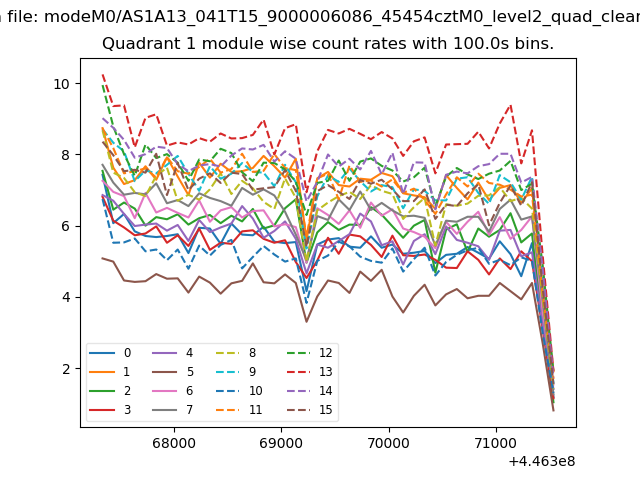
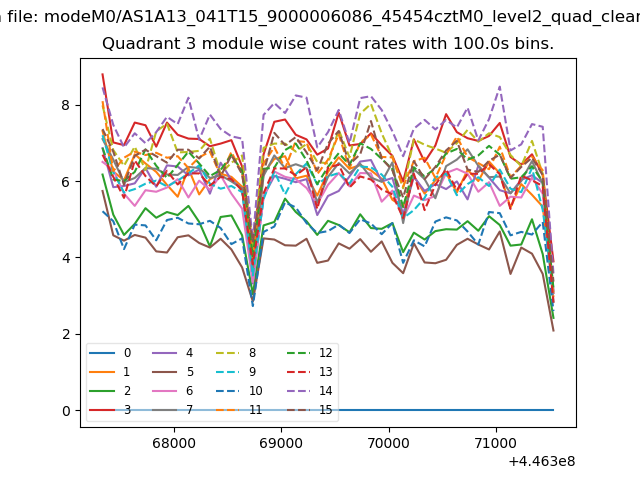
| Module-wise count rates for Quadrant A Data is divided into 100 sec bins |
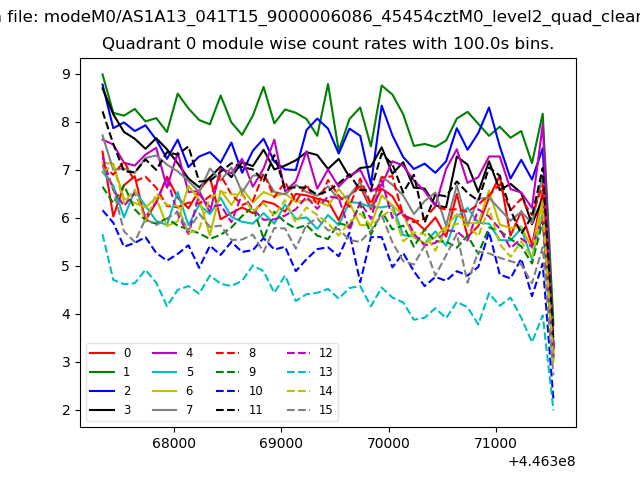 |
 |
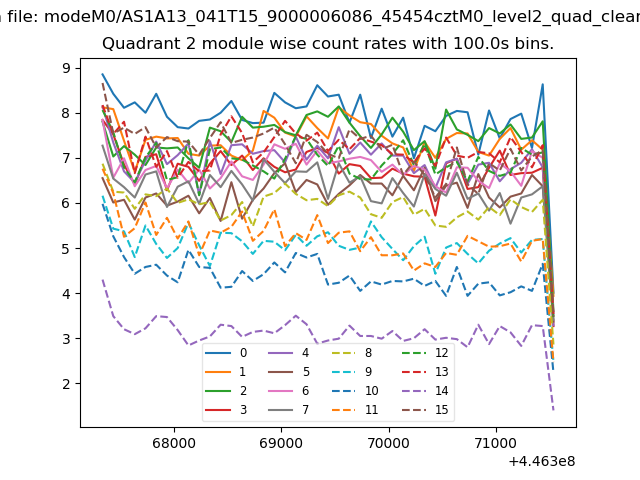
| Module-wise count rates for Quadrant B Data is divided into 100 sec bins |
 |
 |
| Module-wise count rates for Quadrant C Data is divided into 100 sec bins |
 |
 |
| Module-wise count rates for Quadrant D Data is divided into 100 sec bins |
 |
 |
| Parameter | Plot |
|---|---|
| CZT HV Monitor | 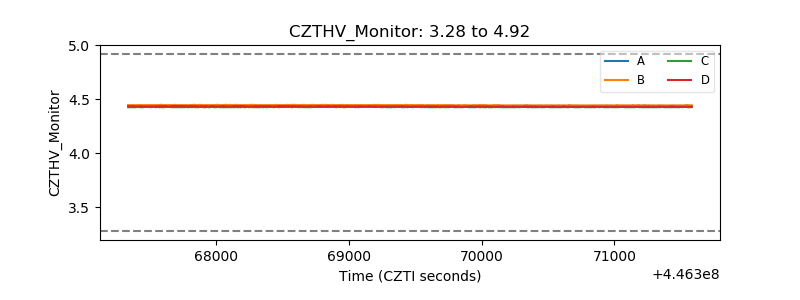 |
| D_VDD | 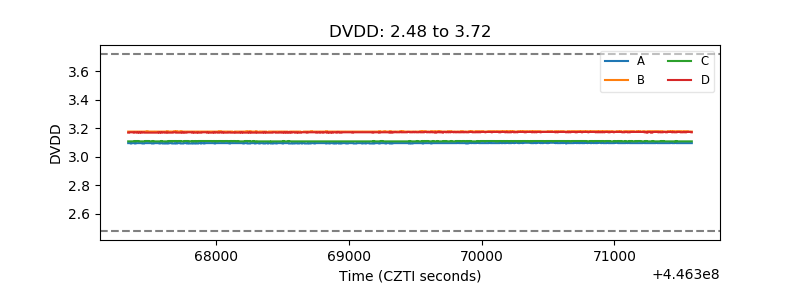 |
| Temperature 1 | 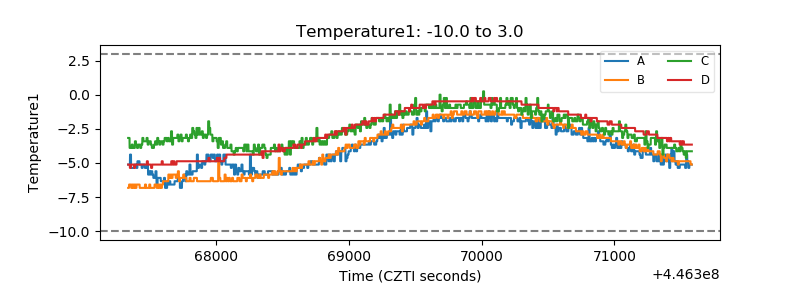 |
| Veto HV Monitor | 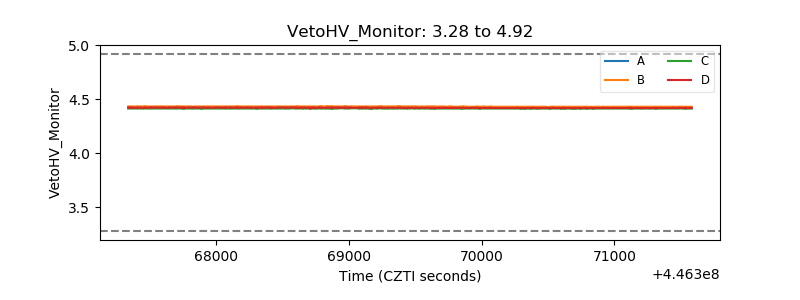 |
| Veto LLD | 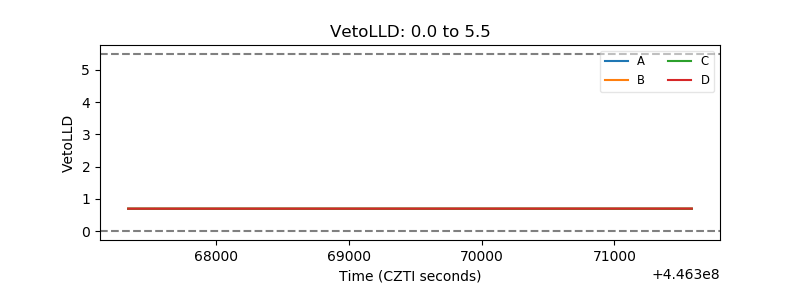 |
| Alpha Counter | 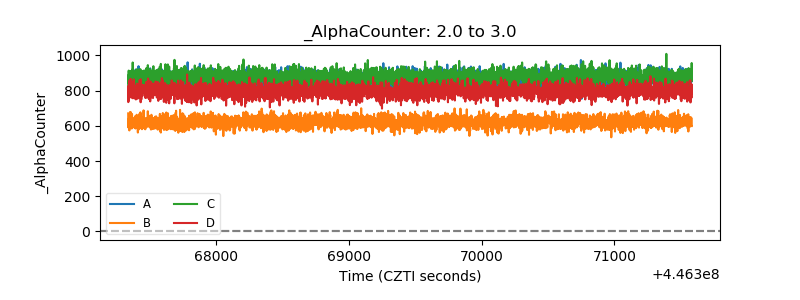 |
| _CPM_Rate | 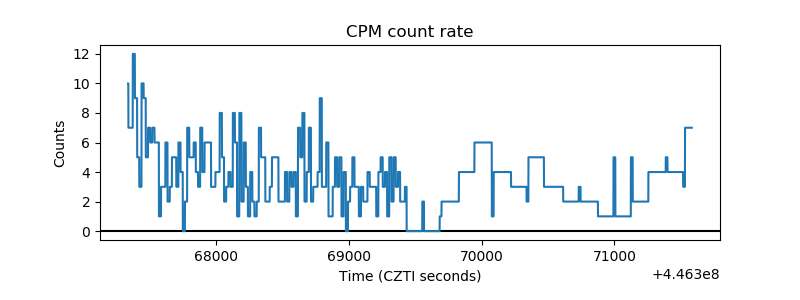 |
| CZT Counter | 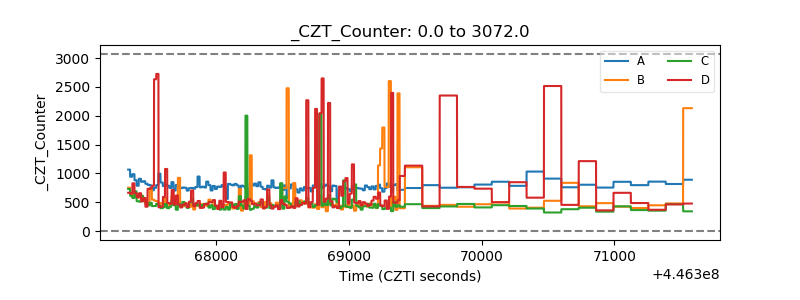 |
| +2.5 Volts monitor | 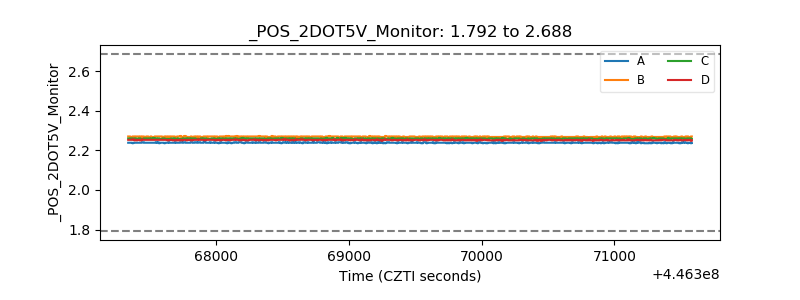 |
| +5 Volts monitor | 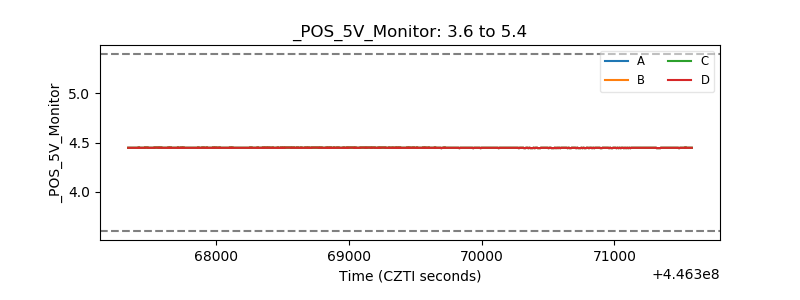 |
| _ROLL_ROT | 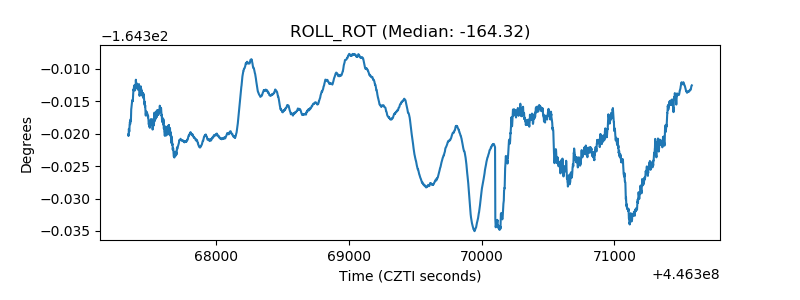 |
| _Roll_DEC | 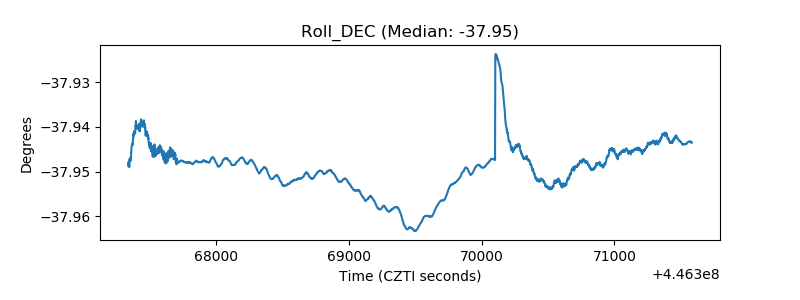 |
| _Roll_RA | 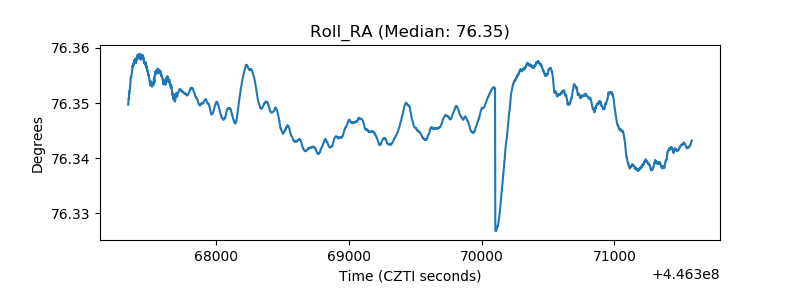 |
| Veto Counter | 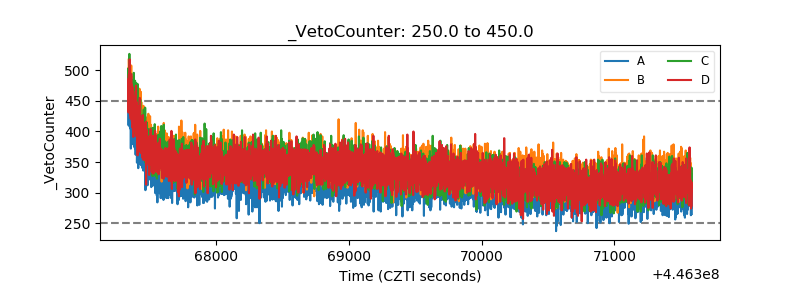 |