| Param | Original file | Final file |
|---|---|---|
| Filename | modeM0/AS1A13_038T03_9000006088_45454cztM0_level2.fits | modeM0/AS1A13_038T03_9000006088_45454cztM0_level2_quad_clean.evt |
| Size (bytes) | 544,095,360 | 124,672,320 |
| Size | 518.9 MB | 118.9 MB |
| Events in quadrant A | 6,521,830 | 808,095 |
| Events in quadrant B | 3,983,755 | 843,526 |
| Events in quadrant C | 3,800,743 | 828,126 |
| Events in quadrant D | 5,211,460 | 737,043 |
| Mode M9 | |||
|---|---|---|---|
| Quadrant | BADHDUFLAG | Total packets | Discarded packets |
| A | 0 | 9 | 0 |
| B | 0 | 9 | 0 |
| C | 0 | 9 | 0 |
| D | 0 | 9 | 0 |
| Mode M0 | |||
|---|---|---|---|
| Quadrant | BADHDUFLAG | Total packets | Discarded packets |
| A | 0 | 25357 | 514 |
| B | 0 | 17638 | 308 |
| C | 0 | 17386 | 270 |
| D | 0 | 21267 | 490 |
| Mode SS | |||
|---|---|---|---|
| Quadrant | BADHDUFLAG | Total packets | Discarded packets |
| A | 0 | 165 | 0 |
| B | 0 | 166 | 1 |
| C | 0 | 168 | 0 |
| D | 0 | 168 | 0 |
| Quadrant | Total seconds | Saturated seconds | Saturation percentage |
|---|---|---|---|
| A | 8013 | 270 | 3.369525% |
| B | 8035 | 217 | 2.700685% |
| C | 8046 | 123 | 1.528710% |
| D | 7991 | 304 | 3.804280% |
Noise dominated data is calculated using 1-second bins in cleaned event files. If a bin has >2000 counts, and if more than 50% of those come from <1% of pixels, then it is considered to be noise-dominated and hence unusable.
| Quadrant | # 1 sec bins | Bins with >0 counts | Bins with >2000 counts | High rate bins dominated by noise | Noise dominated (total time) | Noise dominated (detector-on time) | Marked lightcurve |
|---|---|---|---|---|---|---|---|
| A | 9116 | 8171 | 1 | 1 | 0.01% | 0.01% |  |
| B | 9115 | 8161 | 25 | 25 | 0.27% | 0.31% | 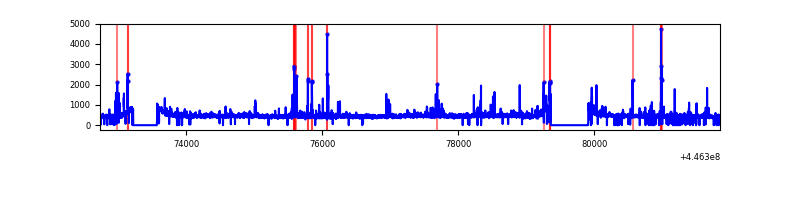 |
| C | 9112 | 8161 | 26 | 26 | 0.29% | 0.32% | 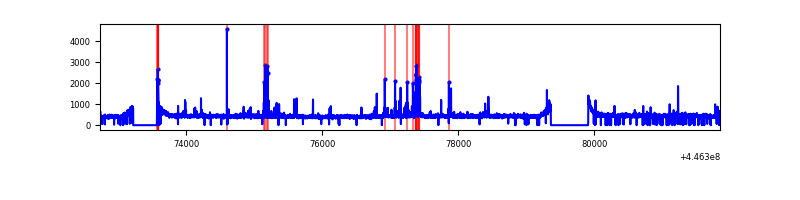 |
| D | 9115 | 8143 | 165 | 165 | 1.81% | 2.03% | 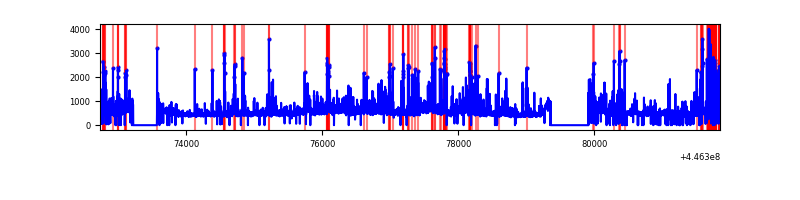 |
Top three noisy pixels from each quadrant. If the there are fewer than three noisy pixels in the level2.evt file, extra rows are filled as -1
| Pixel properties | Quadrant properties | ||||||
|---|---|---|---|---|---|---|---|
| Quadrant | DetID | PixID | Counts | Sigma | Mean | Median | Sigma |
| A | 10 | 83 | 3023274 | 16088.48 | 895 | 873 | 187.9 |
| A | 2 | 79 | 17746 | 89.82 | 895 | 873 | 187.9 |
| A | 9 | 191 | 10523 | 51.37 | 895 | 873 | 187.9 |
| B | 0 | 171 | 104865 | 581.4 | 897 | 866 | 178.9 |
| B | 5 | 172 | 90266 | 499.78 | 897 | 866 | 178.9 |
| B | 12 | 48 | 60234 | 331.89 | 897 | 866 | 178.9 |
| C | 1 | 3 | 115887 | 539.84 | 897 | 901 | 213.0 |
| C | 14 | 254 | 99781 | 464.22 | 897 | 901 | 213.0 |
| C | 3 | 233 | 38639 | 177.17 | 897 | 901 | 213.0 |
| D | 1 | 52 | 654481 | 2935.14 | 885 | 858 | 222.7 |
| D | 11 | 241 | 378778 | 1697.08 | 885 | 858 | 222.7 |
| D | 13 | 249 | 202321 | 904.68 | 885 | 858 | 222.7 |
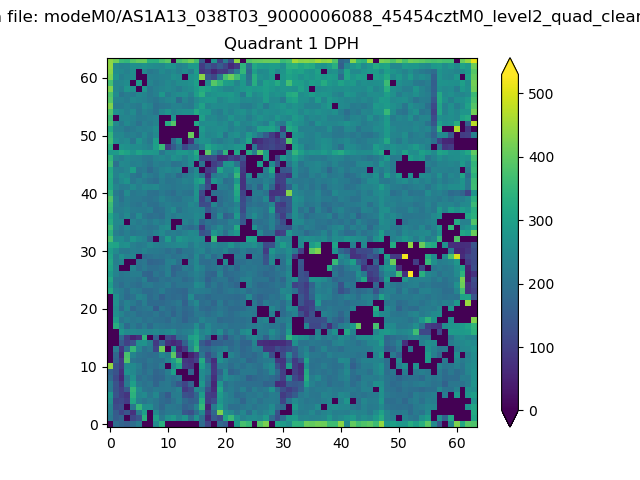
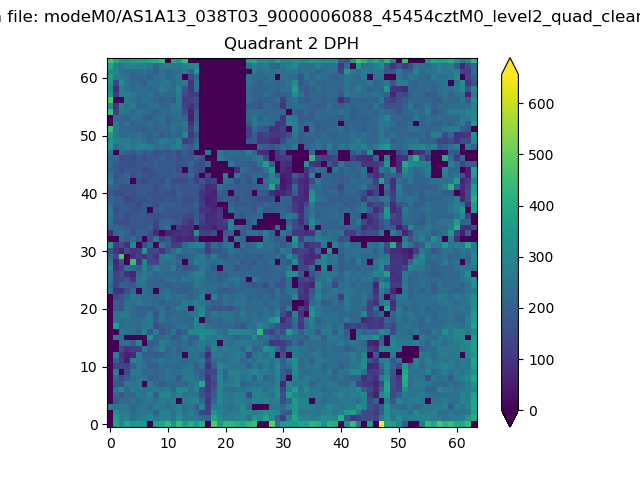
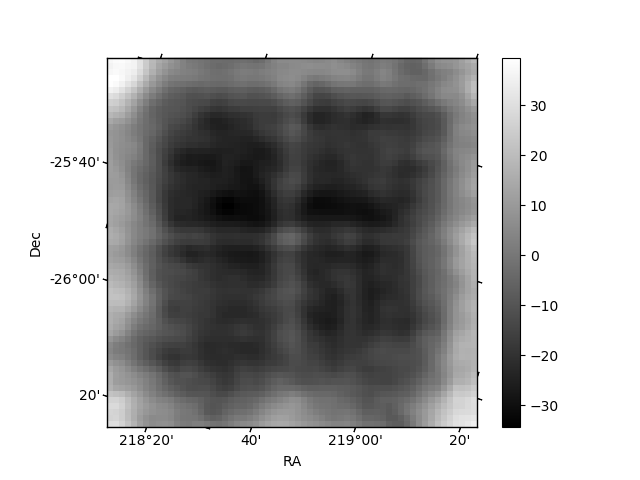
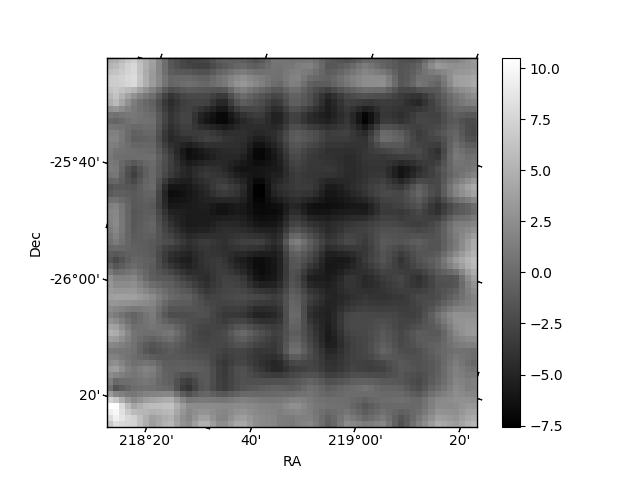
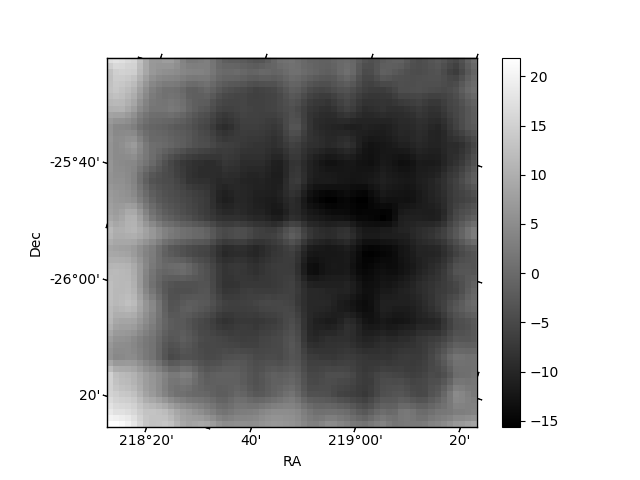
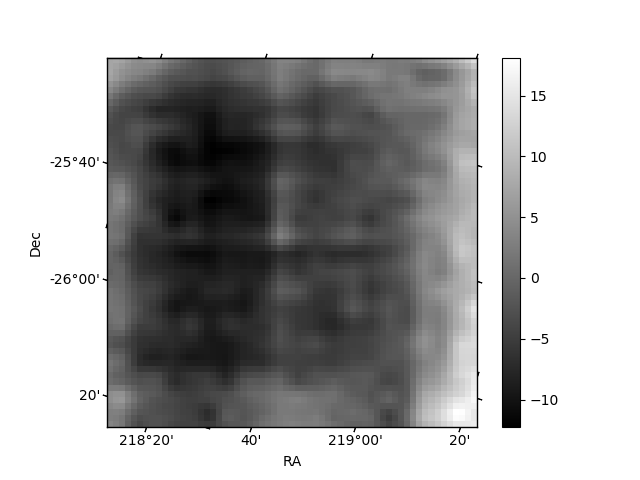
Histogram calculated using DETX and DETY for each event in the final _common_clean file
| Quadrant A | 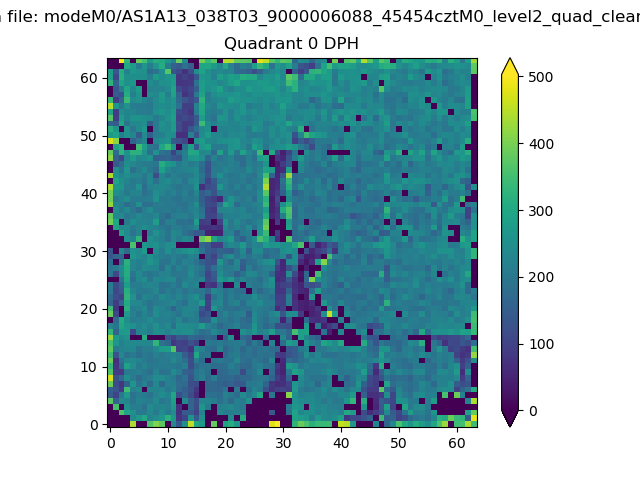 |
 |
Quadrant B |
|---|---|---|---|
| Quadrant D | 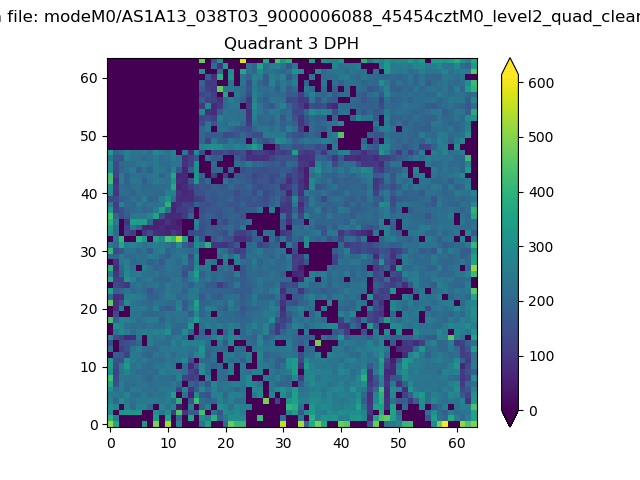 |
 |
Quadrant C |
| Plot type | Count rate plots | Images |
|---|---|---|
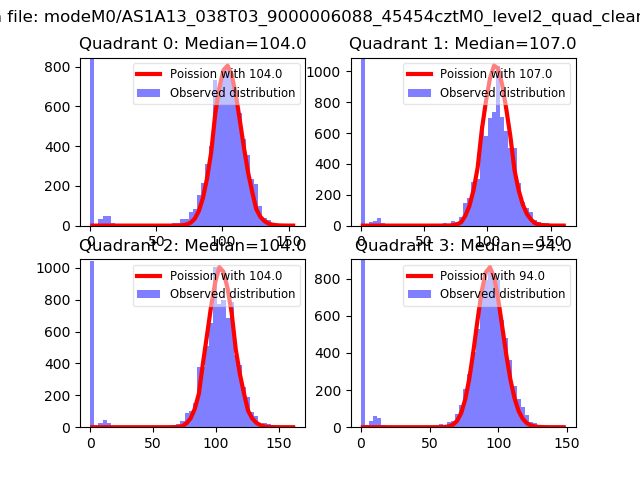
| Comparison with Poisson distribution Blue bars denote a histogram of data divided into 1 sec bins. Red curve is a Poisson curve with rate = median count rate of data. |
 |
 |
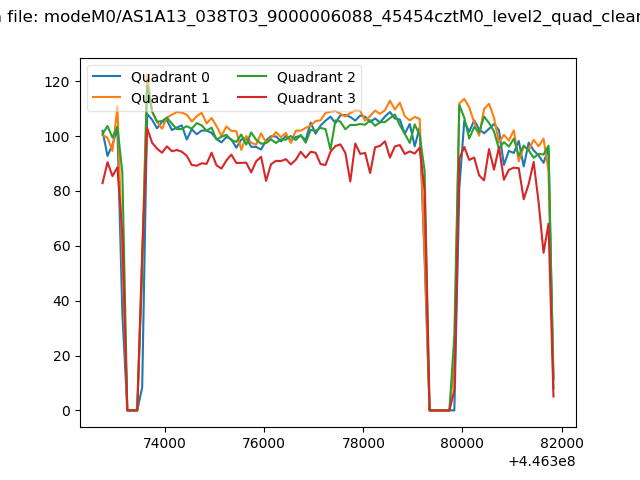
| Quadrant-wise count rates Data is divided into 100 sec bins |
 |
|
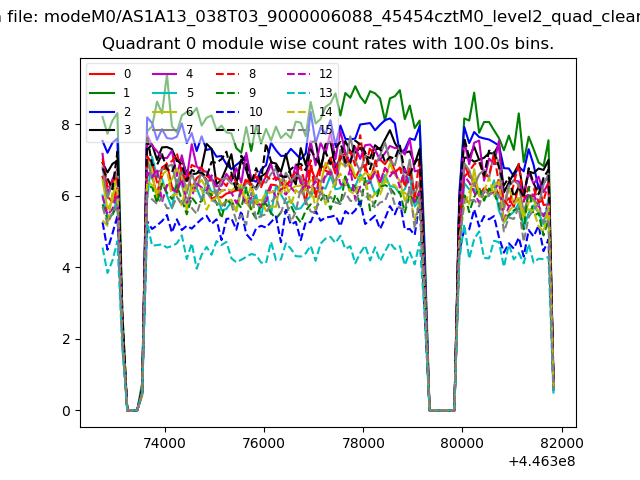
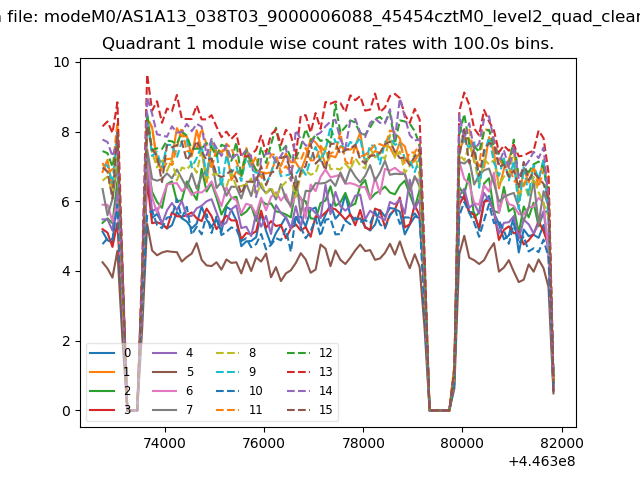
| Module-wise count rates for Quadrant A Data is divided into 100 sec bins |
 |
 |
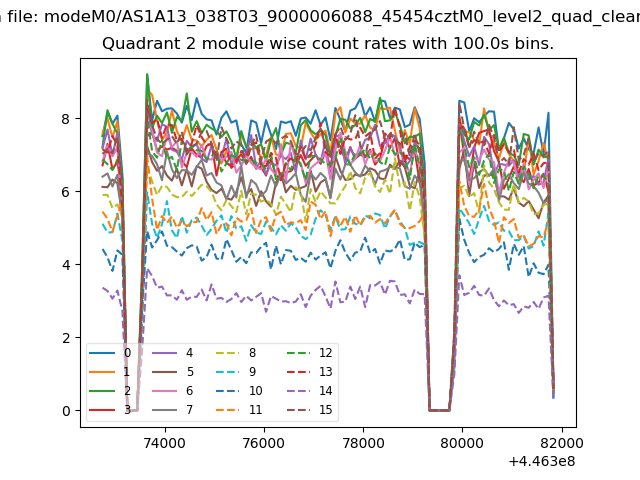
| Module-wise count rates for Quadrant B Data is divided into 100 sec bins |
 |
 |
| Module-wise count rates for Quadrant C Data is divided into 100 sec bins |
 |
 |
| Module-wise count rates for Quadrant D Data is divided into 100 sec bins |
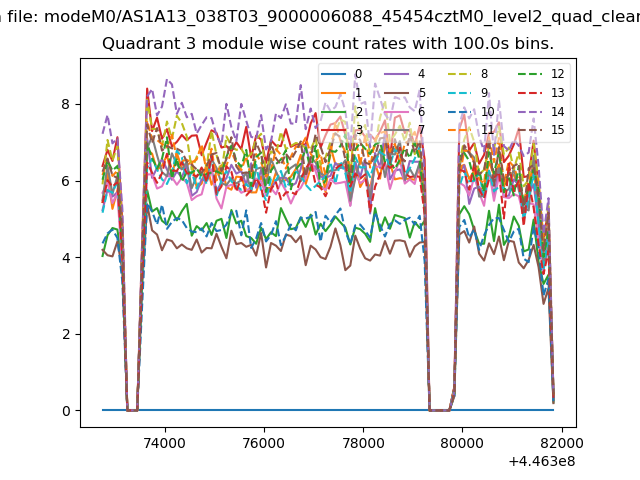 |
 |
| Parameter | Plot |
|---|---|
| CZT HV Monitor | 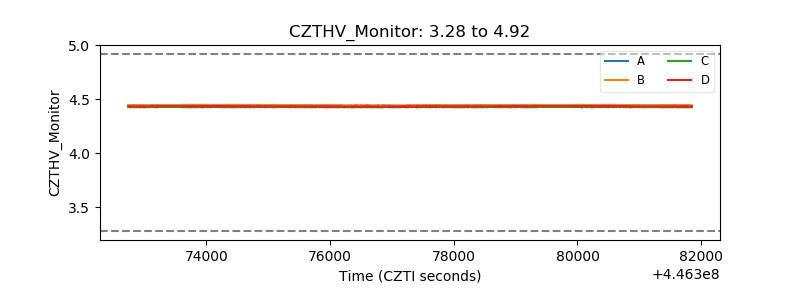 |
| D_VDD | 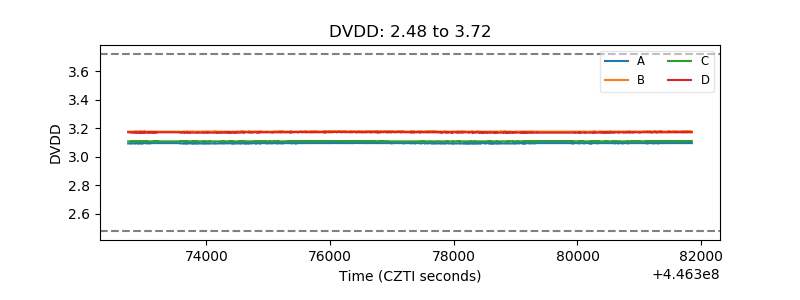 |
| Temperature 1 | 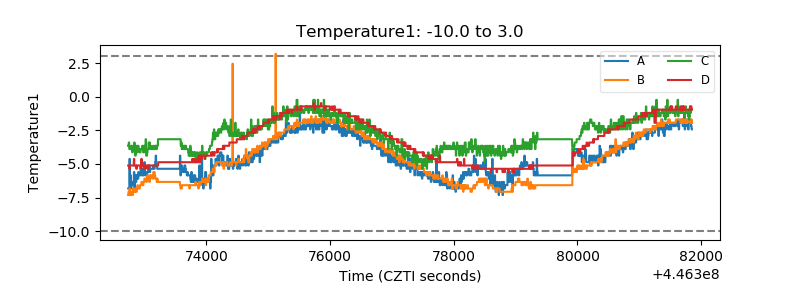 |
| Veto HV Monitor | 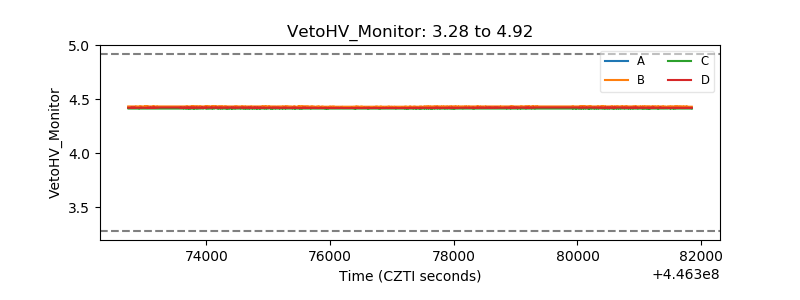 |
| Veto LLD | 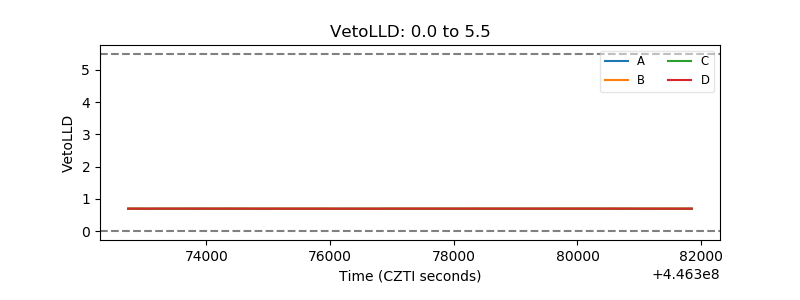 |
| Alpha Counter | 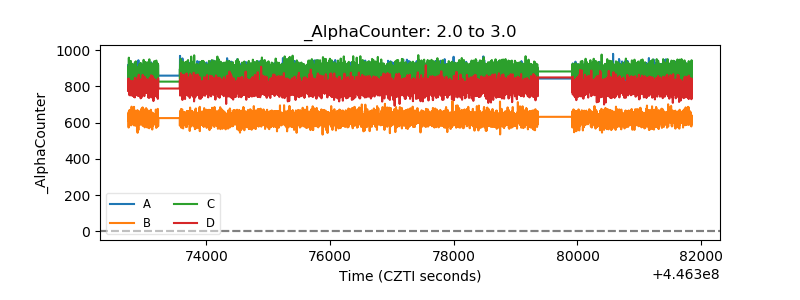 |
| _CPM_Rate | 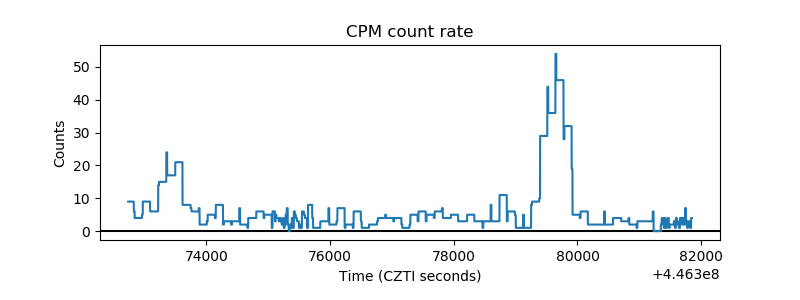 |
| CZT Counter | 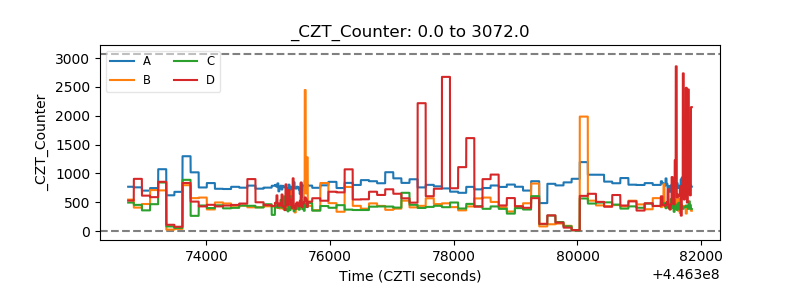 |
| +2.5 Volts monitor |  |
| +5 Volts monitor |  |
| _ROLL_ROT | 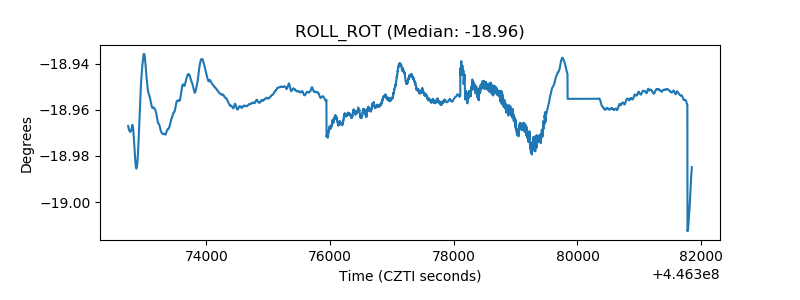 |
| _Roll_DEC | 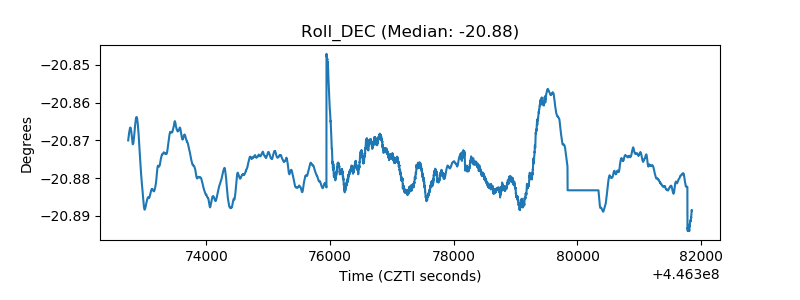 |
| _Roll_RA | 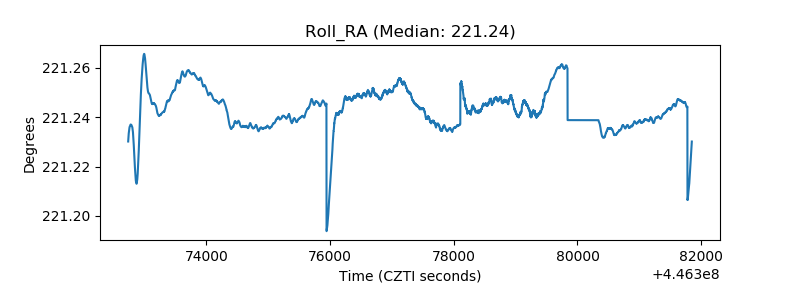 |
| Veto Counter | 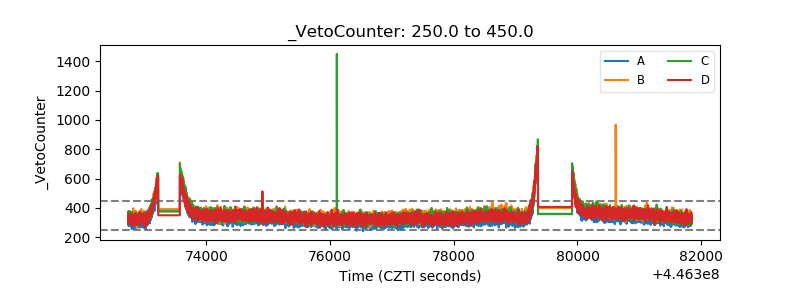 |