| Param | Original file | Final file |
|---|---|---|
| Filename | modeM0/AS1A13_038T03_9000006088_45457cztM0_level2.fits | modeM0/AS1A13_038T03_9000006088_45457cztM0_level2_quad_clean.evt |
| Size (bytes) | 481,579,200 | 110,007,360 |
| Size | 459.3 MB | 104.9 MB |
| Events in quadrant A | 6,081,582 | 714,797 |
| Events in quadrant B | 3,984,699 | 749,687 |
| Events in quadrant C | 3,093,475 | 736,893 |
| Events in quadrant D | 4,149,341 | 664,640 |
| Mode M9 | |||
|---|---|---|---|
| Quadrant | BADHDUFLAG | Total packets | Discarded packets |
| A | 0 | 13 | 0 |
| B | 0 | 14 | 0 |
| C | 0 | 14 | 0 |
| D | 0 | 14 | 0 |
| Mode M0 | |||
|---|---|---|---|
| Quadrant | BADHDUFLAG | Total packets | Discarded packets |
| A | 0 | 22746 | 4 |
| B | 0 | 16337 | 2 |
| C | 0 | 13885 | 2 |
| D | 0 | 16895 | 2 |
| Mode SS | |||
|---|---|---|---|
| Quadrant | BADHDUFLAG | Total packets | Discarded packets |
| A | 0 | 136 | 0 |
| B | 0 | 136 | 0 |
| C | 0 | 136 | 0 |
| D | 0 | 136 | 0 |
| Quadrant | Total seconds | Saturated seconds | Saturation percentage |
|---|---|---|---|
| A | 6666 | 349 | 5.235524% |
| B | 6666 | 234 | 3.510351% |
| C | 6666 | 74 | 1.110111% |
| D | 6666 | 170 | 2.550255% |
Noise dominated data is calculated using 1-second bins in cleaned event files. If a bin has >2000 counts, and if more than 50% of those come from <1% of pixels, then it is considered to be noise-dominated and hence unusable.
| Quadrant | # 1 sec bins | Bins with >0 counts | Bins with >2000 counts | High rate bins dominated by noise | Noise dominated (total time) | Noise dominated (detector-on time) | Marked lightcurve |
|---|---|---|---|---|---|---|---|
| A | 7741 | 6667 | 123 | 123 | 1.59% | 1.84% | 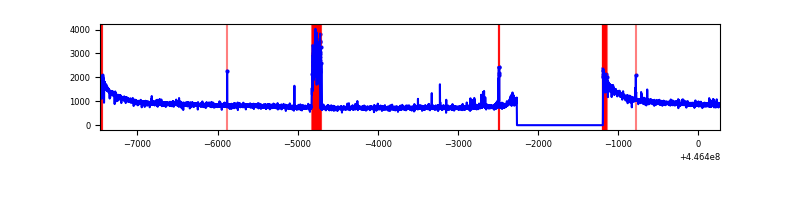 |
| B | 7741 | 6667 | 100 | 100 | 1.29% | 1.50% | 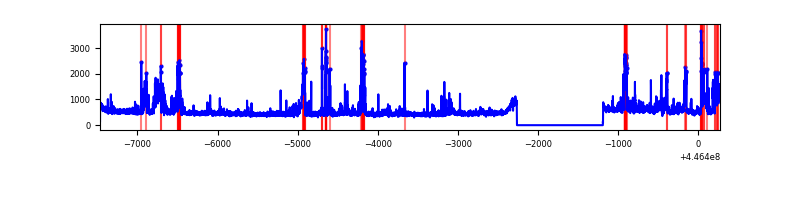 |
| C | 7741 | 6667 | 13 | 13 | 0.17% | 0.19% | 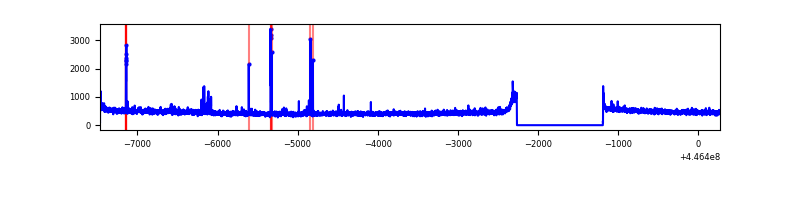 |
| D | 7741 | 6667 | 95 | 95 | 1.23% | 1.42% | 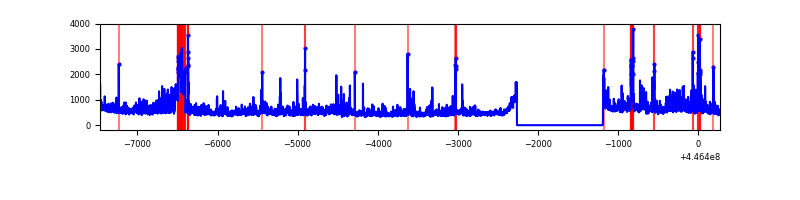 |
Top three noisy pixels from each quadrant. If the there are fewer than three noisy pixels in the level2.evt file, extra rows are filled as -1
| Pixel properties | Quadrant properties | ||||||
|---|---|---|---|---|---|---|---|
| Quadrant | DetID | PixID | Counts | Sigma | Mean | Median | Sigma |
| A | 10 | 83 | 2807990 | 17735.03 | 762 | 745 | 158.3 |
| A | 10 | 255 | 254954 | 1605.99 | 762 | 745 | 158.3 |
| A | 2 | 79 | 30526 | 188.14 | 762 | 745 | 158.3 |
| B | 15 | 201 | 629524 | 4161.88 | 764 | 741 | 151.1 |
| B | 5 | 172 | 88198 | 578.87 | 764 | 741 | 151.1 |
| B | 3 | 112 | 86983 | 570.83 | 764 | 741 | 151.1 |
| C | 3 | 233 | 51349 | 282.7 | 761 | 765 | 178.9 |
| C | 14 | 254 | 25392 | 137.64 | 761 | 765 | 178.9 |
| C | 1 | 3 | 22405 | 120.94 | 761 | 765 | 178.9 |
| D | 13 | 84 | 442024 | 2331.1 | 755 | 735 | 189.3 |
| D | 11 | 241 | 424435 | 2238.19 | 755 | 735 | 189.3 |
| D | 1 | 52 | 117626 | 617.48 | 755 | 735 | 189.3 |
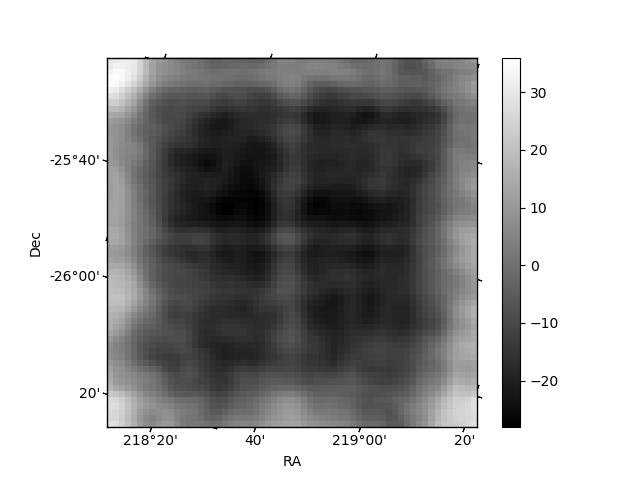
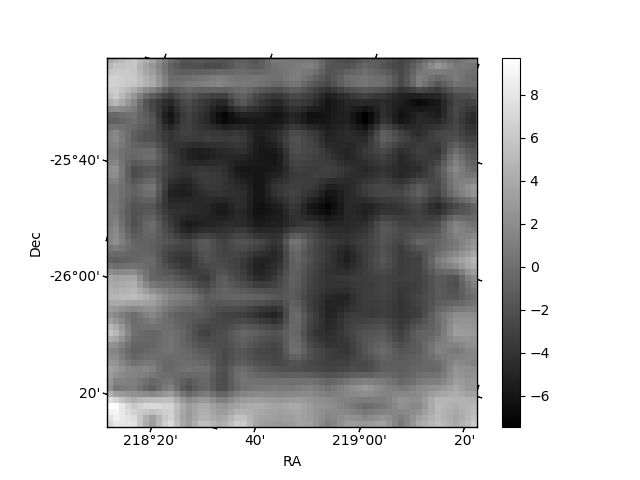
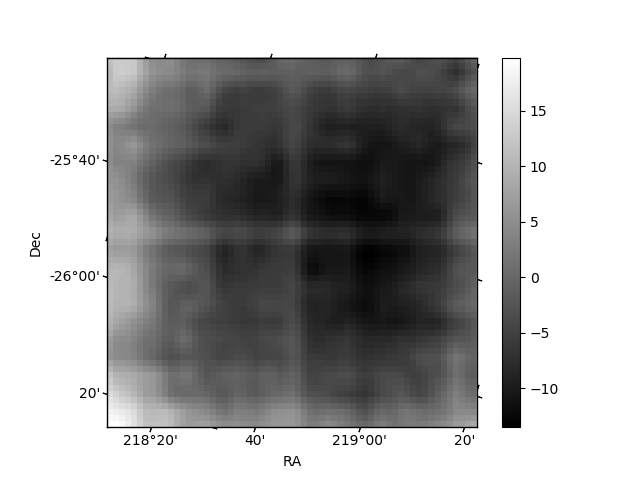
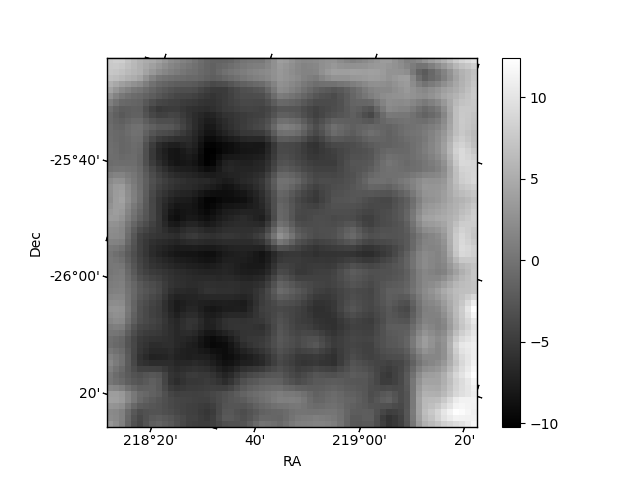
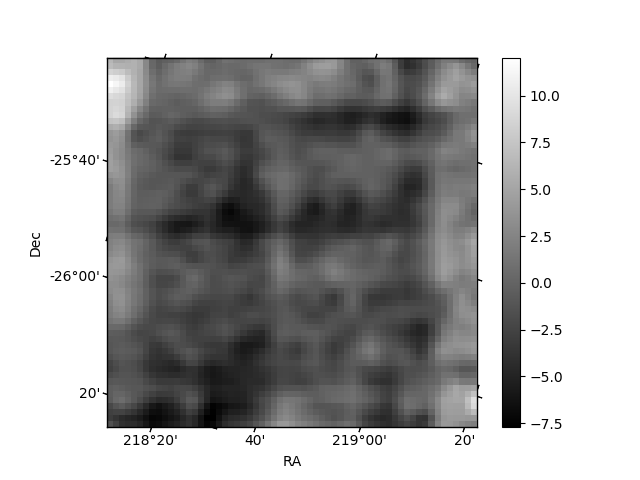
Histogram calculated using DETX and DETY for each event in the final _common_clean file
| Quadrant A | 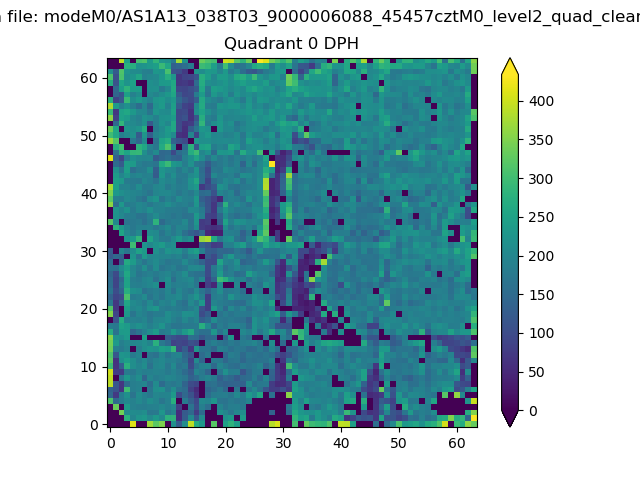 |
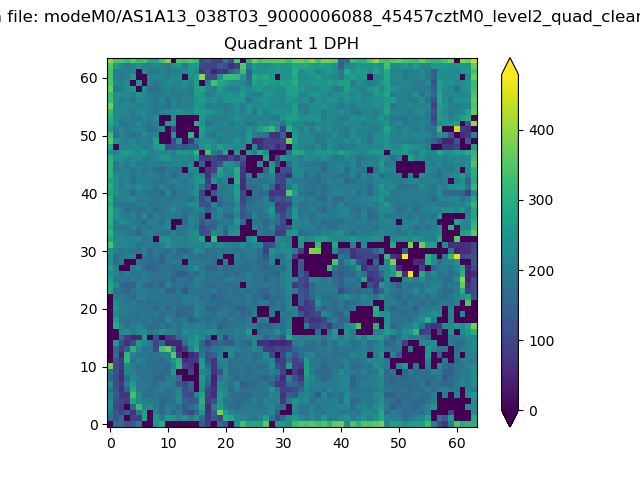 |
Quadrant B |
|---|---|---|---|
| Quadrant D | 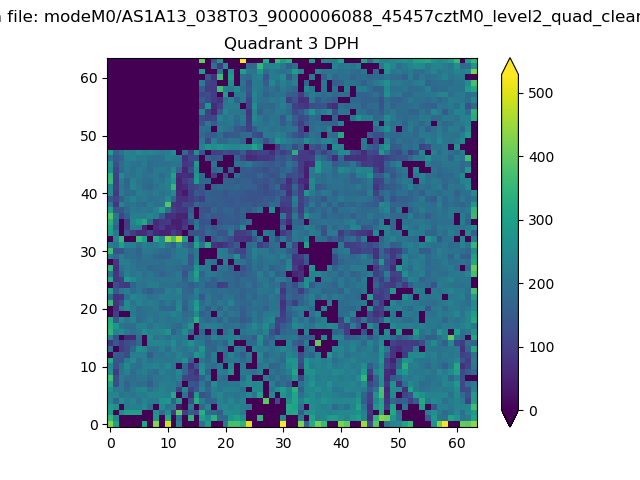 |
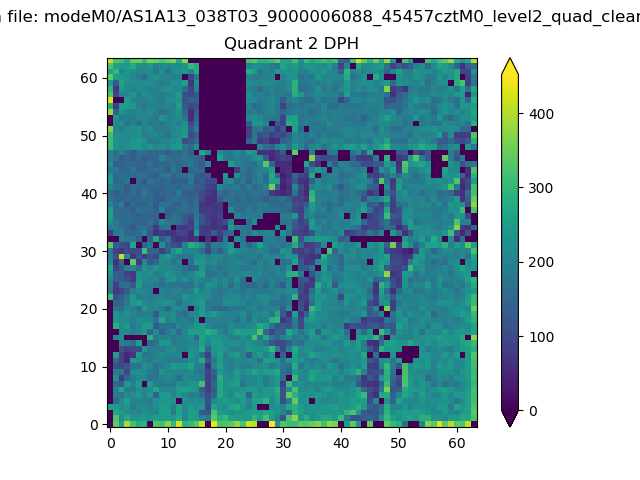 |
Quadrant C |
| Plot type | Count rate plots | Images |
|---|---|---|
| Comparison with Poisson distribution Blue bars denote a histogram of data divided into 1 sec bins. Red curve is a Poisson curve with rate = median count rate of data. |
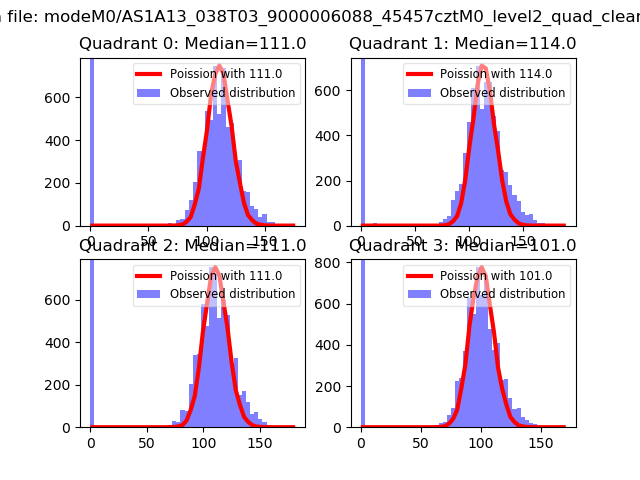 |
 |
| Quadrant-wise count rates Data is divided into 100 sec bins |
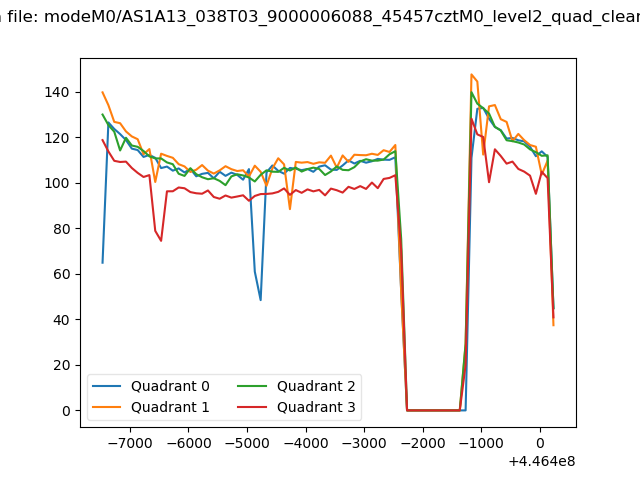 |
|
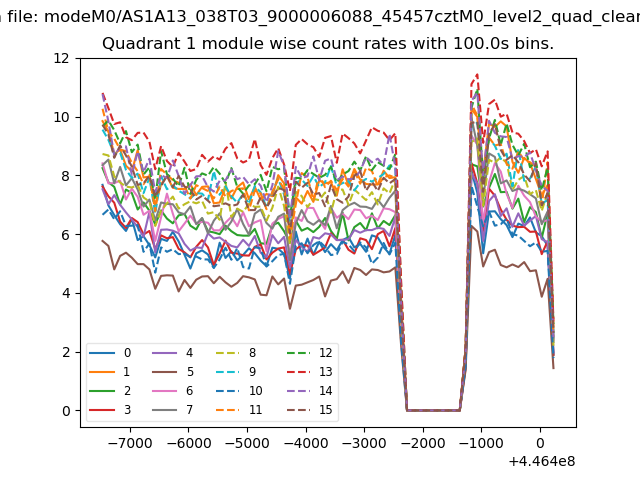
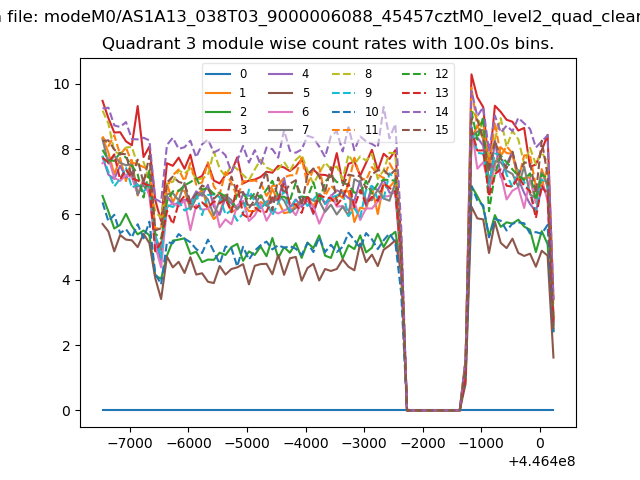
| Module-wise count rates for Quadrant A Data is divided into 100 sec bins |
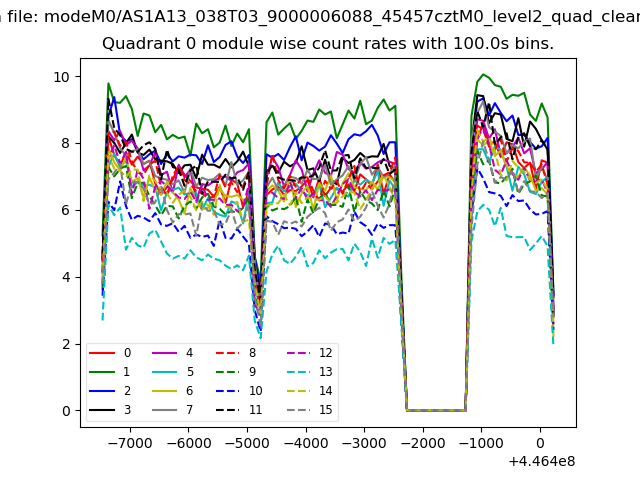 |
 |
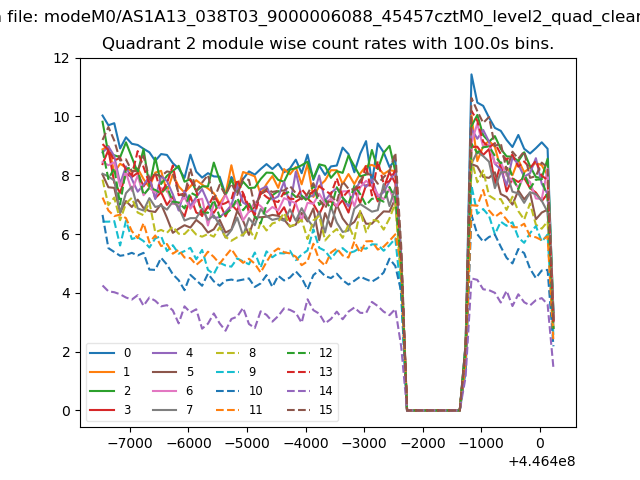
| Module-wise count rates for Quadrant B Data is divided into 100 sec bins |
 |
 |
| Module-wise count rates for Quadrant C Data is divided into 100 sec bins |
 |
 |
| Module-wise count rates for Quadrant D Data is divided into 100 sec bins |
 |
 |
| Parameter | Plot |
|---|---|
| CZT HV Monitor | 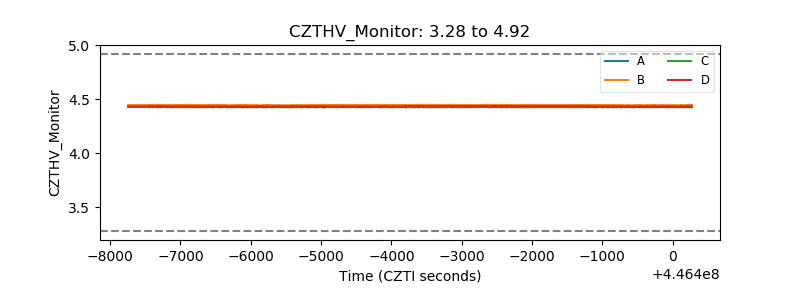 |
| D_VDD | 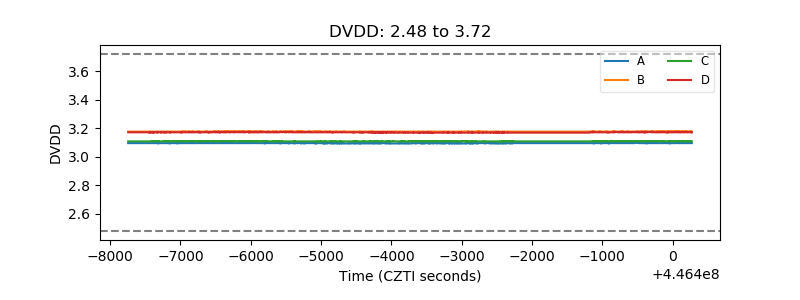 |
| Temperature 1 | 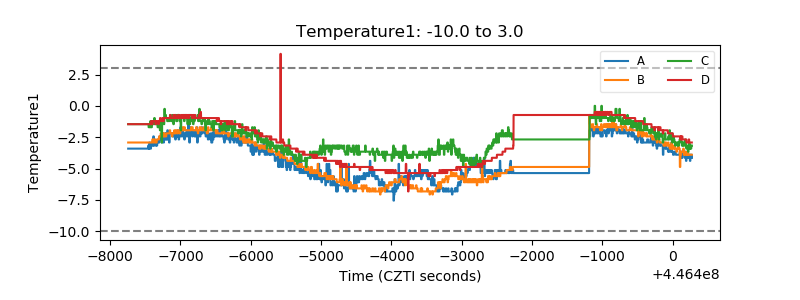 |
| Veto HV Monitor | 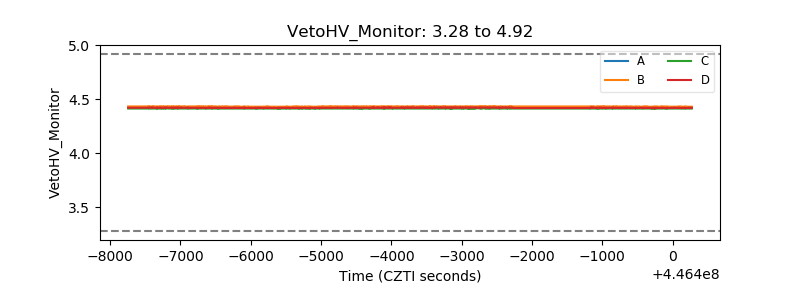 |
| Veto LLD | 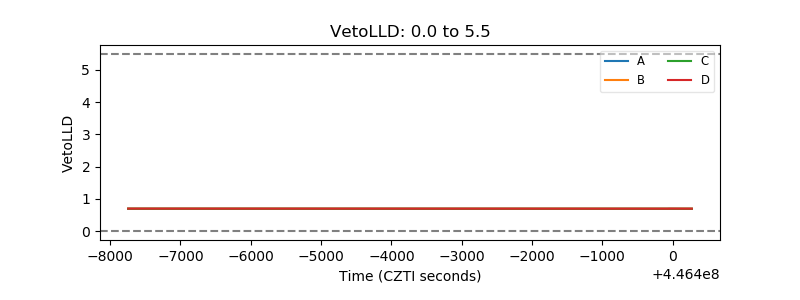 |
| Alpha Counter | 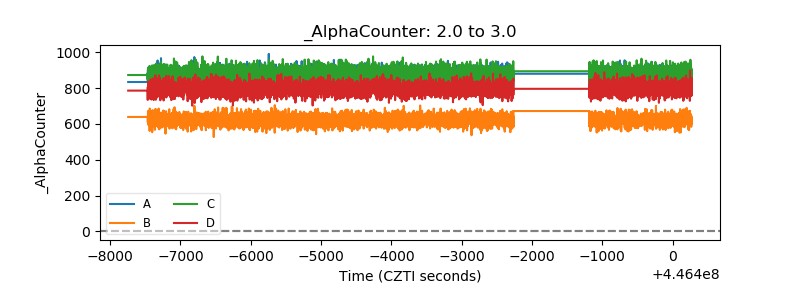 |
| _CPM_Rate | 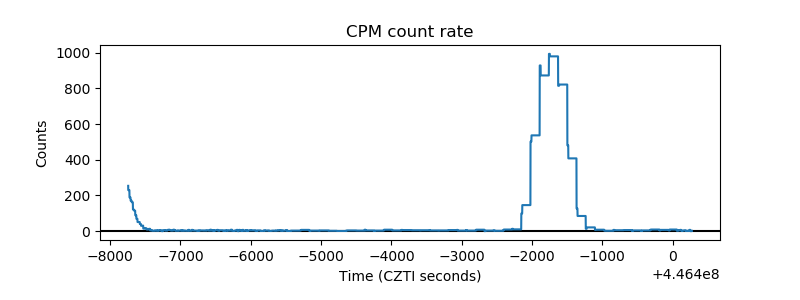 |
| CZT Counter | 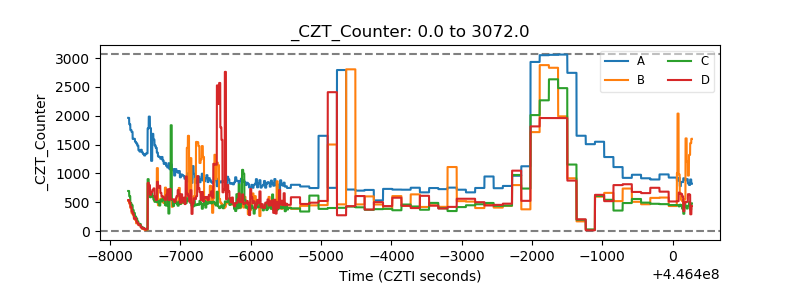 |
| +2.5 Volts monitor | 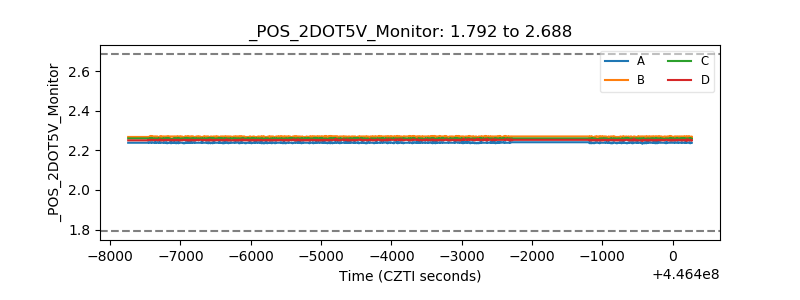 |
| +5 Volts monitor | 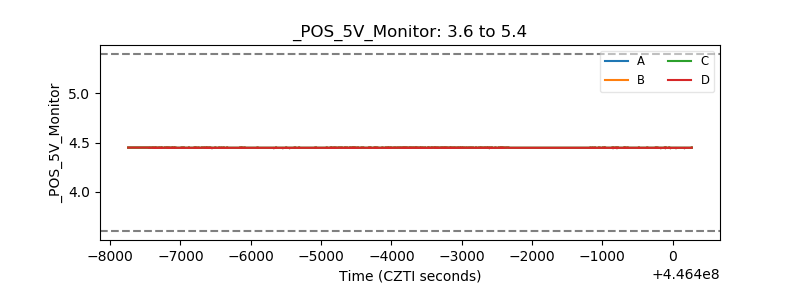 |
| _ROLL_ROT | 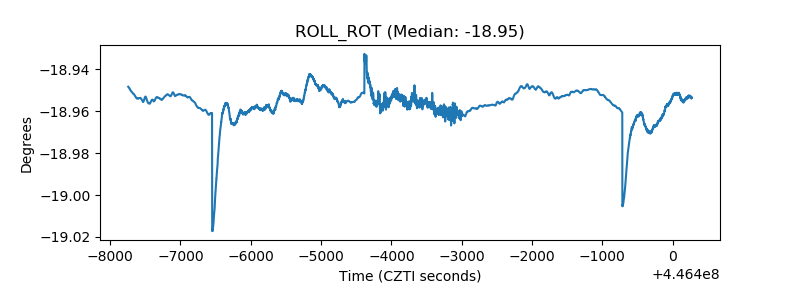 |
| _Roll_DEC | 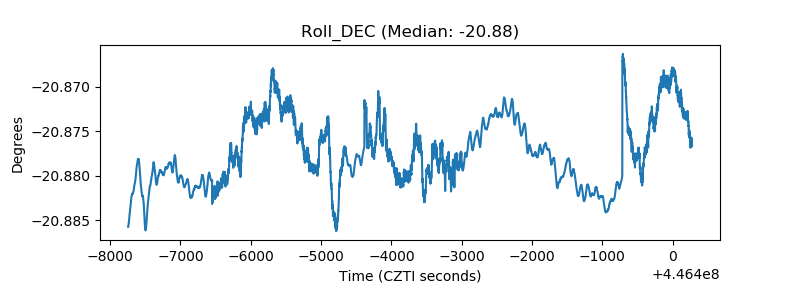 |
| _Roll_RA | 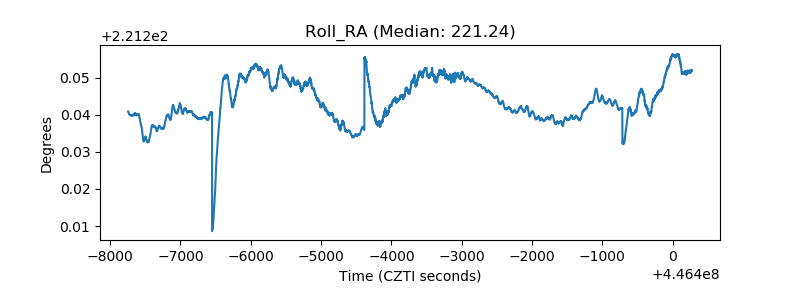 |
| Veto Counter | 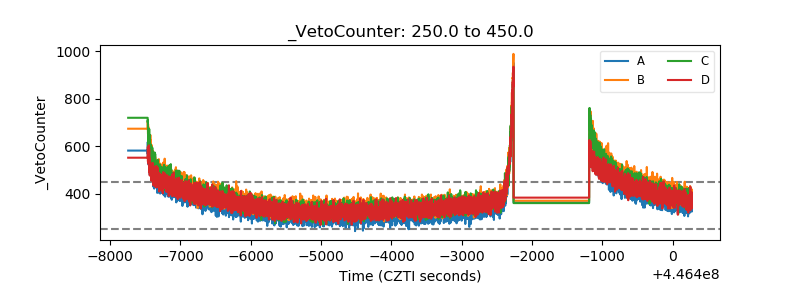 |