| Param | Original file | Final file |
|---|---|---|
| Filename | modeM0/AS1A13_038T03_9000006088_45458cztM0_level2.fits | modeM0/AS1A13_038T03_9000006088_45458cztM0_level2_quad_clean.evt |
| Size (bytes) | 461,445,120 | 109,457,280 |
| Size | 440.1 MB | 104.4 MB |
| Events in quadrant A | 5,723,557 | 727,346 |
| Events in quadrant B | 3,956,721 | 749,182 |
| Events in quadrant C | 2,939,953 | 735,580 |
| Events in quadrant D | 3,967,092 | 658,143 |
| Mode M9 | |||
|---|---|---|---|
| Quadrant | BADHDUFLAG | Total packets | Discarded packets |
| A | 0 | 17 | 0 |
| B | 0 | 18 | 0 |
| C | 0 | 18 | 0 |
| D | 0 | 18 | 0 |
| Mode M0 | |||
|---|---|---|---|
| Quadrant | BADHDUFLAG | Total packets | Discarded packets |
| A | 0 | 21614 | 2 |
| B | 0 | 16052 | 2 |
| C | 0 | 13117 | 2 |
| D | 0 | 16214 | 2 |
| Mode SS | |||
|---|---|---|---|
| Quadrant | BADHDUFLAG | Total packets | Discarded packets |
| A | 0 | 130 | 0 |
| B | 0 | 130 | 0 |
| C | 0 | 130 | 0 |
| D | 0 | 130 | 0 |
| Quadrant | Total seconds | Saturated seconds | Saturation percentage |
|---|---|---|---|
| A | 6361 | 261 | 4.103128% |
| B | 6360 | 274 | 4.308176% |
| C | 6360 | 35 | 0.550314% |
| D | 6360 | 166 | 2.610063% |
Noise dominated data is calculated using 1-second bins in cleaned event files. If a bin has >2000 counts, and if more than 50% of those come from <1% of pixels, then it is considered to be noise-dominated and hence unusable.
| Quadrant | # 1 sec bins | Bins with >0 counts | Bins with >2000 counts | High rate bins dominated by noise | Noise dominated (total time) | Noise dominated (detector-on time) | Marked lightcurve |
|---|---|---|---|---|---|---|---|
| A | 7531 | 6362 | 31 | 31 | 0.41% | 0.49% | 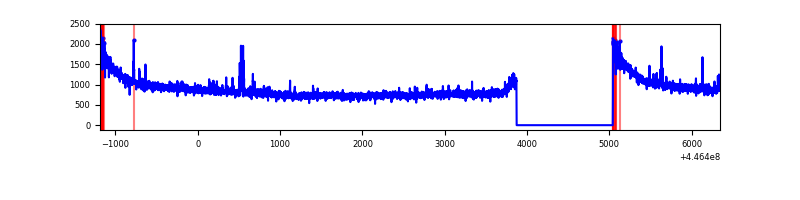 |
| B | 7530 | 6361 | 90 | 90 | 1.20% | 1.41% | 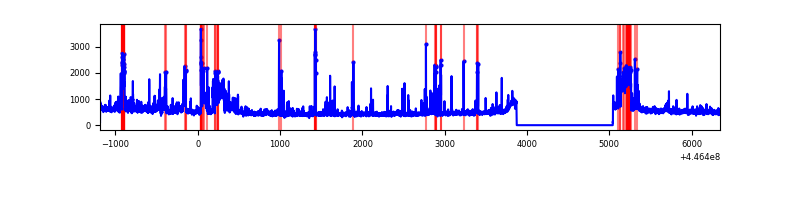 |
| C | 7530 | 6361 | 0 | 0 | 0.00% | 0.00% | 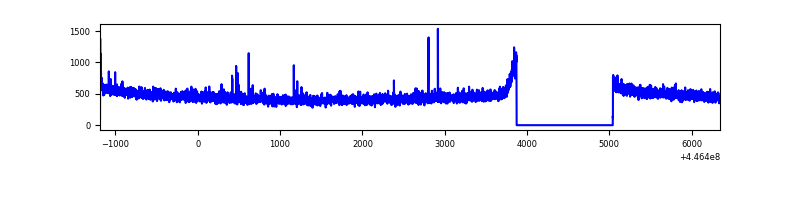 |
| D | 7530 | 6361 | 89 | 89 | 1.18% | 1.40% | 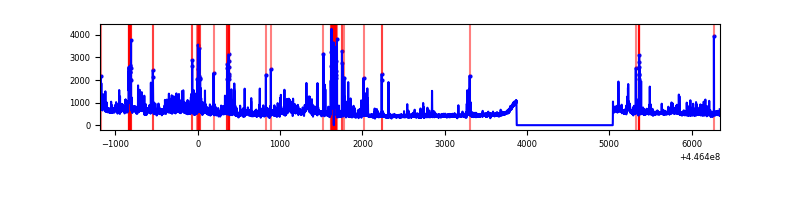 |
Top three noisy pixels from each quadrant. If the there are fewer than three noisy pixels in the level2.evt file, extra rows are filled as -1
| Pixel properties | Quadrant properties | ||||||
|---|---|---|---|---|---|---|---|
| Quadrant | DetID | PixID | Counts | Sigma | Mean | Median | Sigma |
| A | 10 | 83 | 2730488 | 17835.89 | 747 | 730 | 153.0 |
| A | 2 | 79 | 33000 | 210.85 | 747 | 730 | 153.0 |
| A | 13 | 248 | 32966 | 210.63 | 747 | 730 | 153.0 |
| B | 15 | 201 | 729597 | 4960.84 | 747 | 727 | 146.9 |
| B | 12 | 48 | 96073 | 648.95 | 747 | 727 | 146.9 |
| B | 3 | 112 | 56797 | 381.62 | 747 | 727 | 146.9 |
| C | 3 | 233 | 21327 | 118.84 | 742 | 746 | 173.2 |
| C | 1 | 3 | 10441 | 55.98 | 742 | 746 | 173.2 |
| C | 9 | 237 | 5861 | 29.53 | 742 | 746 | 173.2 |
| D | 1 | 52 | 365572 | 1993.89 | 729 | 707 | 183.0 |
| D | 11 | 241 | 287768 | 1568.71 | 729 | 707 | 183.0 |
| D | 13 | 249 | 193171 | 1051.76 | 729 | 707 | 183.0 |
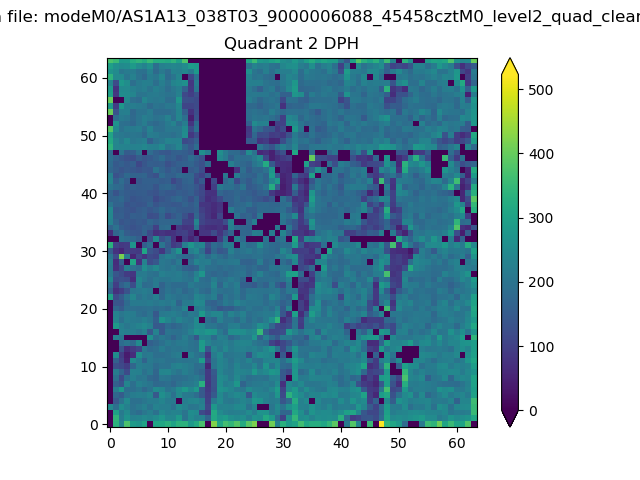
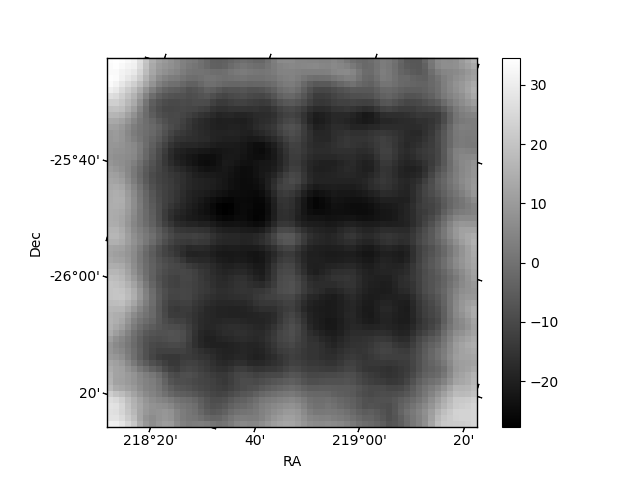
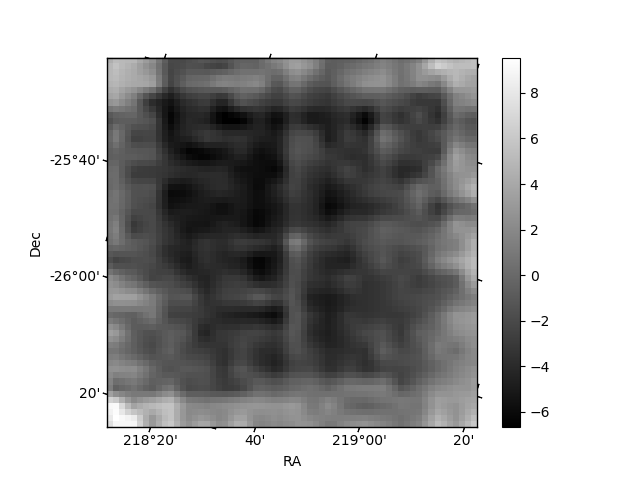
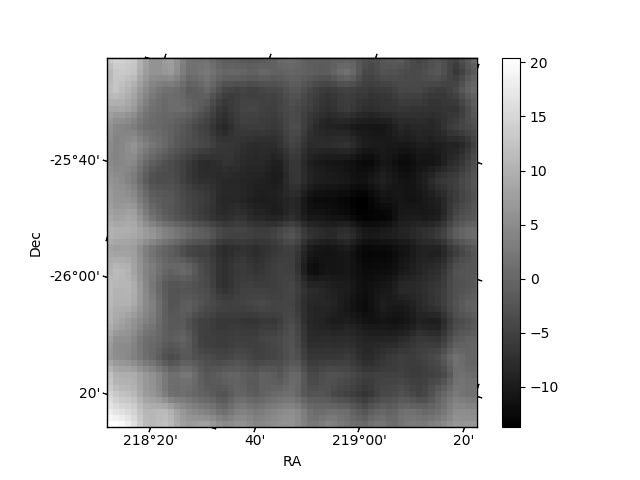
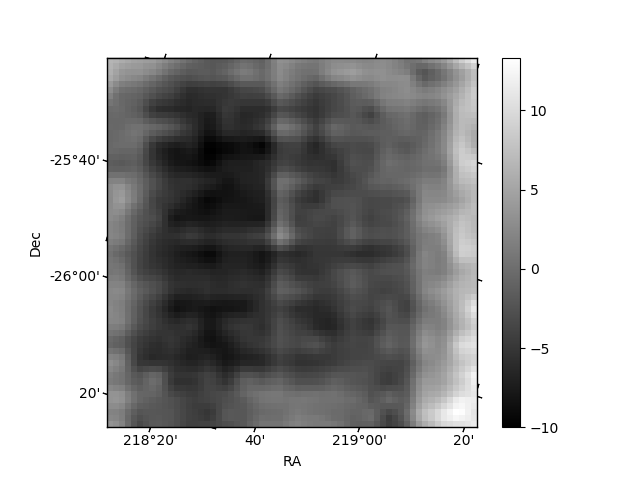
Histogram calculated using DETX and DETY for each event in the final _common_clean file
| Quadrant A | 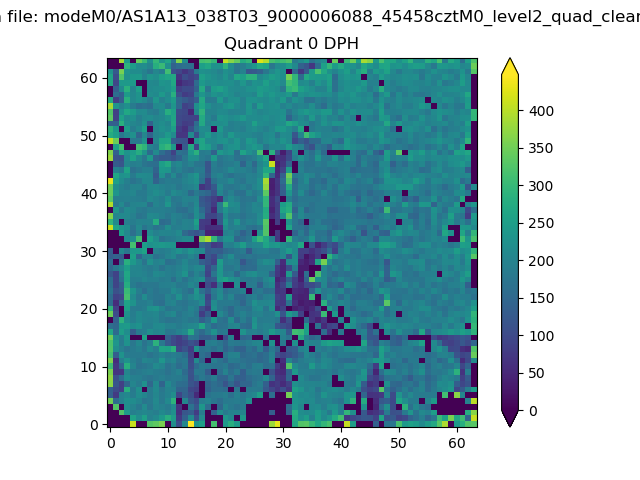 |
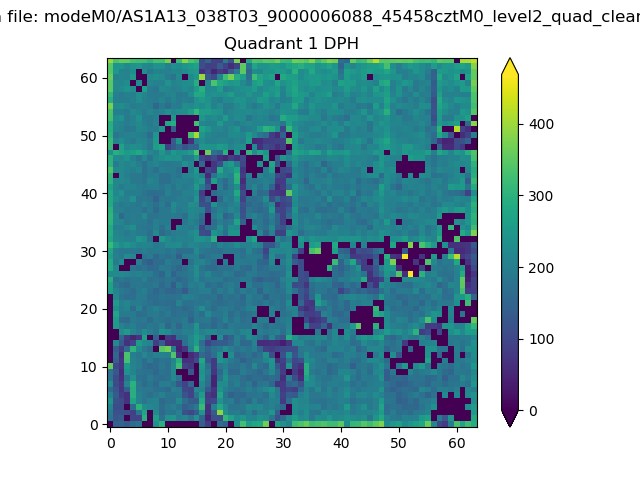 |
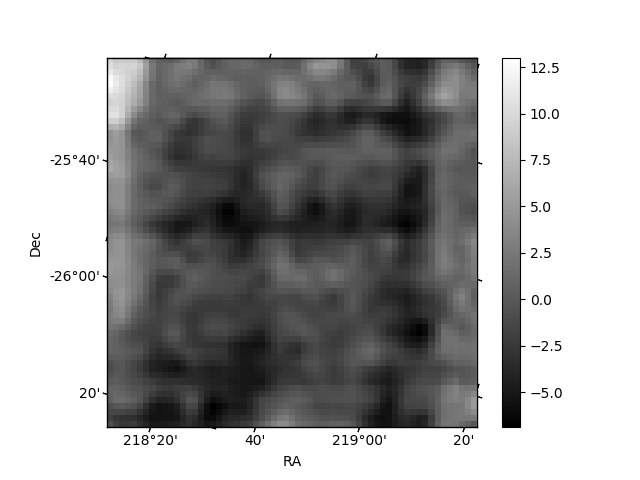
Quadrant B |
|---|---|---|---|
| Quadrant D | 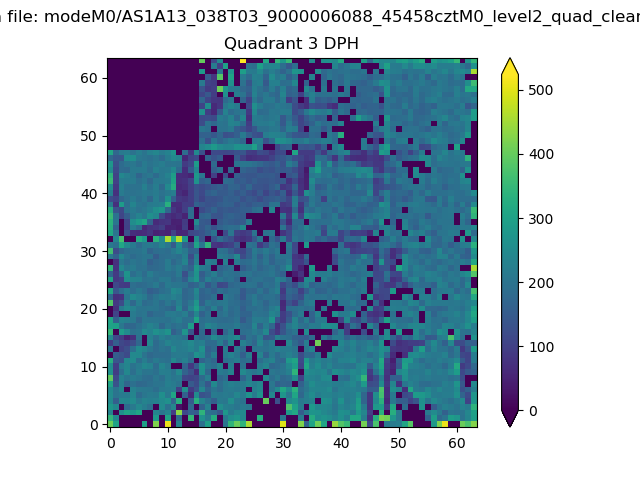 |
 |
Quadrant C |
| Plot type | Count rate plots | Images |
|---|---|---|
| Comparison with Poisson distribution Blue bars denote a histogram of data divided into 1 sec bins. Red curve is a Poisson curve with rate = median count rate of data. |
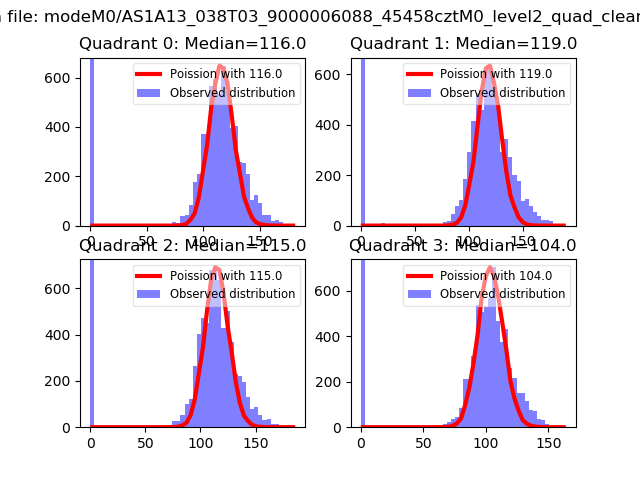 |
 |
| Quadrant-wise count rates Data is divided into 100 sec bins |
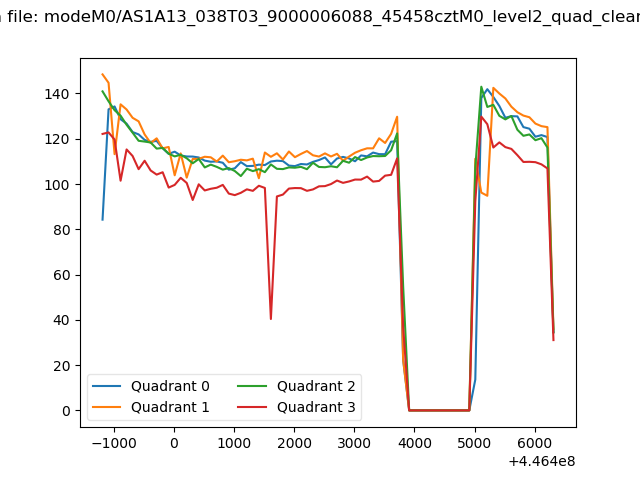 |
|
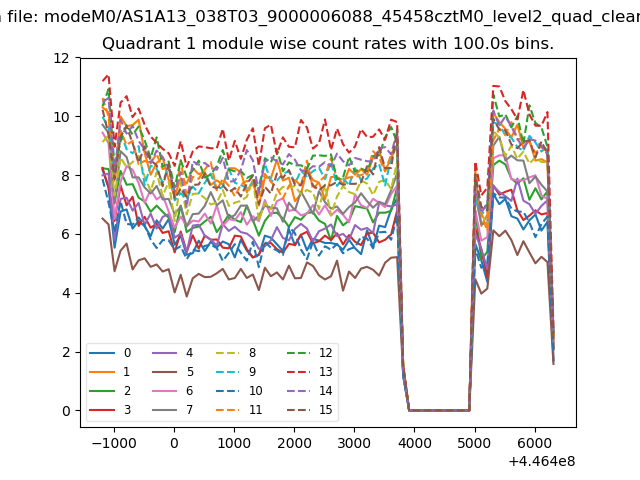
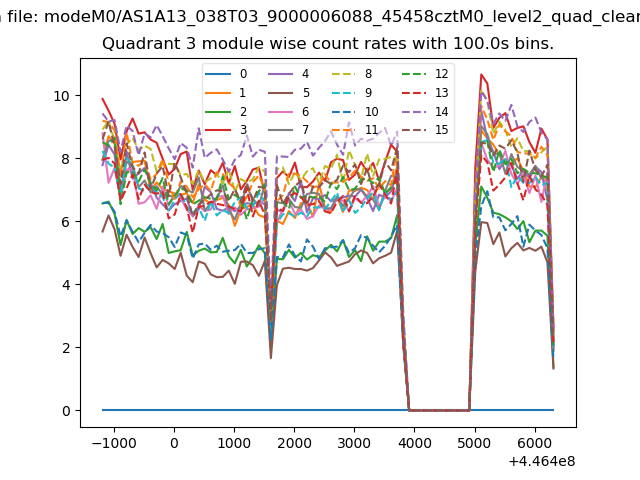
| Module-wise count rates for Quadrant A Data is divided into 100 sec bins |
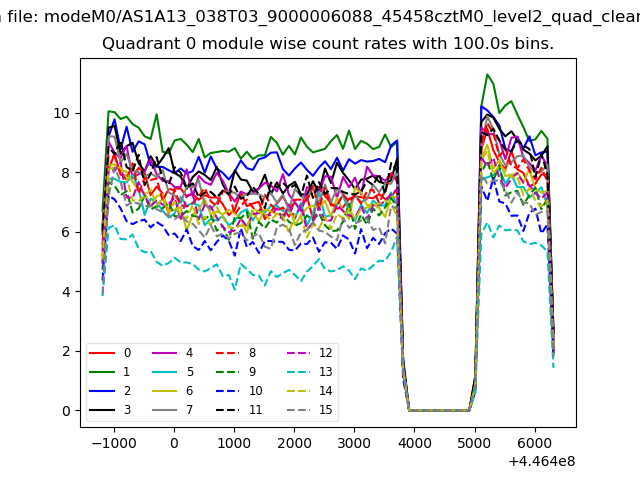 |
 |
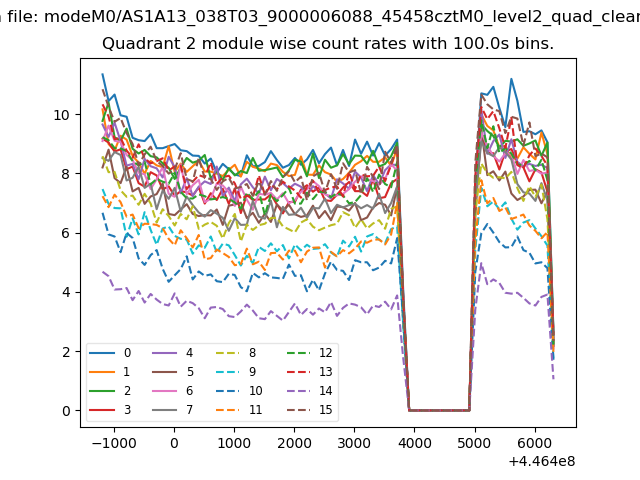
| Module-wise count rates for Quadrant B Data is divided into 100 sec bins |
 |
 |
| Module-wise count rates for Quadrant C Data is divided into 100 sec bins |
 |
 |
| Module-wise count rates for Quadrant D Data is divided into 100 sec bins |
 |
 |
| Parameter | Plot |
|---|---|
| CZT HV Monitor | 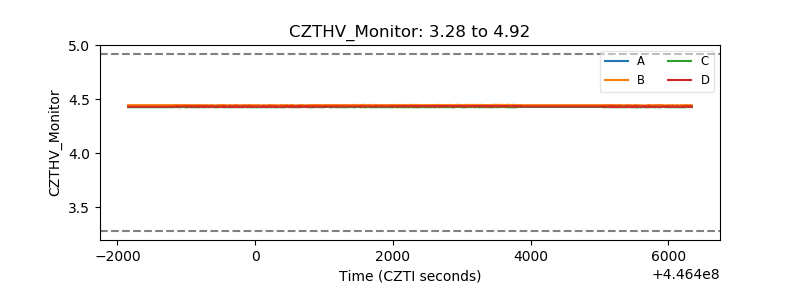 |
| D_VDD | 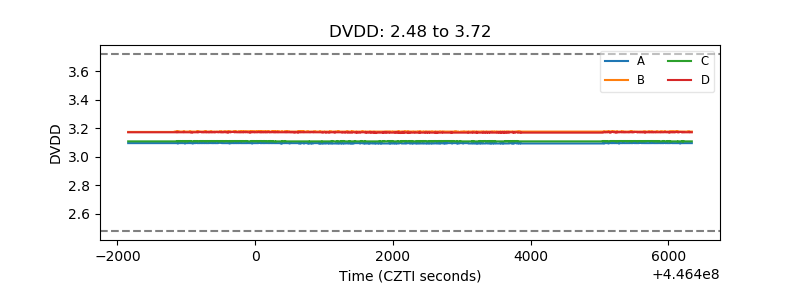 |
| Temperature 1 | 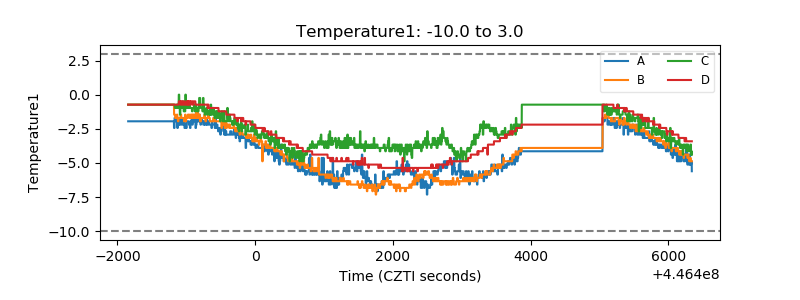 |
| Veto HV Monitor | 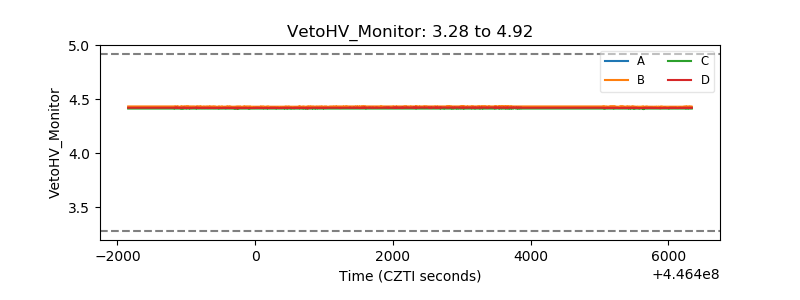 |
| Veto LLD | 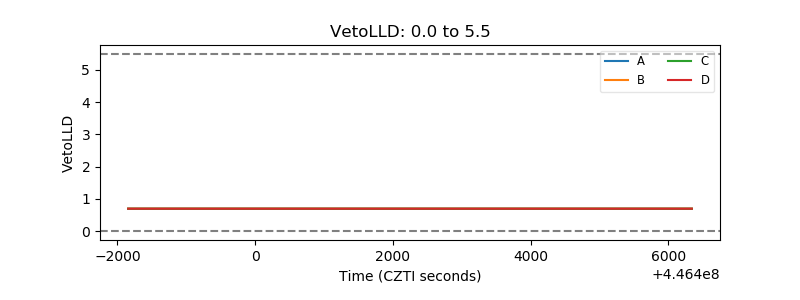 |
| Alpha Counter | 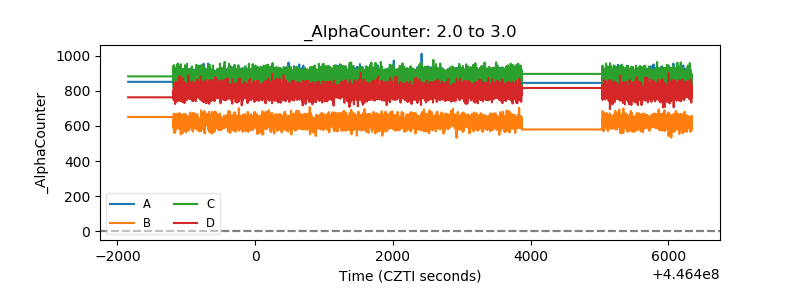 |
| _CPM_Rate | 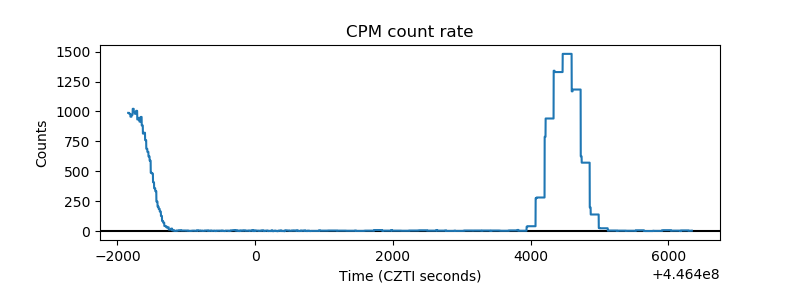 |
| CZT Counter | 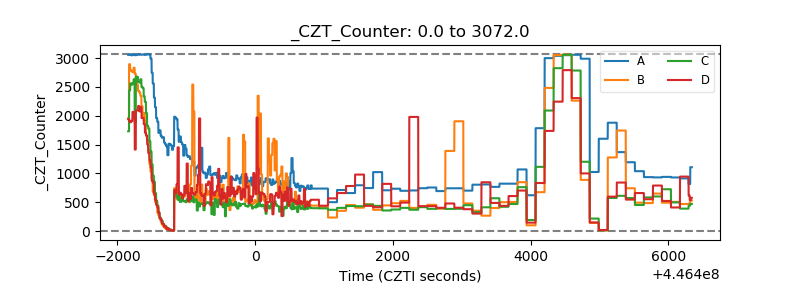 |
| +2.5 Volts monitor | 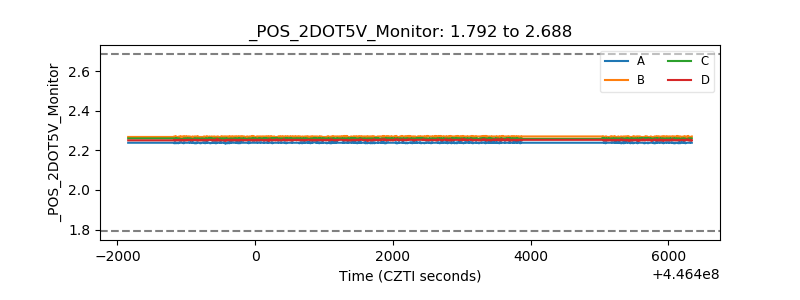 |
| +5 Volts monitor | 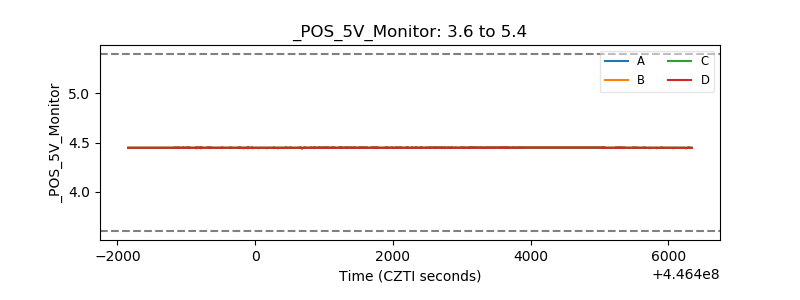 |
| _ROLL_ROT | 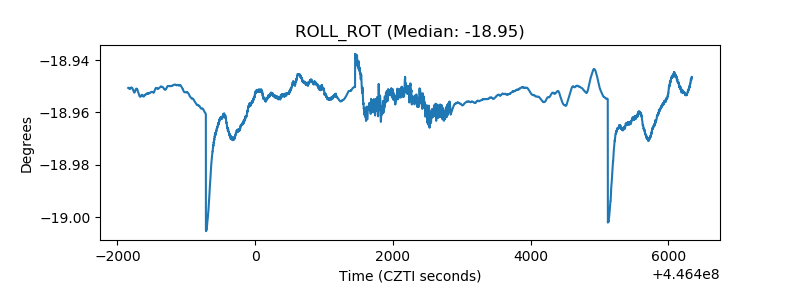 |
| _Roll_DEC | 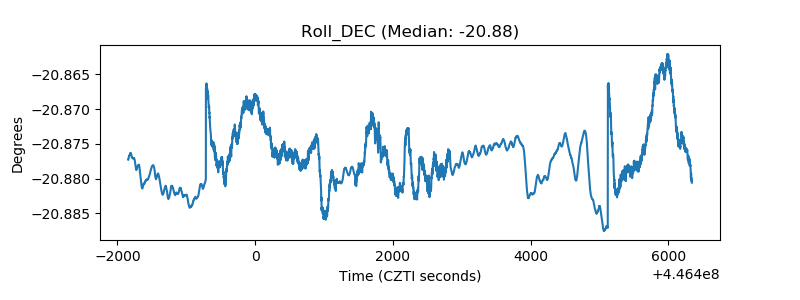 |
| _Roll_RA | 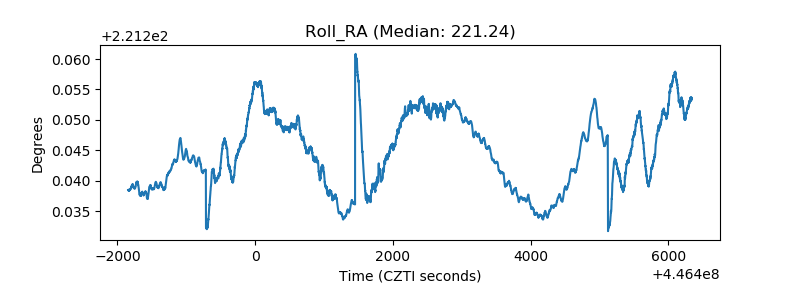 |
| Veto Counter | 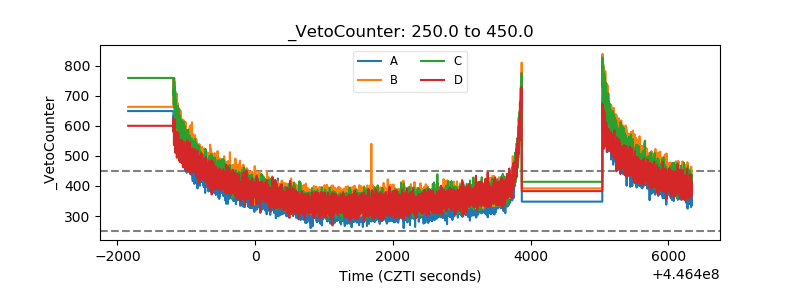 |