| Param | Original file | Final file |
|---|---|---|
| Filename | modeM0/AS1A13_038T03_9000006088_45460cztM0_level2.fits | modeM0/AS1A13_038T03_9000006088_45460cztM0_level2_quad_clean.evt |
| Size (bytes) | 174,458,880 | 43,692,480 |
| Size | 166.4 MB | 41.7 MB |
| Events in quadrant A | 2,215,675 | 288,647 |
| Events in quadrant B | 1,281,564 | 307,900 |
| Events in quadrant C | 1,217,270 | 290,679 |
| Events in quadrant D | 1,553,253 | 261,898 |
| Mode M9 | |||
|---|---|---|---|
| Quadrant | BADHDUFLAG | Total packets | Discarded packets |
| A | 0 | 12 | 0 |
| B | 0 | 13 | 0 |
| C | 0 | 13 | 0 |
| D | 0 | 13 | 0 |
| Mode M0 | |||
|---|---|---|---|
| Quadrant | BADHDUFLAG | Total packets | Discarded packets |
| A | 0 | 8388 | 1 |
| B | 0 | 5356 | 1 |
| C | 0 | 5253 | 1 |
| D | 0 | 6345 | 1 |
| Mode SS | |||
|---|---|---|---|
| Quadrant | BADHDUFLAG | Total packets | Discarded packets |
| A | 0 | 50 | 0 |
| B | 0 | 50 | 0 |
| C | 0 | 50 | 0 |
| D | 0 | 50 | 0 |
| Quadrant | Total seconds | Saturated seconds | Saturation percentage |
|---|---|---|---|
| A | 2422 | 101 | 4.170107% |
| B | 2422 | 18 | 0.743187% |
| C | 2422 | 10 | 0.412882% |
| D | 2422 | 36 | 1.486375% |
Noise dominated data is calculated using 1-second bins in cleaned event files. If a bin has >2000 counts, and if more than 50% of those come from <1% of pixels, then it is considered to be noise-dominated and hence unusable.
| Quadrant | # 1 sec bins | Bins with >0 counts | Bins with >2000 counts | High rate bins dominated by noise | Noise dominated (total time) | Noise dominated (detector-on time) | Marked lightcurve |
|---|---|---|---|---|---|---|---|
| A | 2422 | 2422 | 19 | 19 | 0.78% | 0.78% | 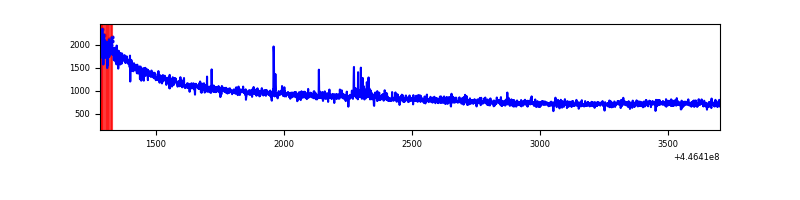 |
| B | 2422 | 2422 | 7 | 7 | 0.29% | 0.29% | 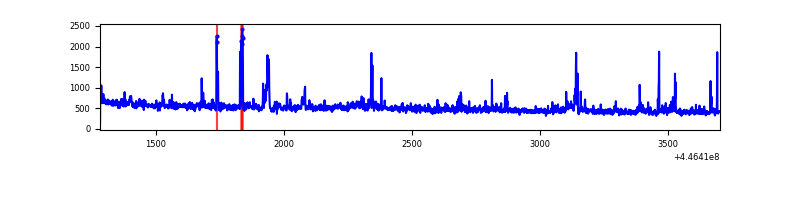 |
| C | 2422 | 2422 | 6 | 6 | 0.25% | 0.25% | 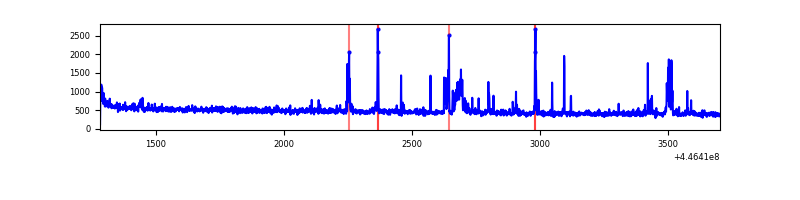 |
| D | 2422 | 2422 | 27 | 27 | 1.11% | 1.11% | 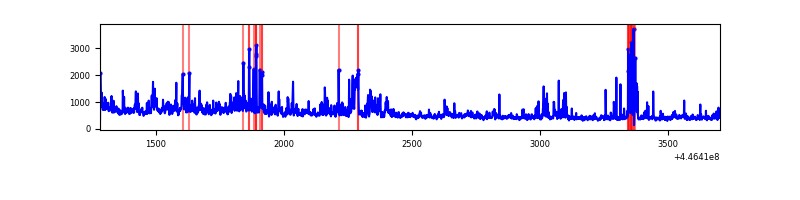 |
Top three noisy pixels from each quadrant. If the there are fewer than three noisy pixels in the level2.evt file, extra rows are filled as -1
| Pixel properties | Quadrant properties | ||||||
|---|---|---|---|---|---|---|---|
| Quadrant | DetID | PixID | Counts | Sigma | Mean | Median | Sigma |
| A | 10 | 83 | 1103749 | 18213.78 | 283 | 277 | 60.6 |
| A | 13 | 248 | 14841 | 240.39 | 283 | 277 | 60.6 |
| A | 0 | 243 | 3743 | 57.21 | 283 | 277 | 60.6 |
| B | 0 | 199 | 34230 | 597.49 | 289 | 282 | 56.8 |
| B | 15 | 201 | 25632 | 446.16 | 289 | 282 | 56.8 |
| B | 0 | 171 | 18594 | 322.29 | 289 | 282 | 56.8 |
| C | 14 | 254 | 79143 | 1182.02 | 279 | 281 | 66.7 |
| C | 1 | 3 | 35581 | 529.09 | 279 | 281 | 66.7 |
| C | 3 | 233 | 9954 | 144.98 | 279 | 281 | 66.7 |
| D | 1 | 52 | 225099 | 3142.12 | 273 | 264 | 71.6 |
| D | 11 | 241 | 118935 | 1658.45 | 273 | 264 | 71.6 |
| D | 13 | 249 | 73236 | 1019.8 | 273 | 264 | 71.6 |
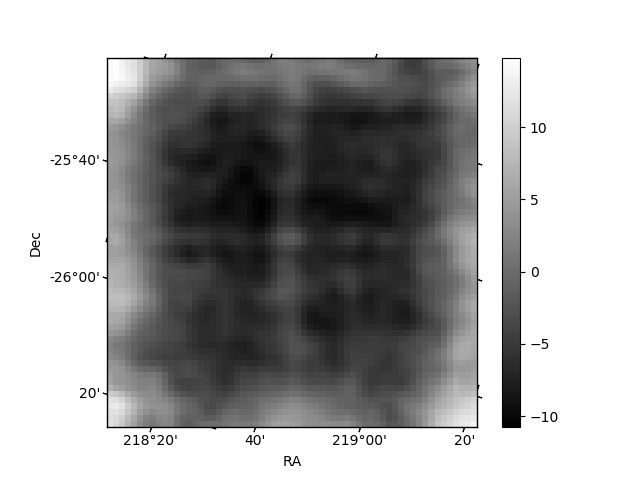
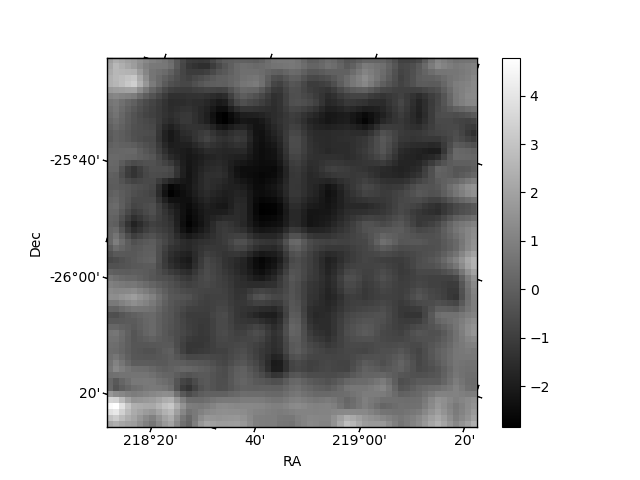
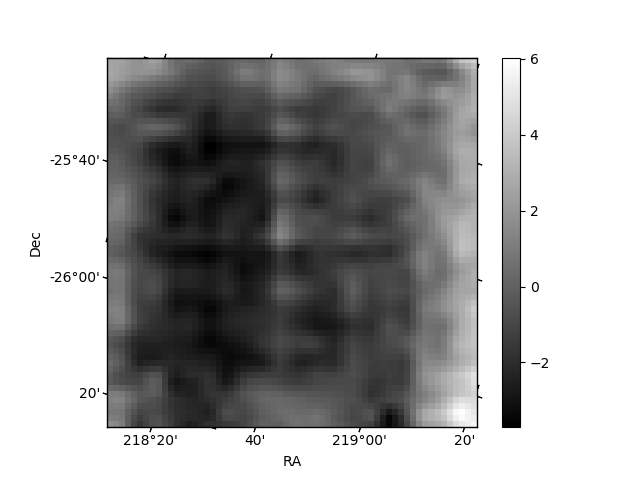
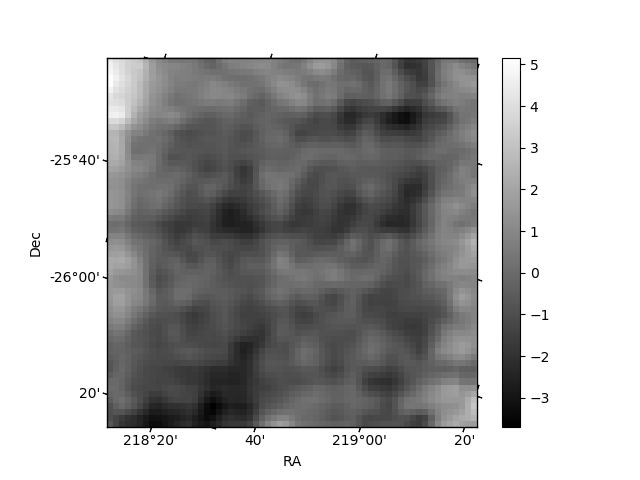
Histogram calculated using DETX and DETY for each event in the final _common_clean file
| Quadrant A | 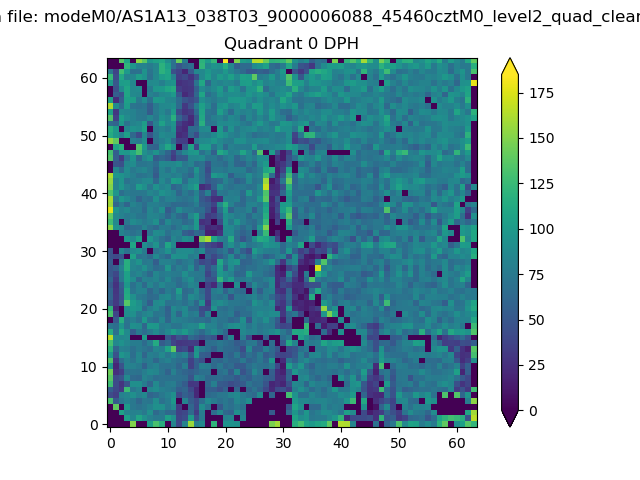 |
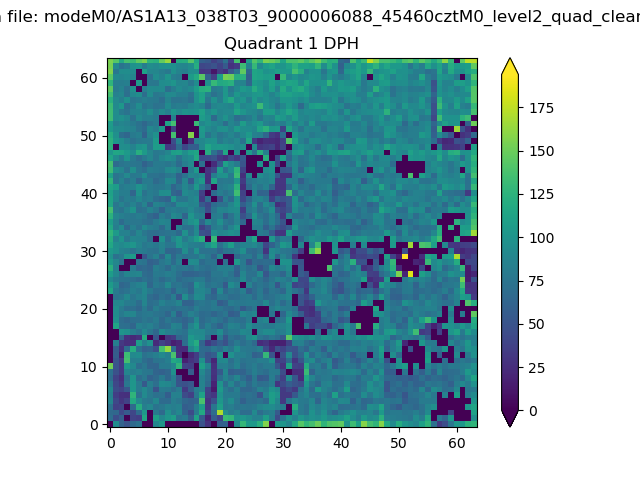 |
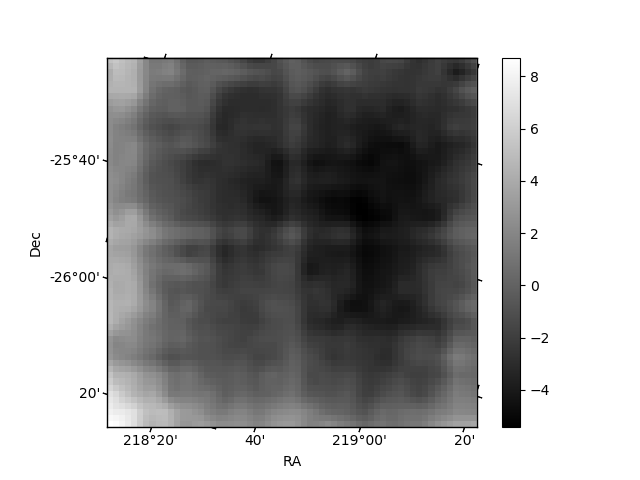
Quadrant B |
|---|---|---|---|
| Quadrant D | 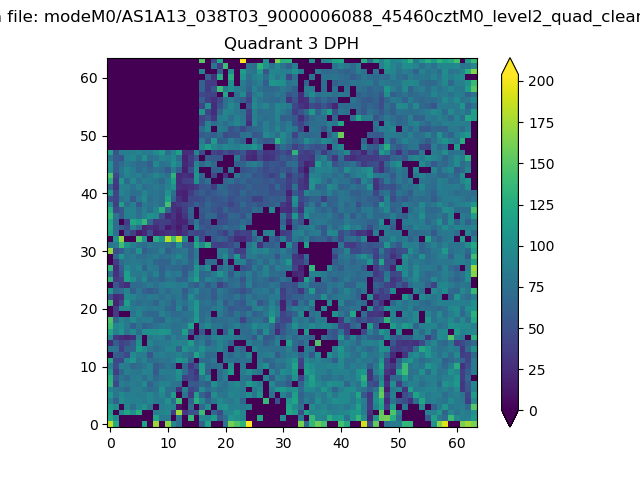 |
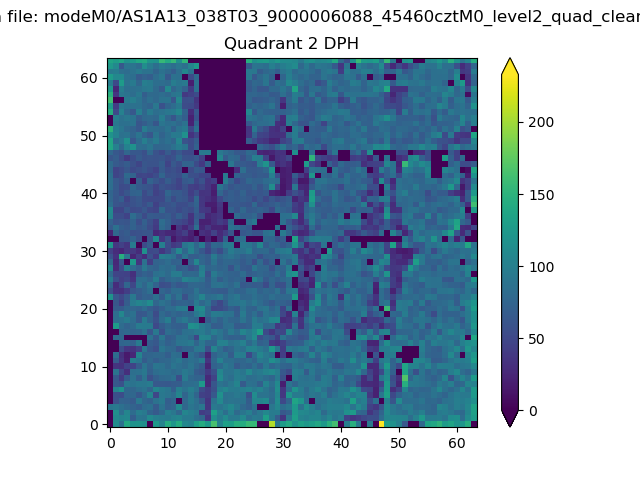 |
Quadrant C |
| Plot type | Count rate plots | Images |
|---|---|---|
| Comparison with Poisson distribution Blue bars denote a histogram of data divided into 1 sec bins. Red curve is a Poisson curve with rate = median count rate of data. |
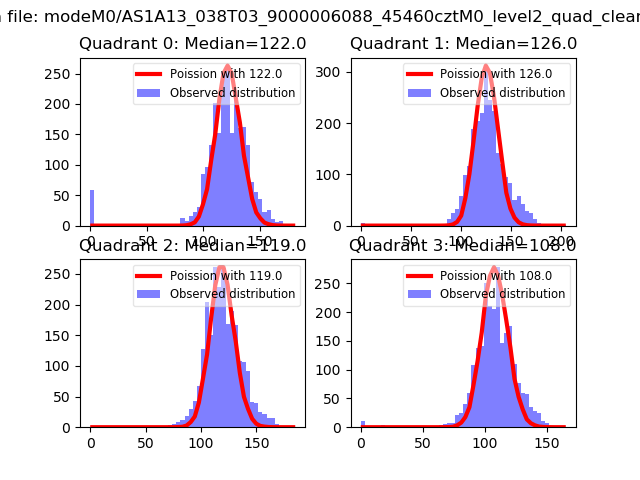 |
 |
| Quadrant-wise count rates Data is divided into 100 sec bins |
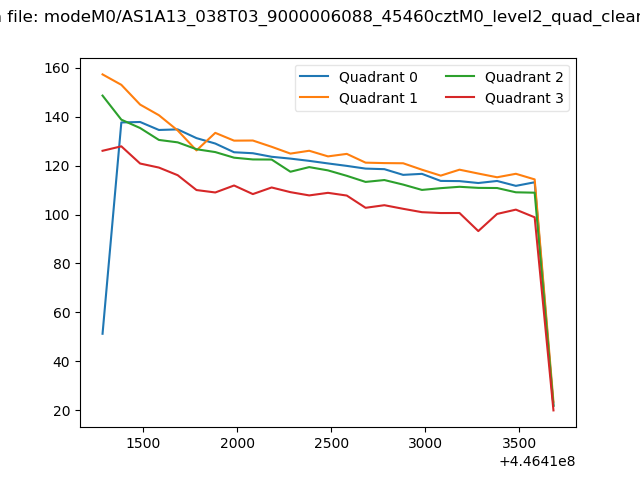 |
|
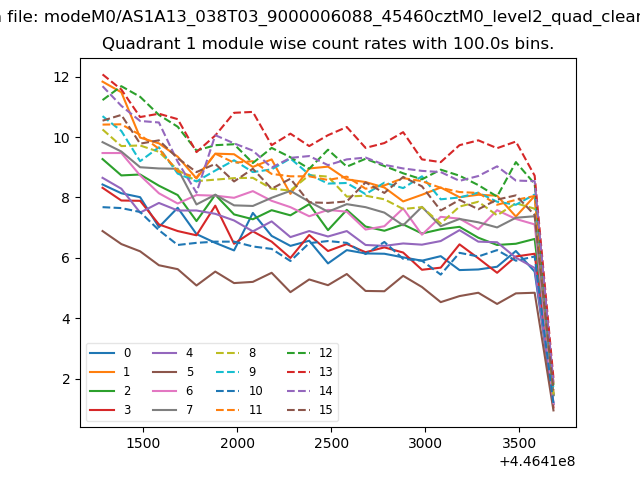
| Module-wise count rates for Quadrant A Data is divided into 100 sec bins |
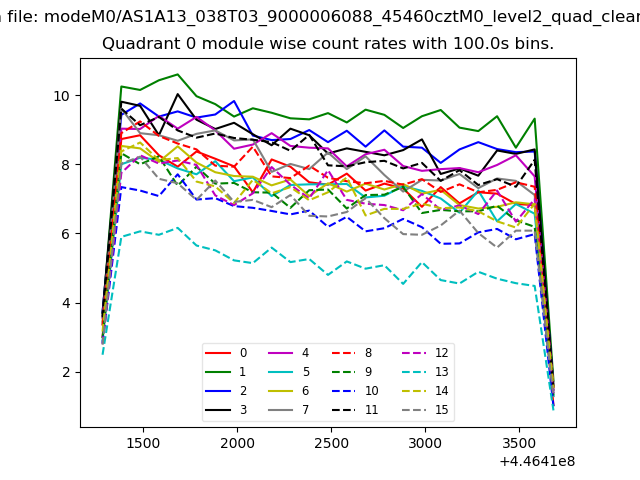 |
 |
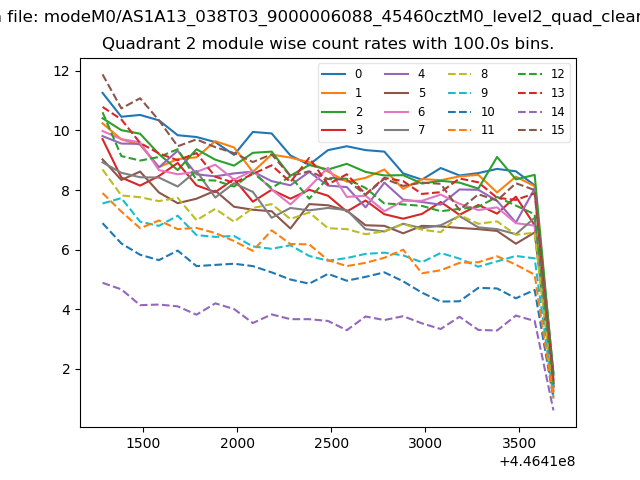
| Module-wise count rates for Quadrant B Data is divided into 100 sec bins |
 |
 |
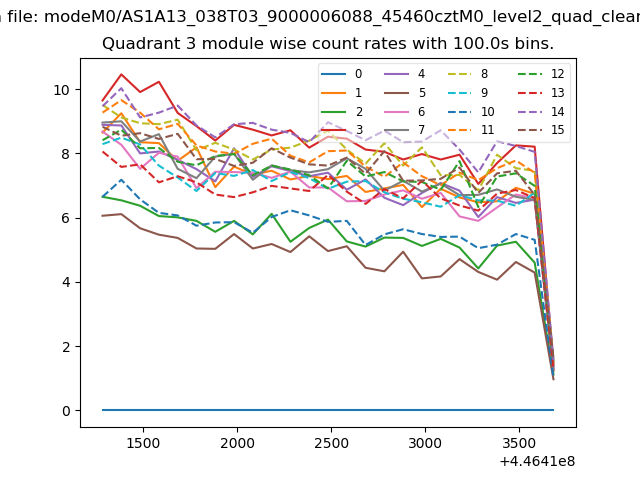
| Module-wise count rates for Quadrant C Data is divided into 100 sec bins |
 |
 |
| Module-wise count rates for Quadrant D Data is divided into 100 sec bins |
 |
 |
| Parameter | Plot |
|---|---|
| CZT HV Monitor | 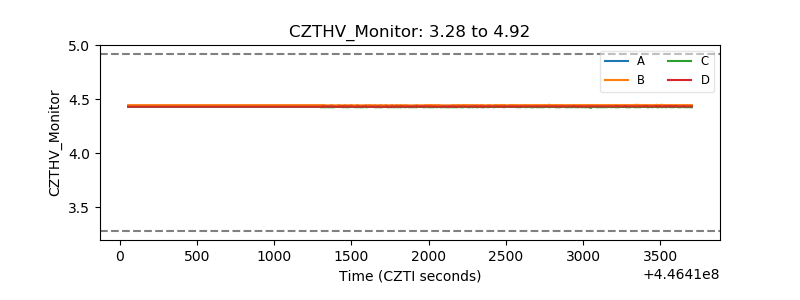 |
| D_VDD |  |
| Temperature 1 | 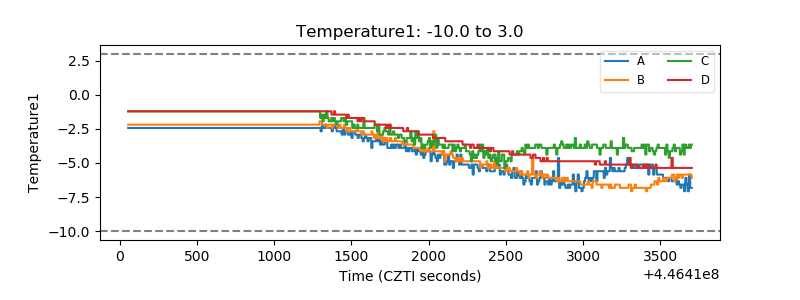 |
| Veto HV Monitor | 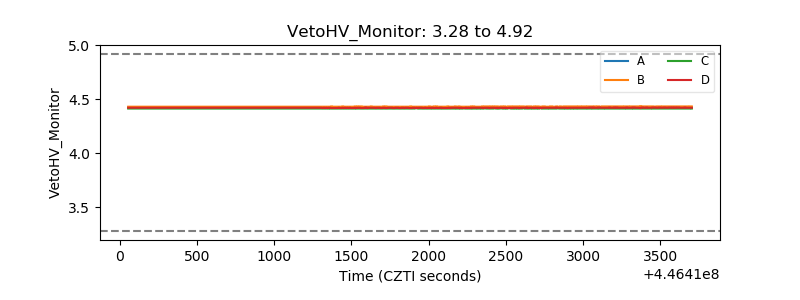 |
| Veto LLD | 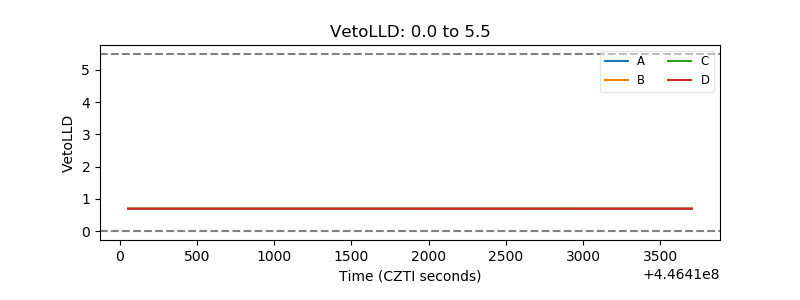 |
| Alpha Counter | 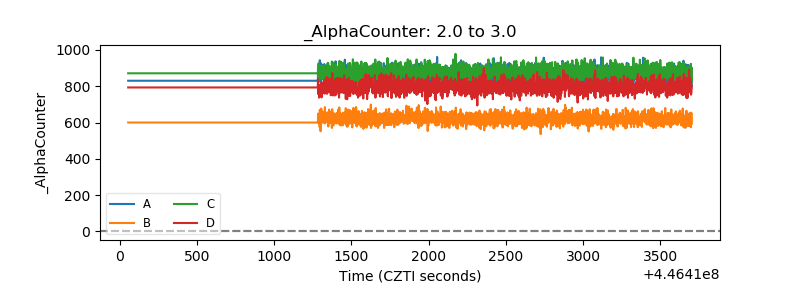 |
| _CPM_Rate |  |
| CZT Counter | 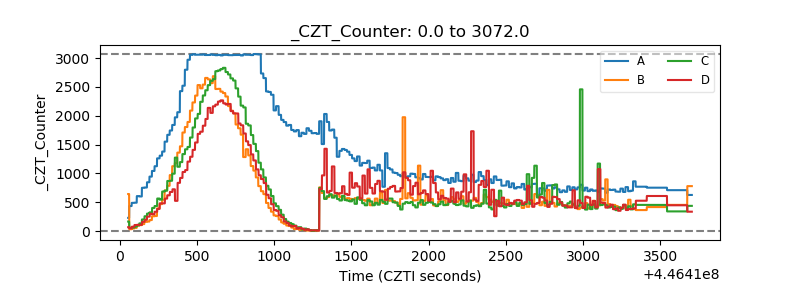 |
| +2.5 Volts monitor | 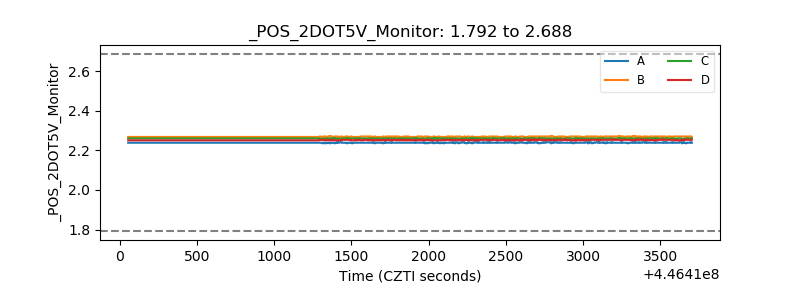 |
| +5 Volts monitor |  |
| _ROLL_ROT | 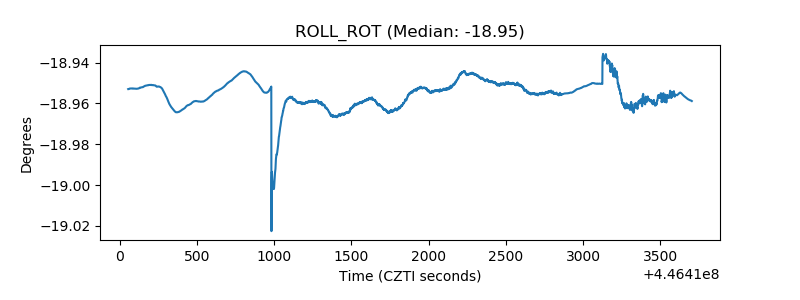 |
| _Roll_DEC | 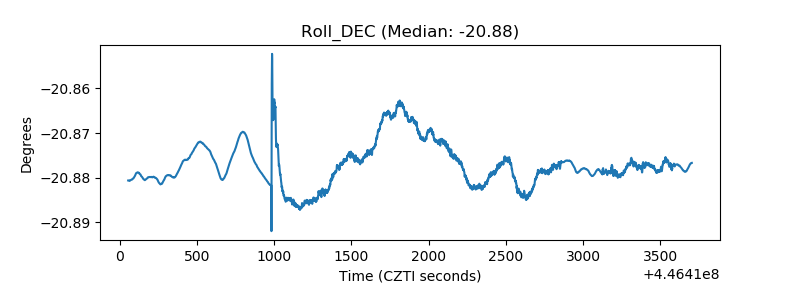 |
| _Roll_RA | 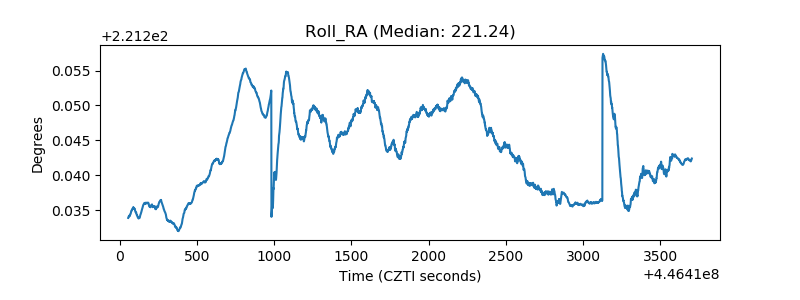 |
| Veto Counter | 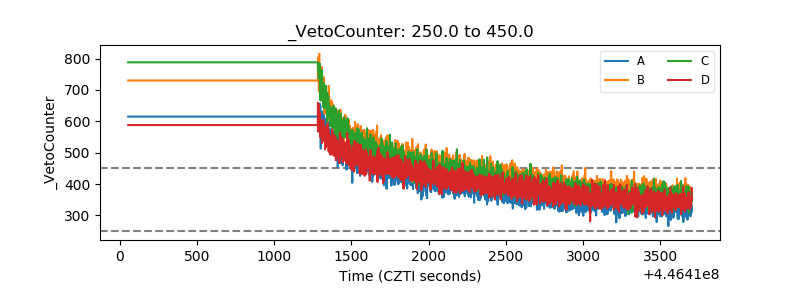 |