| Param | Original file | Final file |
|---|---|---|
| Filename | modeM0/AS1A13_038T04_9000006090_45460cztM0_level2.fits | modeM0/AS1A13_038T04_9000006090_45460cztM0_level2_quad_clean.evt |
| Size (bytes) | 250,447,680 | 52,171,200 |
| Size | 238.8 MB | 49.8 MB |
| Events in quadrant A | 2,754,547 | 351,111 |
| Events in quadrant B | 2,410,051 | 341,049 |
| Events in quadrant C | 1,586,528 | 356,750 |
| Events in quadrant D | 2,278,469 | 311,419 |
| Mode M0 | |||
|---|---|---|---|
| Quadrant | BADHDUFLAG | Total packets | Discarded packets |
| A | 0 | 10325 | 1 |
| B | 0 | 9206 | 1 |
| C | 0 | 6748 | 1 |
| D | 0 | 8900 | 1 |
| Mode M9 | |||
|---|---|---|---|
| Quadrant | BADHDUFLAG | Total packets | Discarded packets |
| A | 0 | 12 | 0 |
| B | 0 | 12 | 0 |
| C | 0 | 12 | 0 |
| D | 0 | 12 | 0 |
| Mode SS | |||
|---|---|---|---|
| Quadrant | BADHDUFLAG | Total packets | Discarded packets |
| A | 0 | 64 | 0 |
| B | 0 | 64 | 0 |
| C | 0 | 64 | 0 |
| D | 0 | 64 | 0 |
| Quadrant | Total seconds | Saturated seconds | Saturation percentage |
|---|---|---|---|
| A | 3082 | 173 | 5.613238% |
| B | 3082 | 404 | 13.108371% |
| C | 3082 | 70 | 2.271252% |
| D | 3082 | 211 | 6.846204% |
Noise dominated data is calculated using 1-second bins in cleaned event files. If a bin has >2000 counts, and if more than 50% of those come from <1% of pixels, then it is considered to be noise-dominated and hence unusable.
| Quadrant | # 1 sec bins | Bins with >0 counts | Bins with >2000 counts | High rate bins dominated by noise | Noise dominated (total time) | Noise dominated (detector-on time) | Marked lightcurve |
|---|---|---|---|---|---|---|---|
| A | 4272 | 3083 | 14 | 14 | 0.33% | 0.45% | 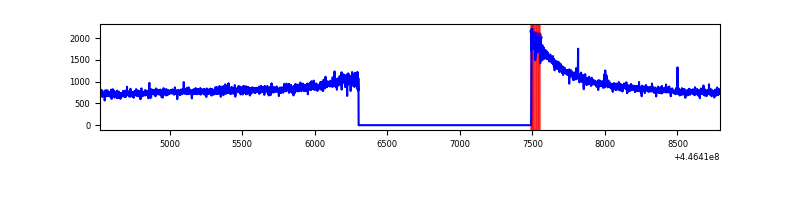 |
| B | 4272 | 3083 | 211 | 211 | 4.94% | 6.84% | 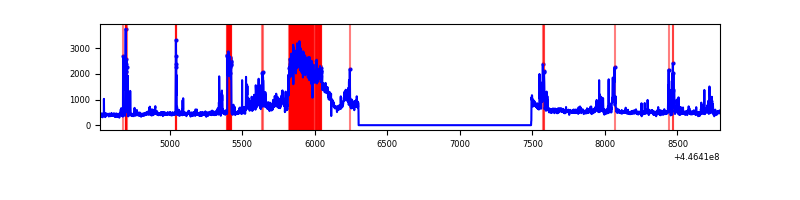 |
| C | 4272 | 3083 | 7 | 7 | 0.16% | 0.23% | 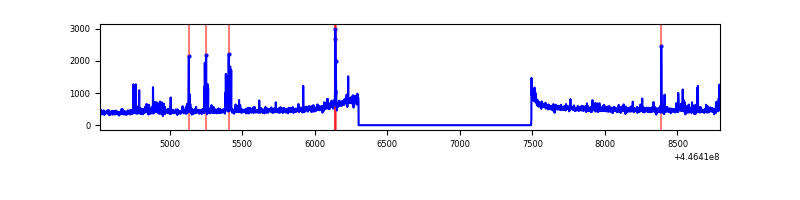 |
| D | 4272 | 3083 | 111 | 111 | 2.60% | 3.60% | 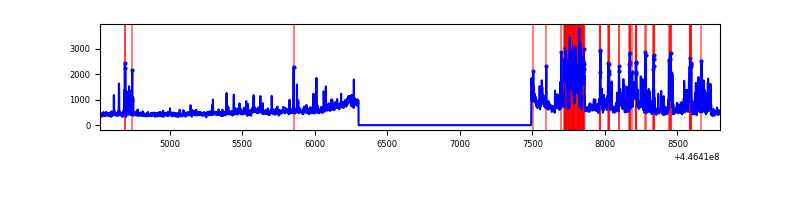 |
Top three noisy pixels from each quadrant. If the there are fewer than three noisy pixels in the level2.evt file, extra rows are filled as -1
| Pixel properties | Quadrant properties | ||||||
|---|---|---|---|---|---|---|---|
| Quadrant | DetID | PixID | Counts | Sigma | Mean | Median | Sigma |
| A | 10 | 83 | 1286726 | 16322.29 | 377 | 370 | 78.8 |
| A | 0 | 243 | 5088 | 59.87 | 377 | 370 | 78.8 |
| A | 3 | 137 | 4325 | 50.18 | 377 | 370 | 78.8 |
| B | 15 | 201 | 847462 | 11522.93 | 365 | 353 | 73.5 |
| B | 5 | 172 | 44857 | 605.37 | 365 | 353 | 73.5 |
| B | 12 | 48 | 32508 | 437.39 | 365 | 353 | 73.5 |
| C | 2 | 14 | 84995 | 953.72 | 374 | 376 | 88.7 |
| C | 14 | 254 | 21270 | 235.49 | 374 | 376 | 88.7 |
| C | 1 | 3 | 9630 | 104.3 | 374 | 376 | 88.7 |
| D | 1 | 52 | 595888 | 6430.14 | 366 | 355 | 92.6 |
| D | 11 | 241 | 164982 | 1777.53 | 366 | 355 | 92.6 |
| D | 2 | 249 | 44784 | 479.71 | 366 | 355 | 92.6 |
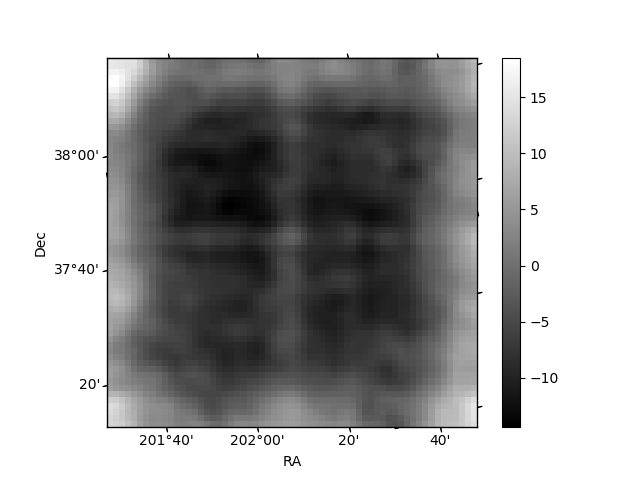
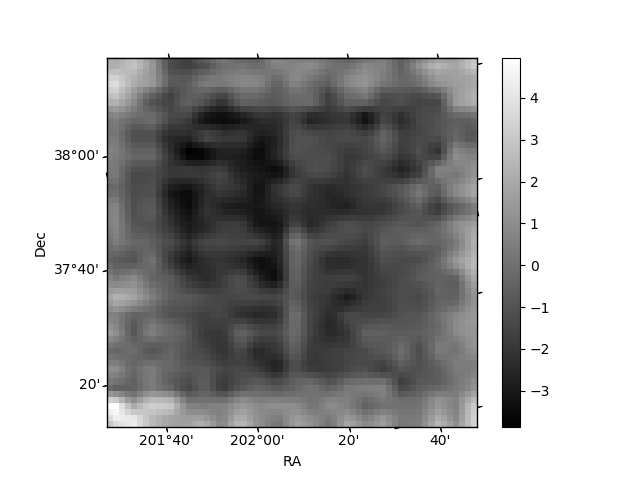
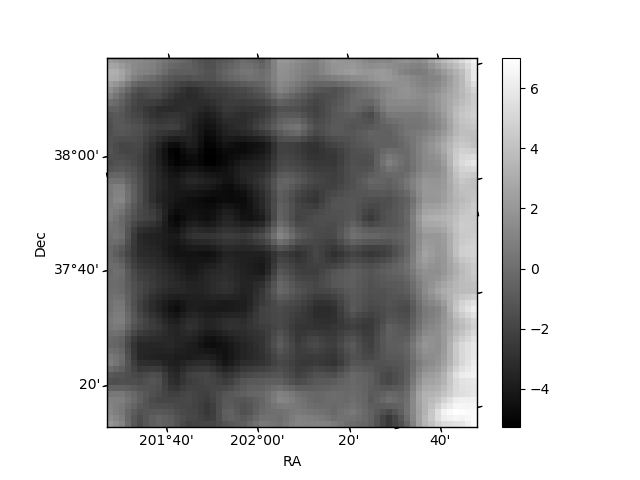
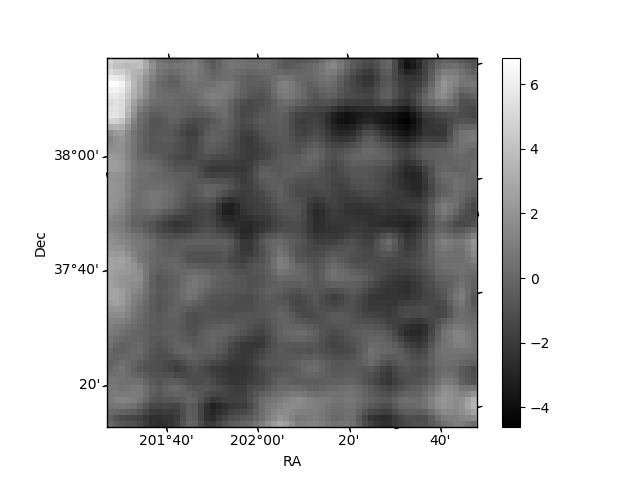
Histogram calculated using DETX and DETY for each event in the final _common_clean file
| Quadrant A | 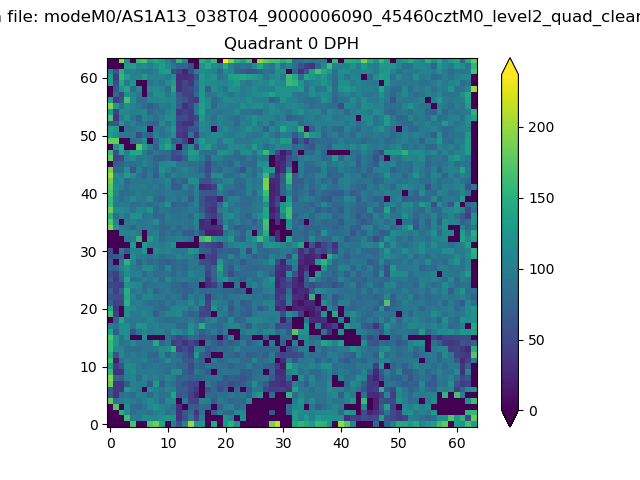 |
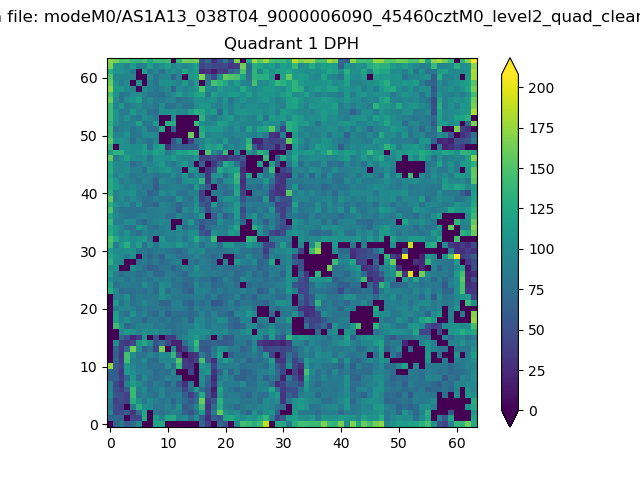 |
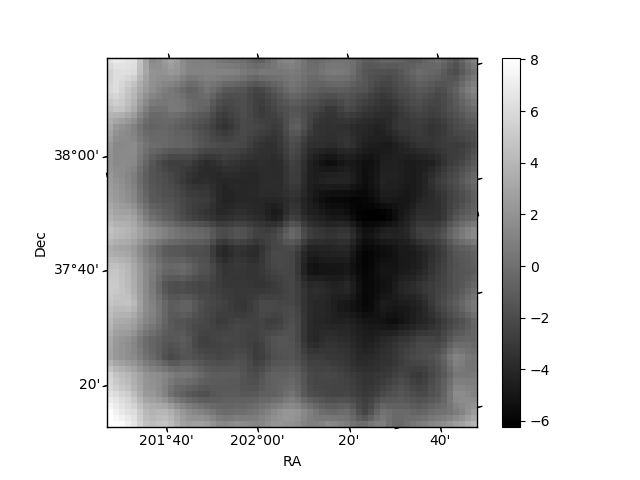
Quadrant B |
|---|---|---|---|
| Quadrant D | 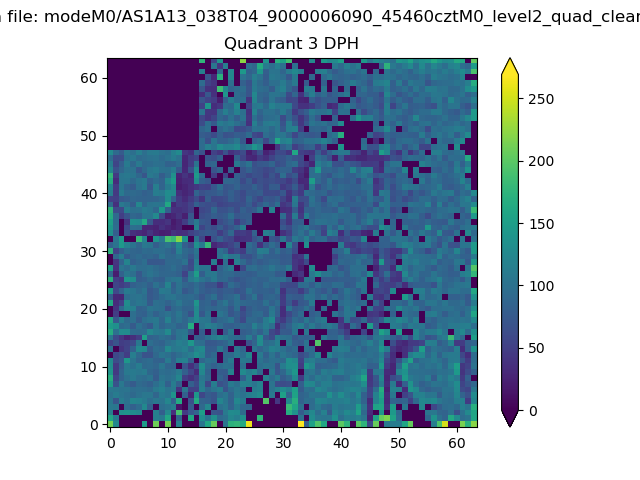 |
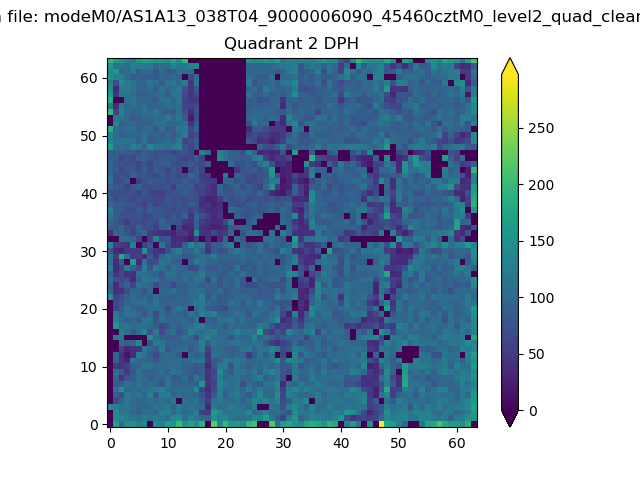 |
Quadrant C |
| Plot type | Count rate plots | Images |
|---|---|---|
| Comparison with Poisson distribution Blue bars denote a histogram of data divided into 1 sec bins. Red curve is a Poisson curve with rate = median count rate of data. |
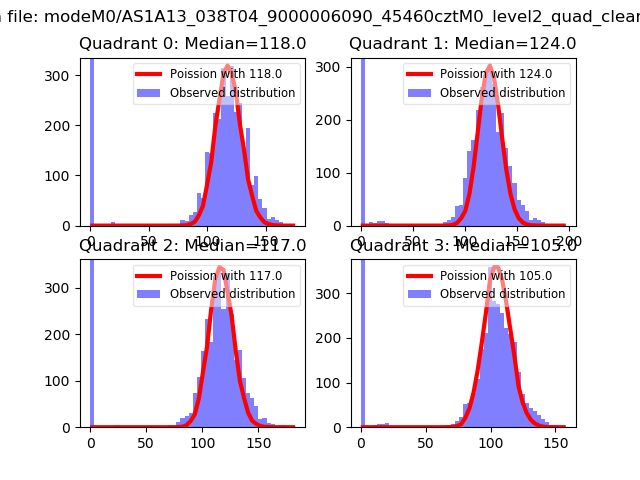 |
 |
| Quadrant-wise count rates Data is divided into 100 sec bins |
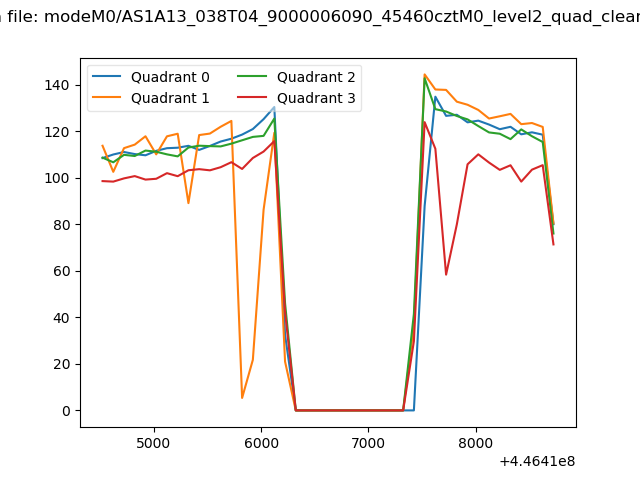 |
|
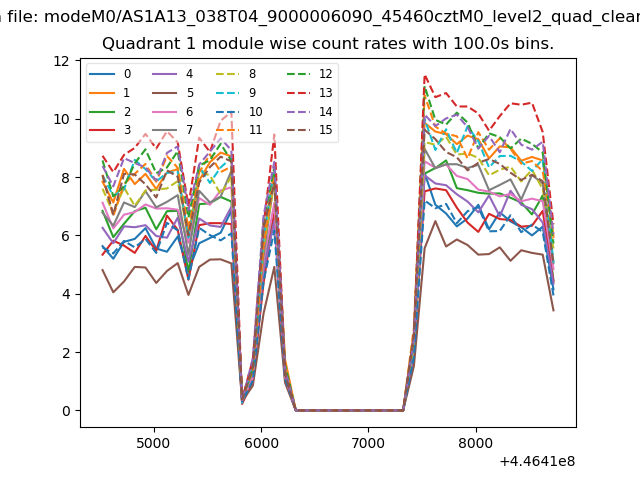
| Module-wise count rates for Quadrant A Data is divided into 100 sec bins |
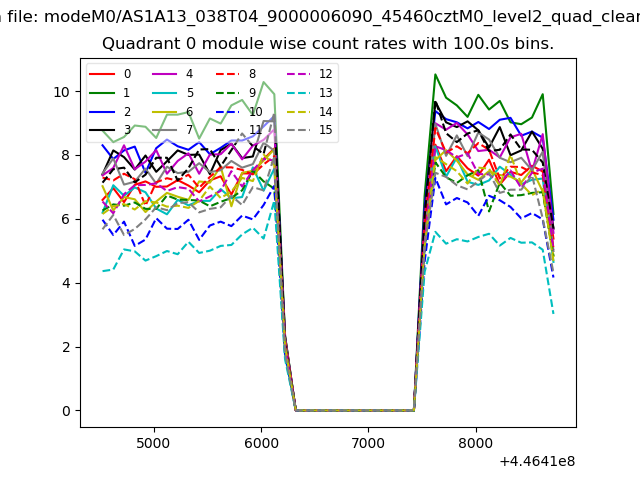 |
 |
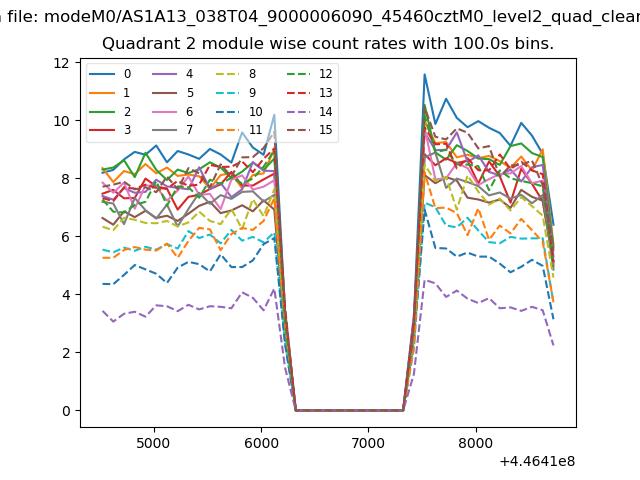
| Module-wise count rates for Quadrant B Data is divided into 100 sec bins |
 |
 |
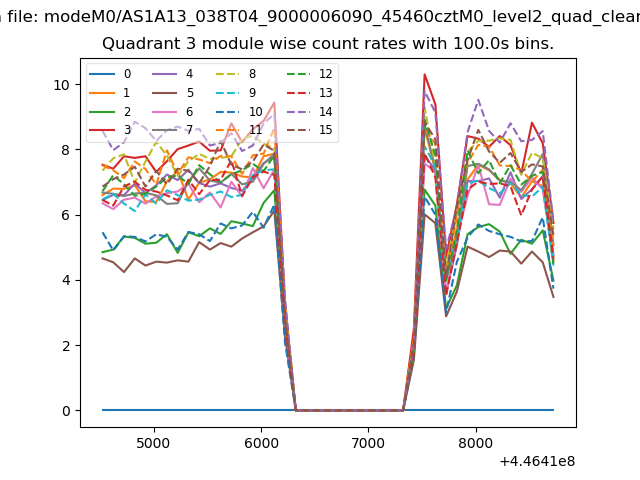
| Module-wise count rates for Quadrant C Data is divided into 100 sec bins |
 |
 |
| Module-wise count rates for Quadrant D Data is divided into 100 sec bins |
 |
 |
| Parameter | Plot |
|---|---|
| CZT HV Monitor | 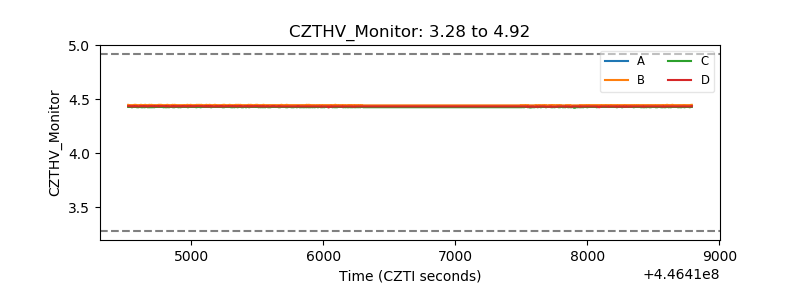 |
| D_VDD | 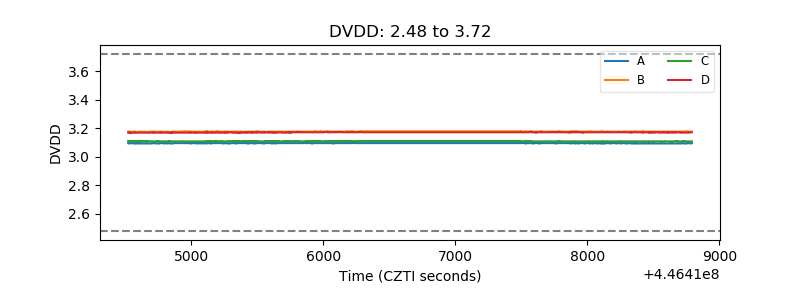 |
| Temperature 1 | 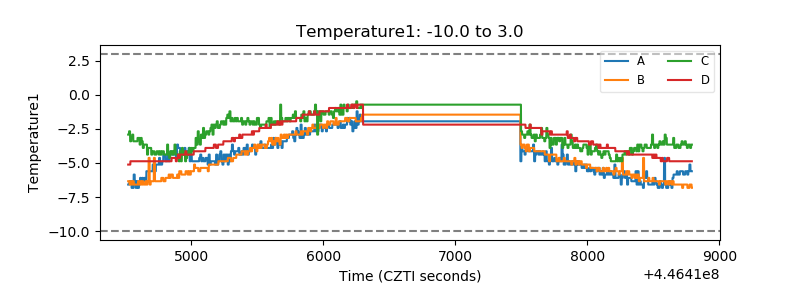 |
| Veto HV Monitor | 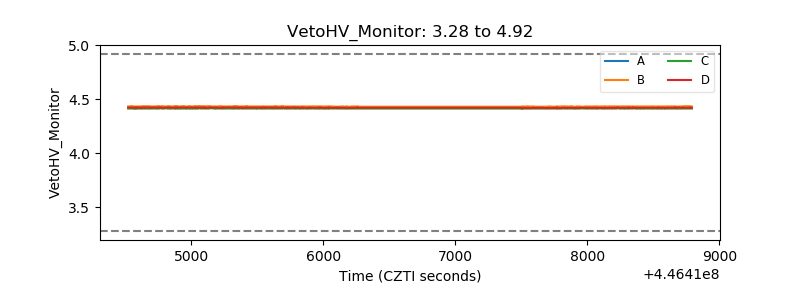 |
| Veto LLD | 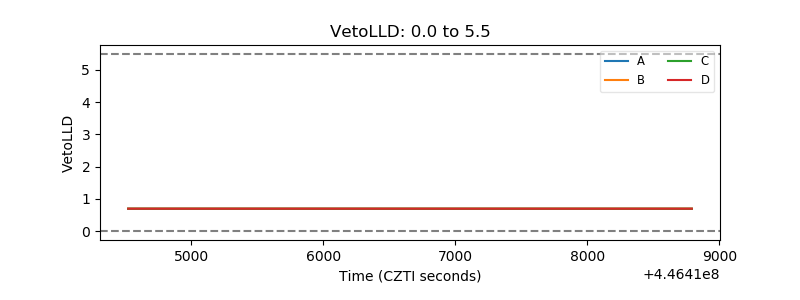 |
| Alpha Counter | 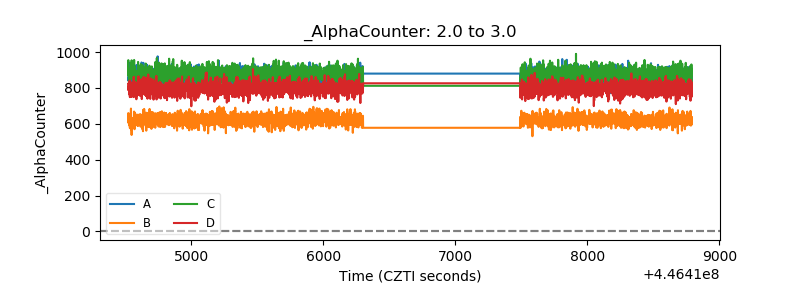 |
| _CPM_Rate | 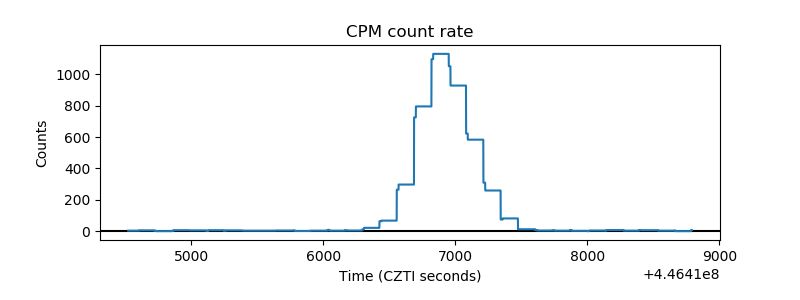 |
| CZT Counter | 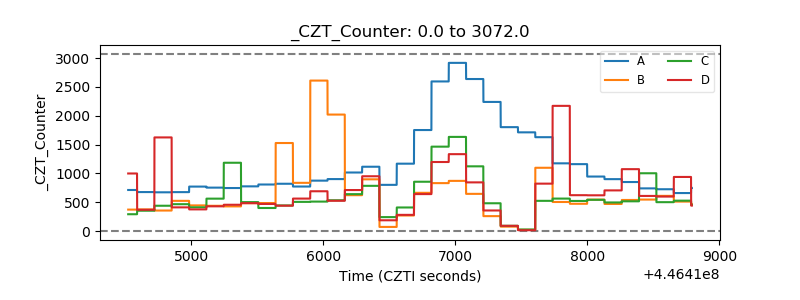 |
| +2.5 Volts monitor | 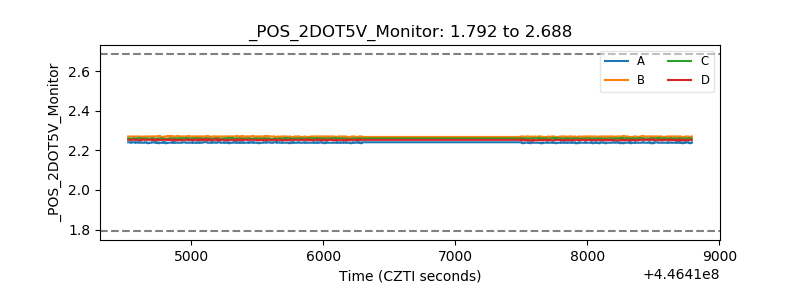 |
| +5 Volts monitor | 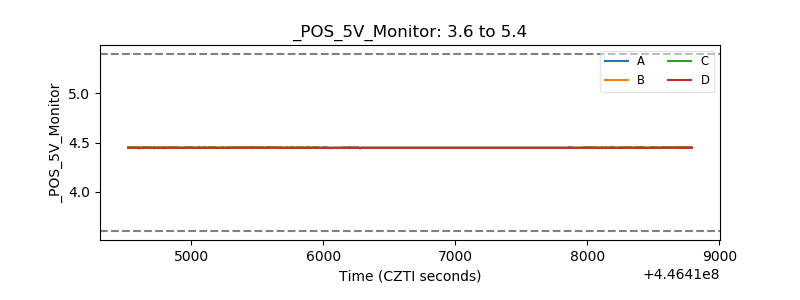 |
| _ROLL_ROT | 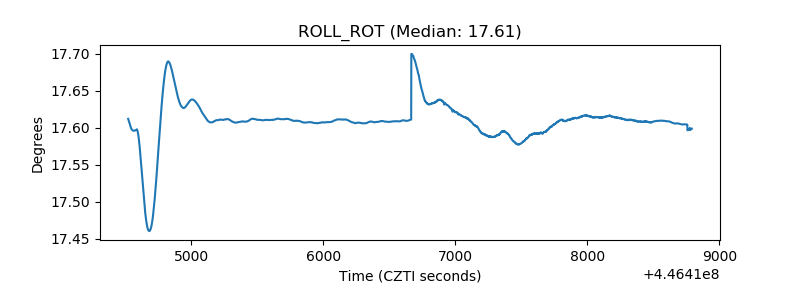 |
| _Roll_DEC | 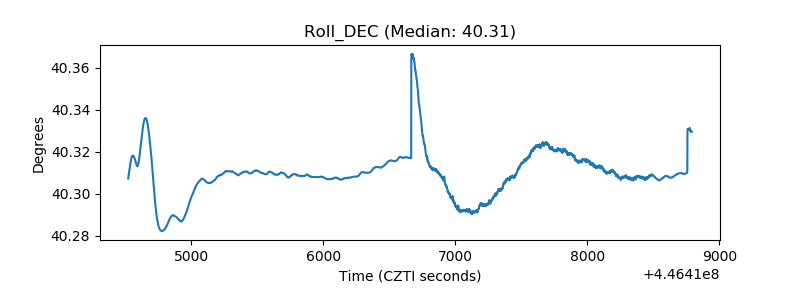 |
| _Roll_RA | 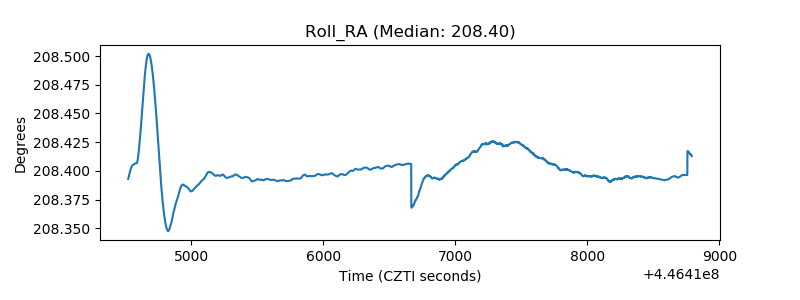 |
| Veto Counter | 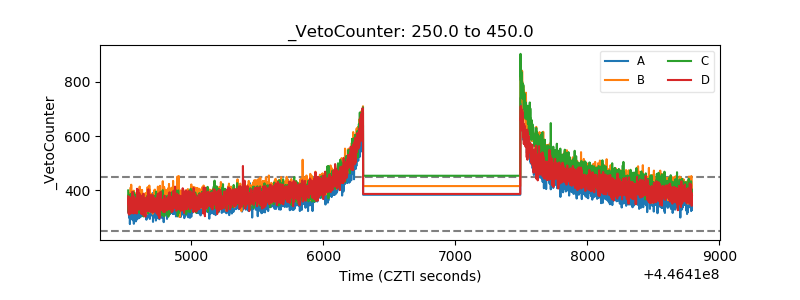 |