| Param | Original file | Final file |
|---|---|---|
| Filename | modeM0/AS1A13_038T04_9000006090_45461cztM0_level2.fits | modeM0/AS1A13_038T04_9000006090_45461cztM0_level2_quad_clean.evt |
| Size (bytes) | 466,231,680 | 108,486,720 |
| Size | 444.6 MB | 103.5 MB |
| Events in quadrant A | 5,460,988 | 720,579 |
| Events in quadrant B | 3,956,361 | 746,345 |
| Events in quadrant C | 2,996,962 | 730,167 |
| Events in quadrant D | 4,343,934 | 638,297 |
| Mode M0 | |||
|---|---|---|---|
| Quadrant | BADHDUFLAG | Total packets | Discarded packets |
| A | 0 | 21097 | 2 |
| B | 0 | 16192 | 2 |
| C | 0 | 13515 | 3 |
| D | 0 | 17618 | 2 |
| Mode M9 | |||
|---|---|---|---|
| Quadrant | BADHDUFLAG | Total packets | Discarded packets |
| A | 0 | 19 | 0 |
| B | 0 | 20 | 0 |
| C | 0 | 20 | 0 |
| D | 0 | 20 | 0 |
| Mode SS | |||
|---|---|---|---|
| Quadrant | BADHDUFLAG | Total packets | Discarded packets |
| A | 0 | 132 | 0 |
| B | 0 | 132 | 0 |
| C | 0 | 132 | 0 |
| D | 0 | 132 | 0 |
| Quadrant | Total seconds | Saturated seconds | Saturation percentage |
|---|---|---|---|
| A | 6445 | 197 | 3.056633% |
| B | 6445 | 226 | 3.506594% |
| C | 6444 | 30 | 0.465549% |
| D | 6444 | 285 | 4.422719% |
Noise dominated data is calculated using 1-second bins in cleaned event files. If a bin has >2000 counts, and if more than 50% of those come from <1% of pixels, then it is considered to be noise-dominated and hence unusable.
| Quadrant | # 1 sec bins | Bins with >0 counts | Bins with >2000 counts | High rate bins dominated by noise | Noise dominated (total time) | Noise dominated (detector-on time) | Marked lightcurve |
|---|---|---|---|---|---|---|---|
| A | 7616 | 6446 | 28 | 28 | 0.37% | 0.43% | 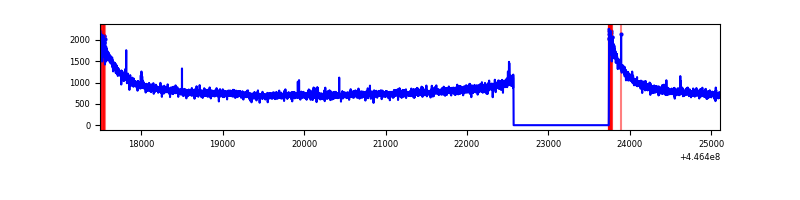 |
| B | 7616 | 6446 | 110 | 110 | 1.44% | 1.71% | 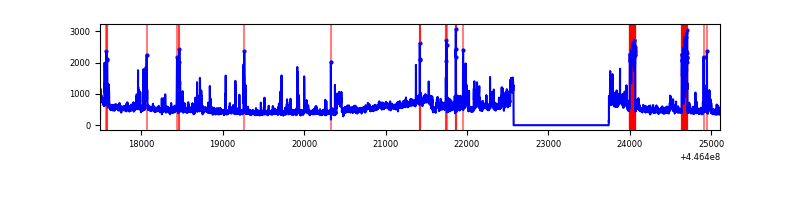 |
| C | 7615 | 6445 | 10 | 10 | 0.13% | 0.16% | 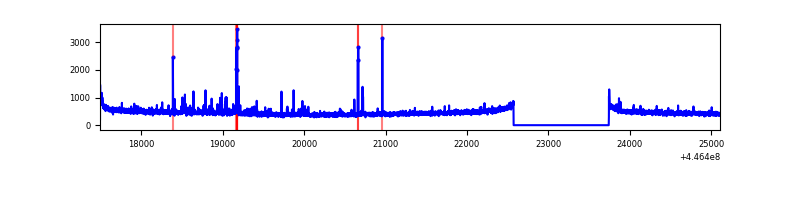 |
| D | 7615 | 6445 | 187 | 187 | 2.46% | 2.90% | 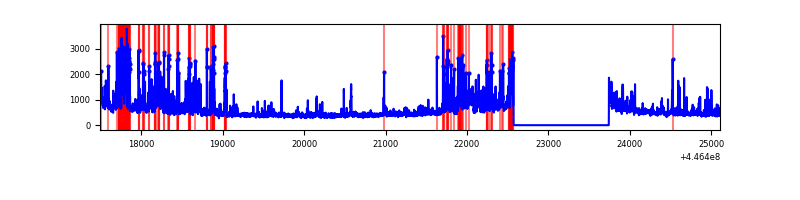 |
Top three noisy pixels from each quadrant. If the there are fewer than three noisy pixels in the level2.evt file, extra rows are filled as -1
| Pixel properties | Quadrant properties | ||||||
|---|---|---|---|---|---|---|---|
| Quadrant | DetID | PixID | Counts | Sigma | Mean | Median | Sigma |
| A | 10 | 83 | 2623040 | 17529.82 | 729 | 714 | 149.6 |
| A | 2 | 79 | 10317 | 64.19 | 729 | 714 | 149.6 |
| A | 0 | 243 | 8826 | 54.23 | 729 | 714 | 149.6 |
| B | 15 | 201 | 897859 | 6196.06 | 735 | 713 | 144.8 |
| B | 5 | 172 | 59478 | 405.86 | 735 | 713 | 144.8 |
| B | 0 | 189 | 28275 | 190.35 | 735 | 713 | 144.8 |
| C | 14 | 254 | 55689 | 321.11 | 728 | 734 | 171.1 |
| C | 2 | 14 | 48900 | 281.44 | 728 | 734 | 171.1 |
| C | 1 | 3 | 27499 | 156.39 | 728 | 734 | 171.1 |
| D | 1 | 52 | 1084067 | 6064.03 | 705 | 684 | 178.7 |
| D | 11 | 241 | 261853 | 1461.84 | 705 | 684 | 178.7 |
| D | 13 | 249 | 90308 | 501.65 | 705 | 684 | 178.7 |
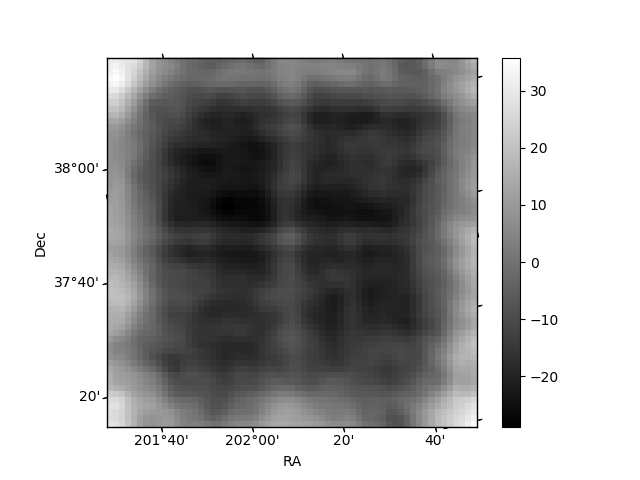
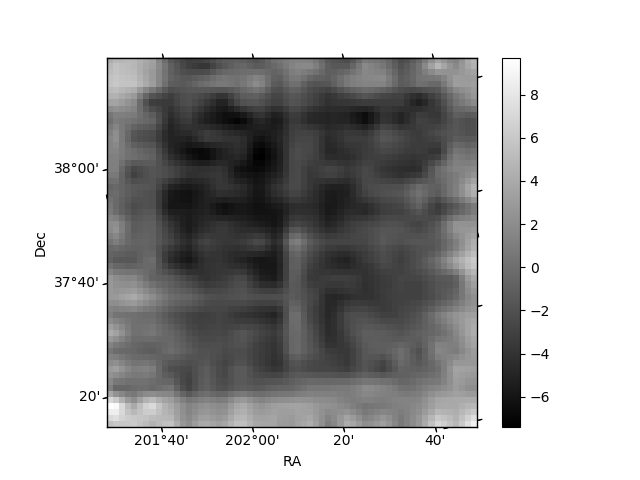
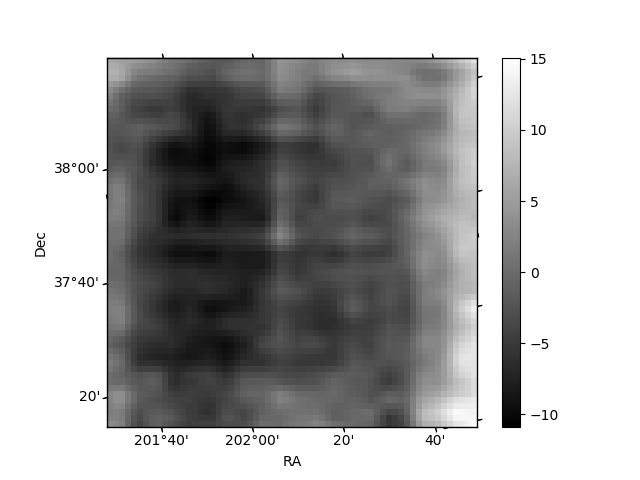
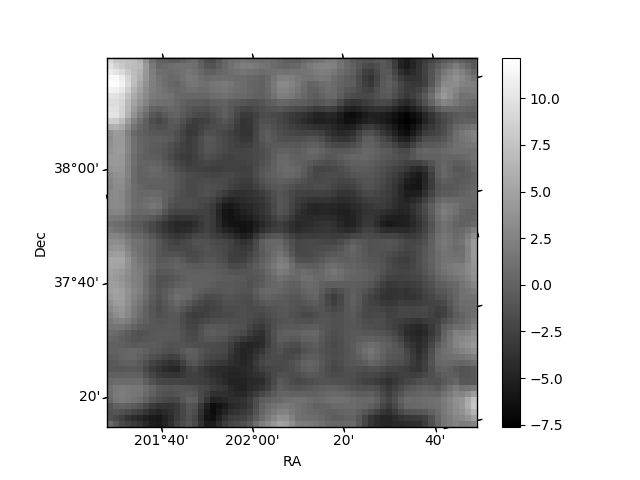
Histogram calculated using DETX and DETY for each event in the final _common_clean file
| Quadrant A | 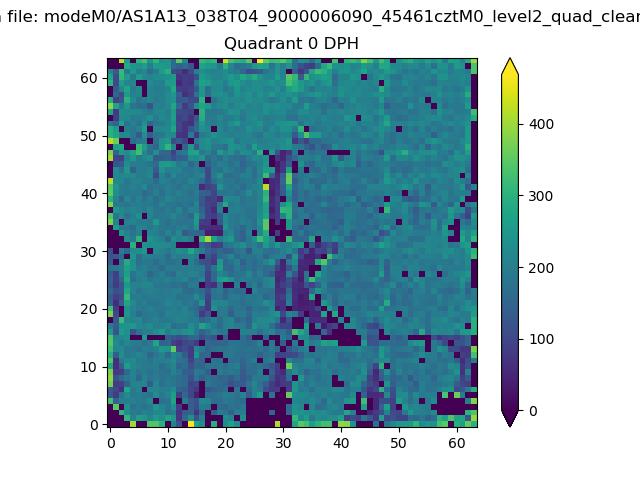 |
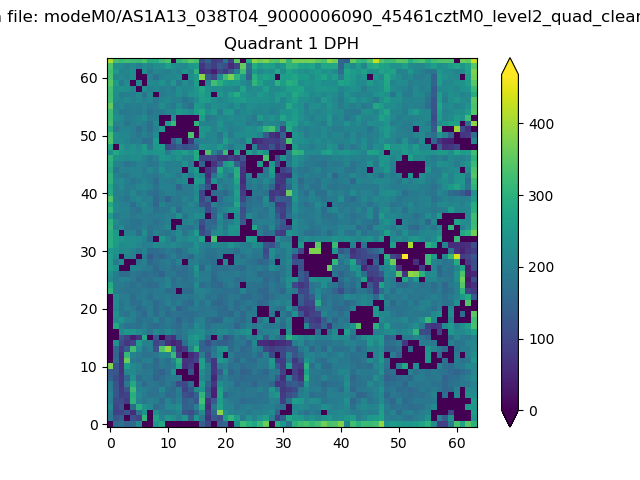 |
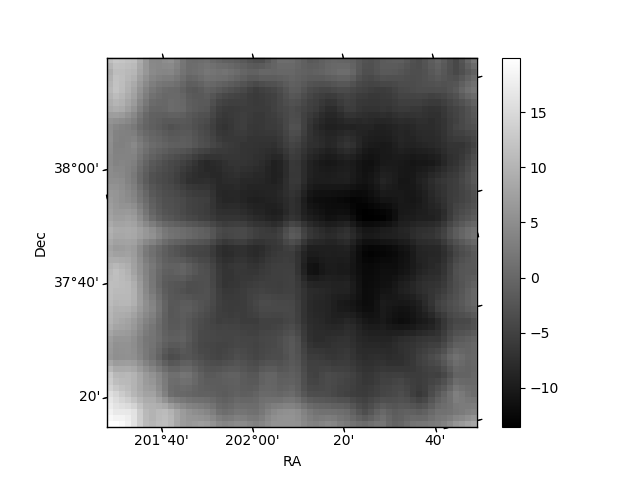
Quadrant B |
|---|---|---|---|
| Quadrant D | 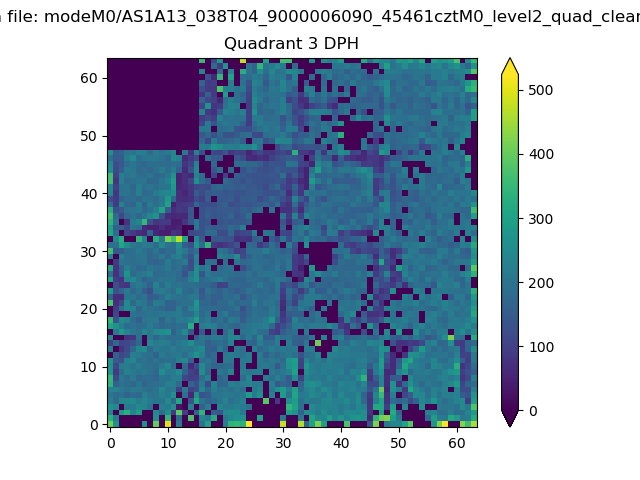 |
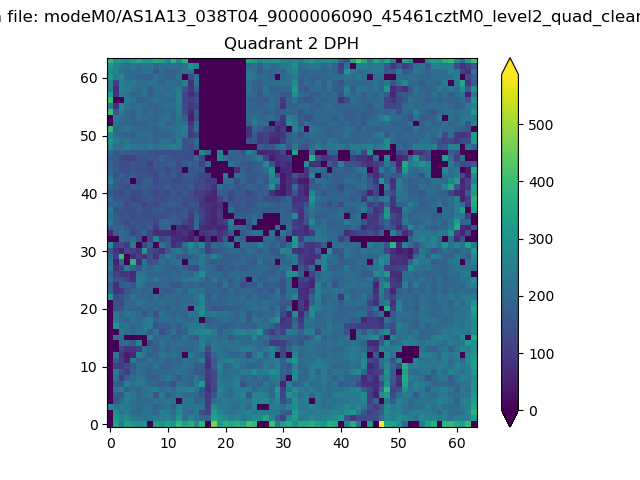 |
Quadrant C |
| Plot type | Count rate plots | Images |
|---|---|---|
| Comparison with Poisson distribution Blue bars denote a histogram of data divided into 1 sec bins. Red curve is a Poisson curve with rate = median count rate of data. |
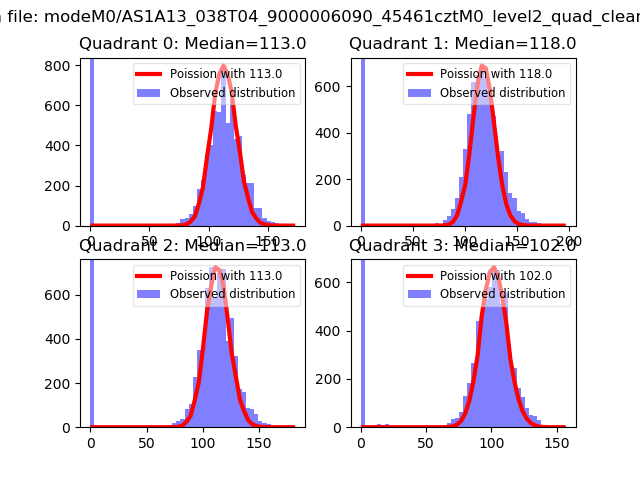 |
 |
| Quadrant-wise count rates Data is divided into 100 sec bins |
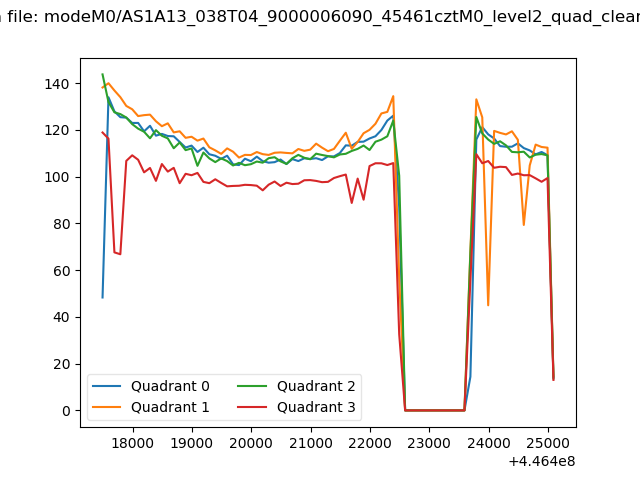 |
|
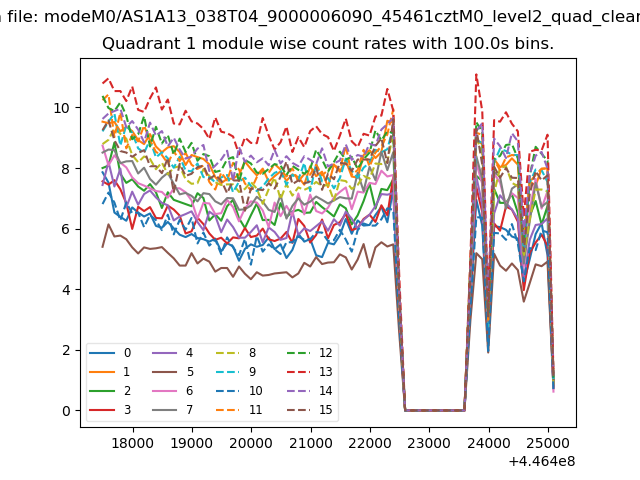
| Module-wise count rates for Quadrant A Data is divided into 100 sec bins |
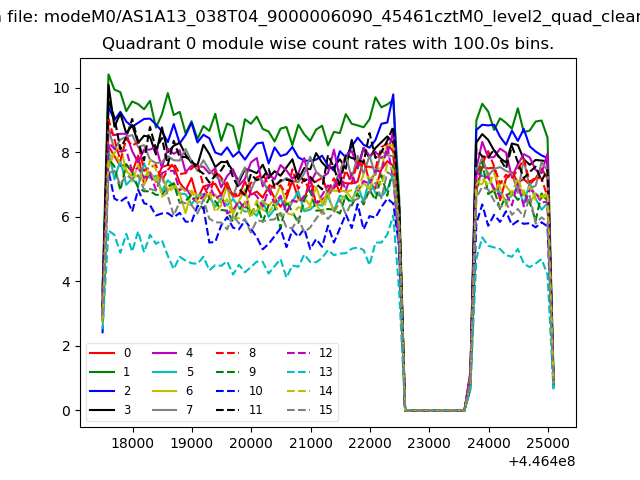 |
 |
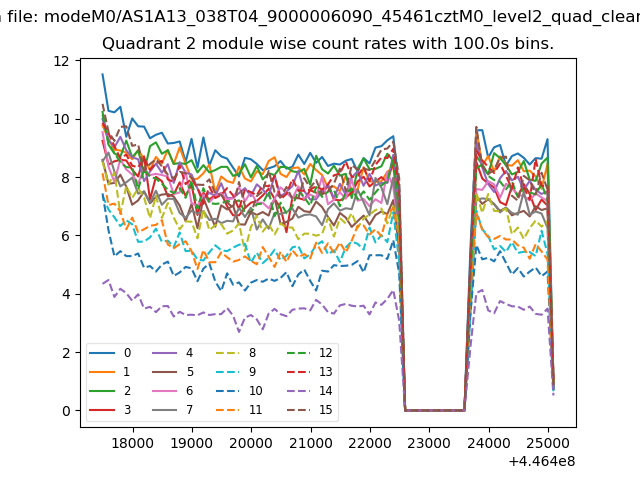
| Module-wise count rates for Quadrant B Data is divided into 100 sec bins |
 |
 |
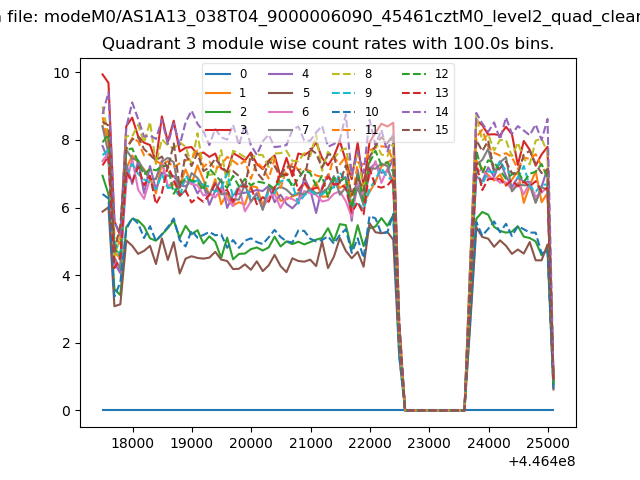
| Module-wise count rates for Quadrant C Data is divided into 100 sec bins |
 |
 |
| Module-wise count rates for Quadrant D Data is divided into 100 sec bins |
 |
 |
| Parameter | Plot |
|---|---|
| CZT HV Monitor | 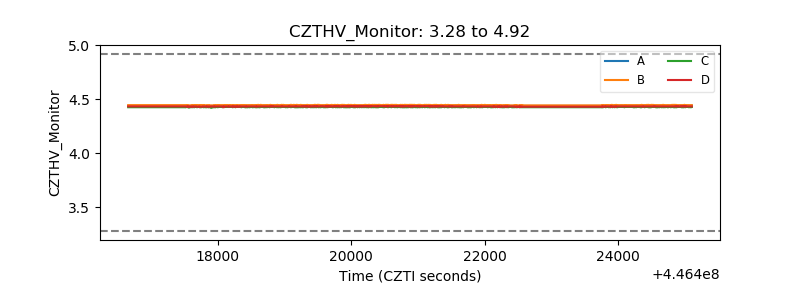 |
| D_VDD | 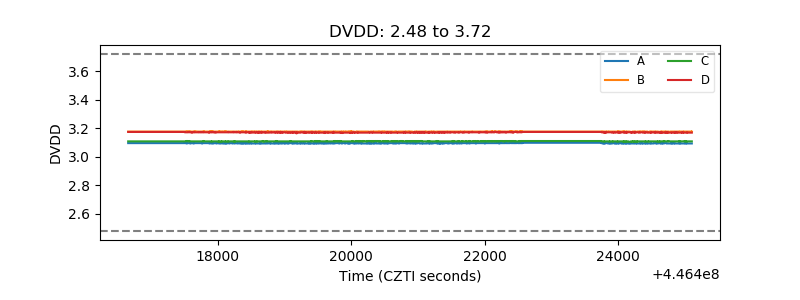 |
| Temperature 1 | 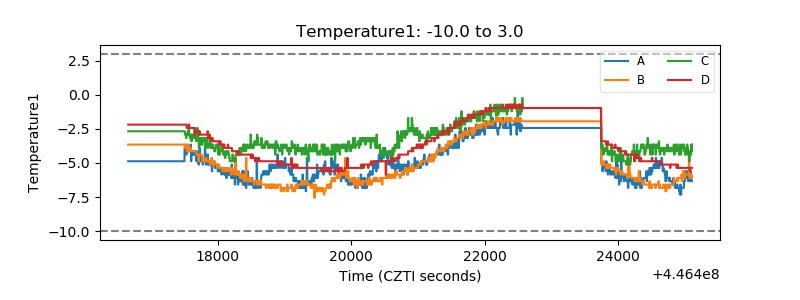 |
| Veto HV Monitor |  |
| Veto LLD | 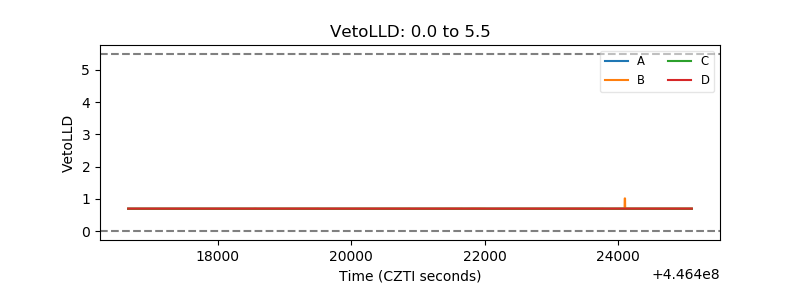 |
| Alpha Counter | 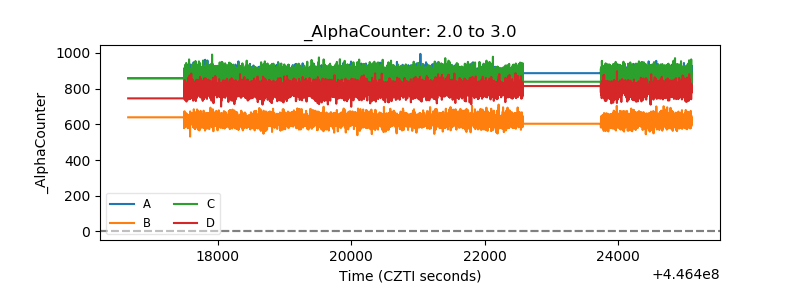 |
| _CPM_Rate | 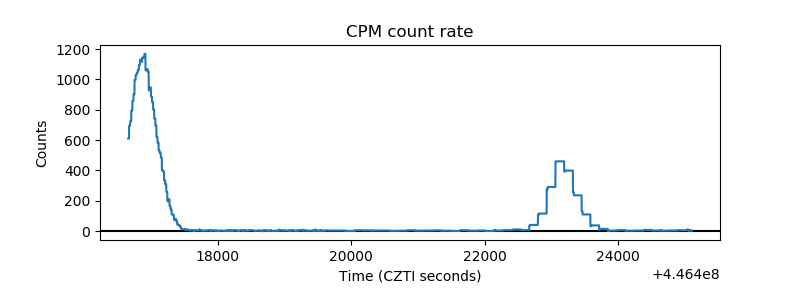 |
| CZT Counter | 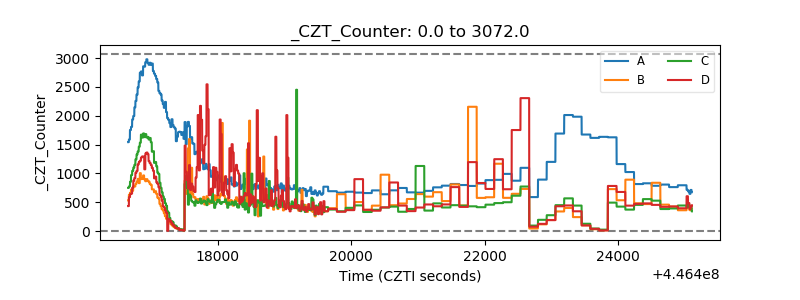 |
| +2.5 Volts monitor | 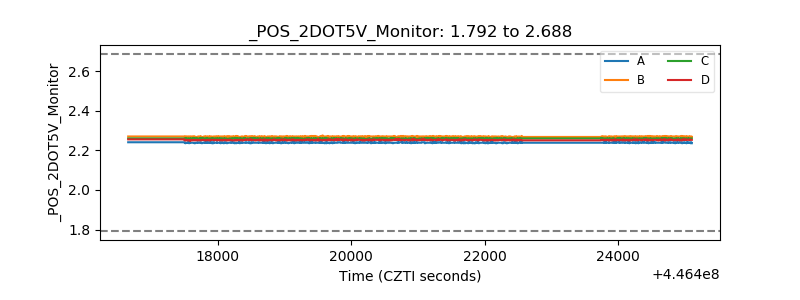 |
| +5 Volts monitor | 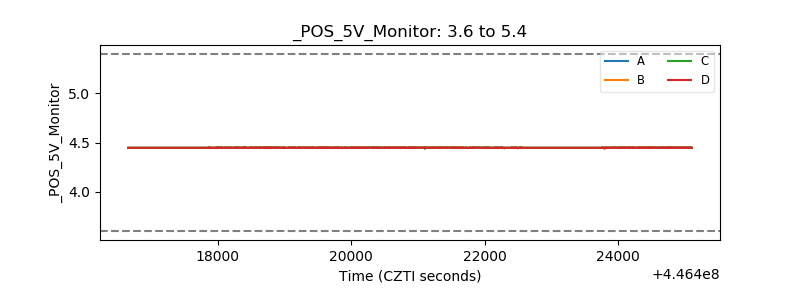 |
| _ROLL_ROT | 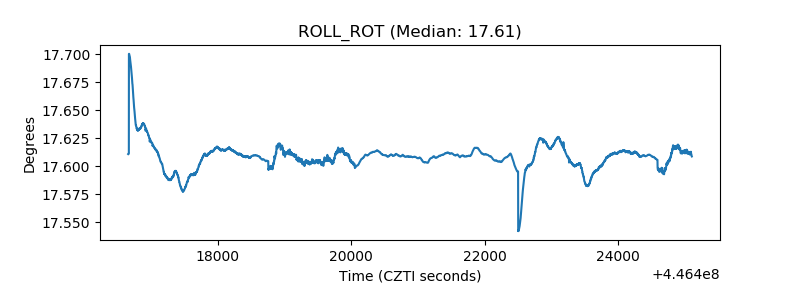 |
| _Roll_DEC | 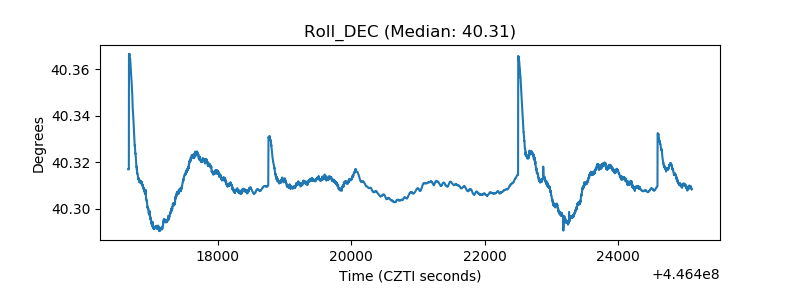 |
| _Roll_RA | 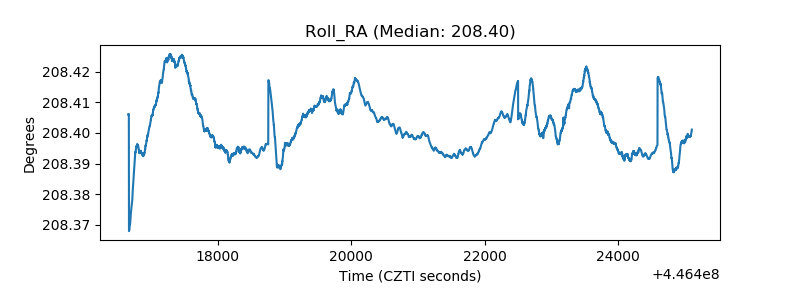 |
| Veto Counter | 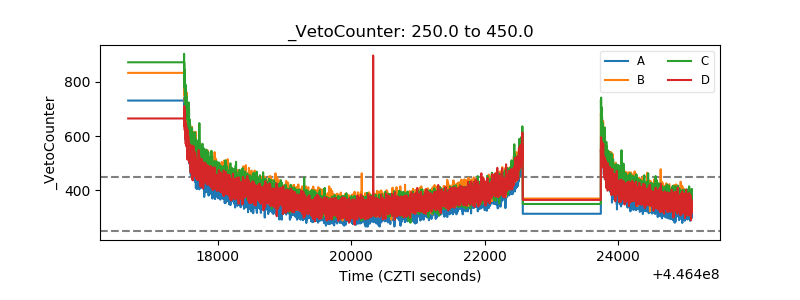 |