| Param | Original file | Final file |
|---|---|---|
| Filename | modeM0/AS1A13_038T04_9000006090_45464cztM0_level2.fits | modeM0/AS1A13_038T04_9000006090_45464cztM0_level2_quad_clean.evt |
| Size (bytes) | 229,795,200 | 57,254,400 |
| Size | 219.1 MB | 54.6 MB |
| Events in quadrant A | 2,803,941 | 368,746 |
| Events in quadrant B | 1,980,686 | 387,439 |
| Events in quadrant C | 1,659,164 | 377,445 |
| Events in quadrant D | 1,781,487 | 345,202 |
| Mode M0 | |||
|---|---|---|---|
| Quadrant | BADHDUFLAG | Total packets | Discarded packets |
| A | 0 | 15125 | 4350 |
| B | 0 | 11339 | 3027 |
| C | 0 | 10351 | 2717 |
| D | 0 | 10654 | 2784 |
| Mode M9 | |||
|---|---|---|---|
| Quadrant | BADHDUFLAG | Total packets | Discarded packets |
| A | 1 | 139820674172968 | 139818365354030 |
| B | 1 | -1 | -1 |
| C | 1 | -1 | -1 |
| D | 1 | -1 | -1 |
| Mode SS | |||
|---|---|---|---|
| Quadrant | BADHDUFLAG | Total packets | Discarded packets |
| A | 0 | 96 | 23 |
| B | 0 | 99 | 24 |
| C | 0 | 102 | 26 |
| D | 0 | 102 | 24 |
| Quadrant | Total seconds | Saturated seconds | Saturation percentage |
|---|---|---|---|
| A | 3484 | 30 | 0.861079% |
| B | 3599 | 84 | 2.333982% |
| C | 3635 | 7 | 0.192572% |
| D | 3626 | 11 | 0.303365% |
Noise dominated data is calculated using 1-second bins in cleaned event files. If a bin has >2000 counts, and if more than 50% of those come from <1% of pixels, then it is considered to be noise-dominated and hence unusable.
| Quadrant | # 1 sec bins | Bins with >0 counts | Bins with >2000 counts | High rate bins dominated by noise | Noise dominated (total time) | Noise dominated (detector-on time) | Marked lightcurve |
|---|---|---|---|---|---|---|---|
| A | 4313 | 3700 | 0 | 0 | 0.00% | 0.00% | 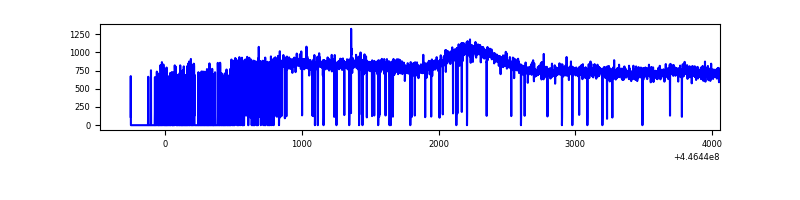 |
| B | 4483 | 3854 | 30 | 30 | 0.67% | 0.78% | 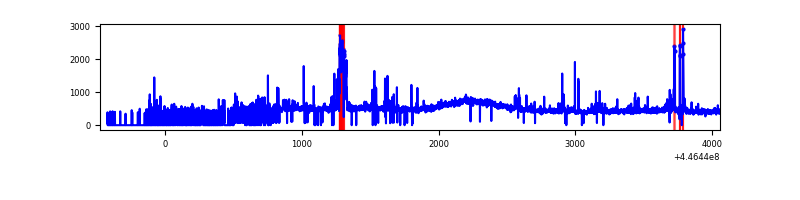 |
| C | 4538 | 3882 | 1 | 1 | 0.02% | 0.03% | 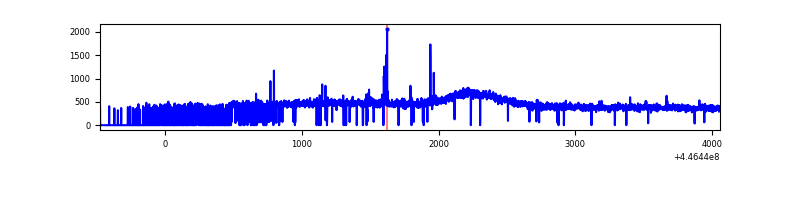 |
| D | 4443 | 3863 | 5 | 5 | 0.11% | 0.13% | 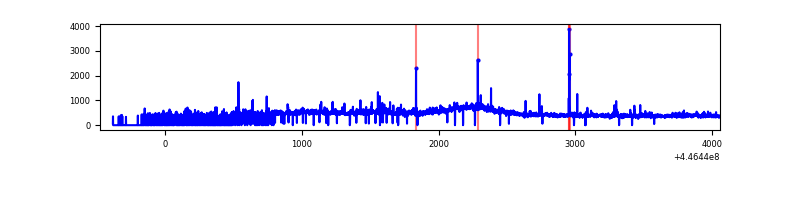 |
Top three noisy pixels from each quadrant. If the there are fewer than three noisy pixels in the level2.evt file, extra rows are filled as -1
| Pixel properties | Quadrant properties | ||||||
|---|---|---|---|---|---|---|---|
| Quadrant | DetID | PixID | Counts | Sigma | Mean | Median | Sigma |
| A | 10 | 83 | 1219952 | 13901.82 | 408 | 398 | 87.7 |
| A | 0 | 243 | 9813 | 107.32 | 408 | 398 | 87.7 |
| A | 3 | 137 | 4817 | 50.37 | 408 | 398 | 87.7 |
| B | 15 | 201 | 120057 | 1385.04 | 423 | 409 | 86.4 |
| B | 3 | 112 | 99357 | 1145.41 | 423 | 409 | 86.4 |
| B | 5 | 172 | 46630 | 535.05 | 423 | 409 | 86.4 |
| C | 14 | 254 | 13571 | 130.02 | 421 | 422 | 101.1 |
| C | 13 | 61 | 2707 | 22.6 | 421 | 422 | 101.1 |
| C | 1 | 3 | 2692 | 22.45 | 421 | 422 | 101.1 |
| D | 11 | 241 | 49519 | 466.87 | 416 | 403 | 105.2 |
| D | 1 | 52 | 38689 | 363.93 | 416 | 403 | 105.2 |
| D | 13 | 249 | 28878 | 270.67 | 416 | 403 | 105.2 |
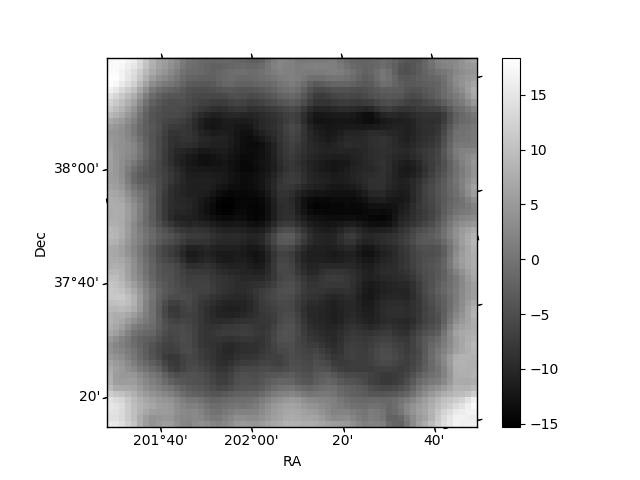
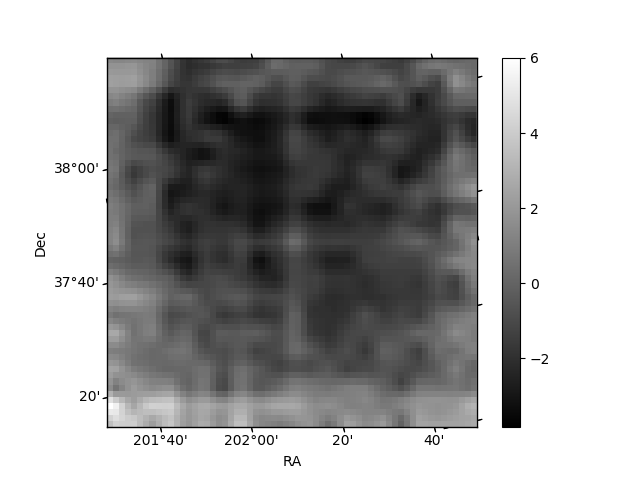
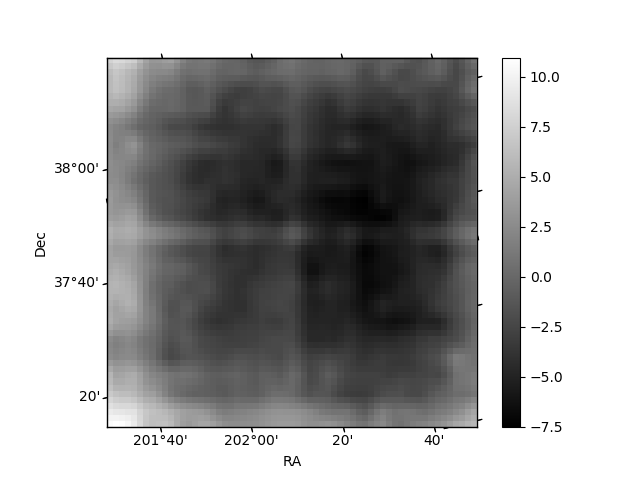
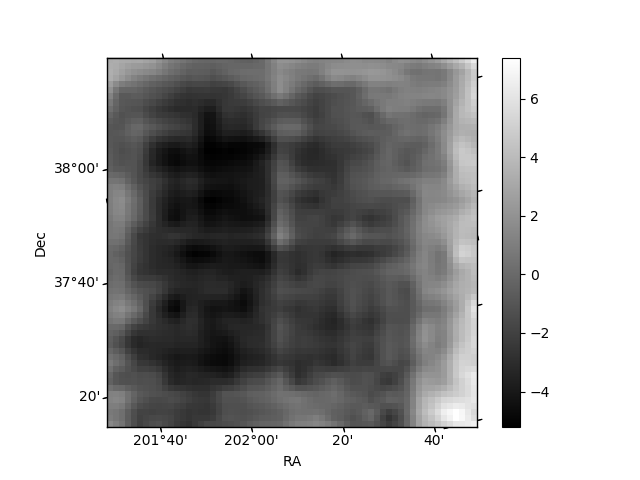
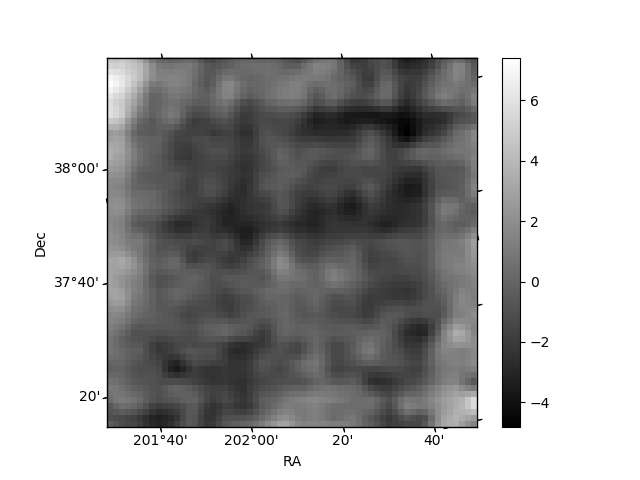
Histogram calculated using DETX and DETY for each event in the final _common_clean file
| Quadrant A | 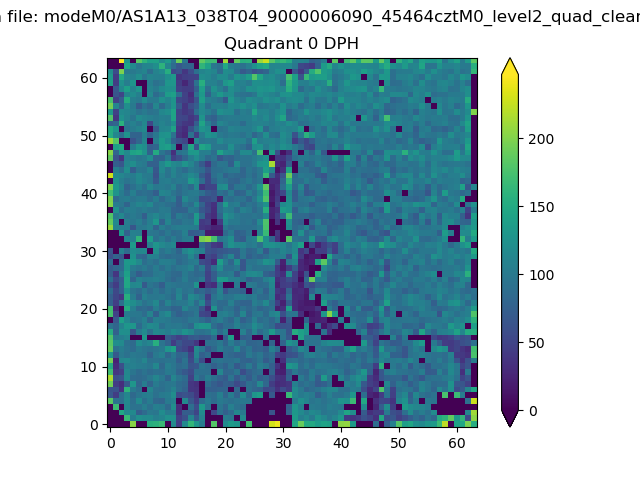 |
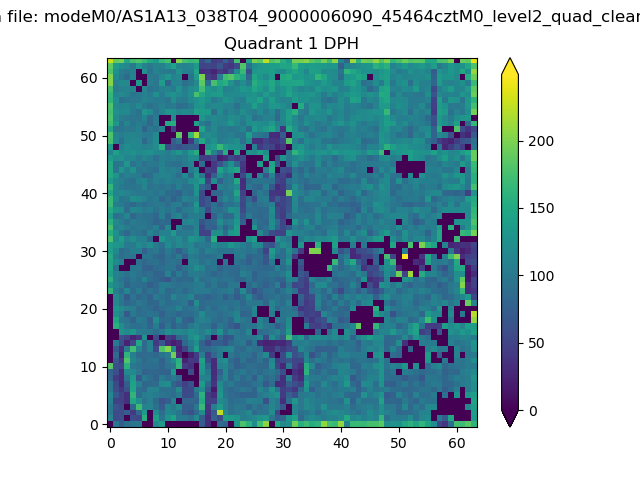 |
Quadrant B |
|---|---|---|---|
| Quadrant D | 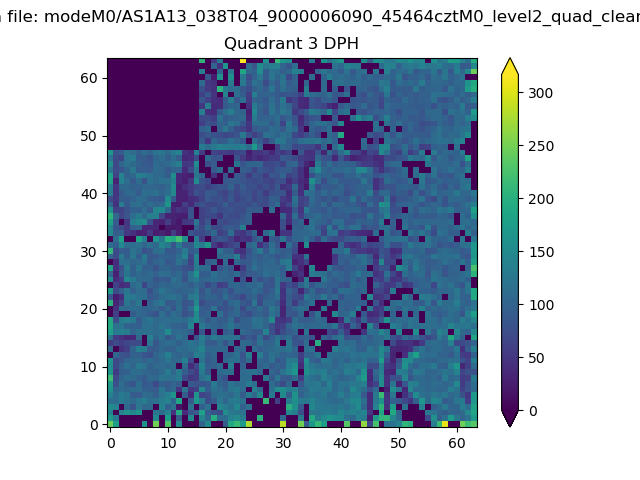 |
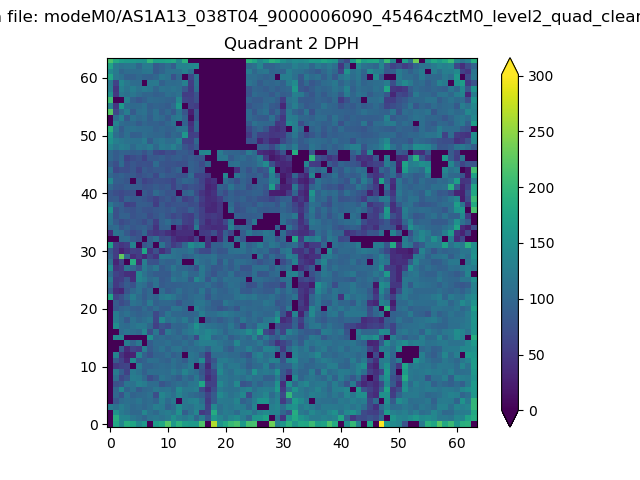 |
Quadrant C |
| Plot type | Count rate plots | Images |
|---|---|---|
| Comparison with Poisson distribution Blue bars denote a histogram of data divided into 1 sec bins. Red curve is a Poisson curve with rate = median count rate of data. |
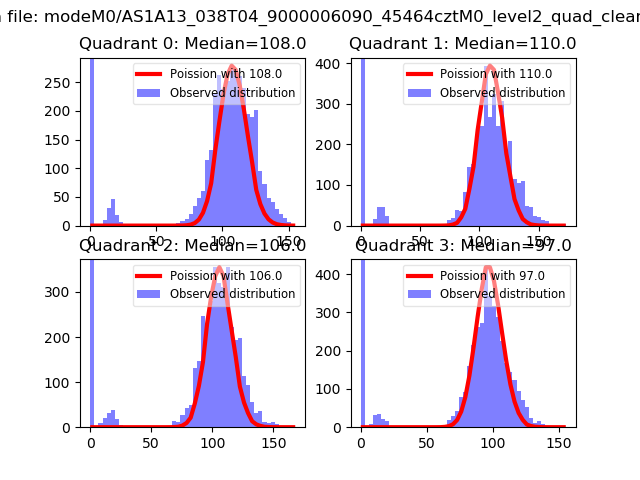 |
 |
| Quadrant-wise count rates Data is divided into 100 sec bins |
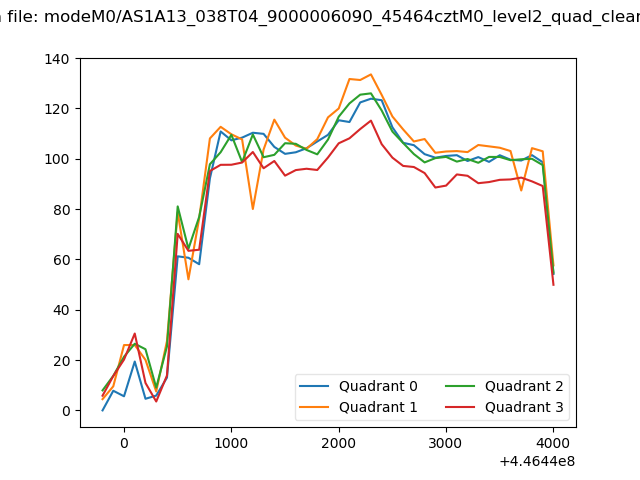 |
|
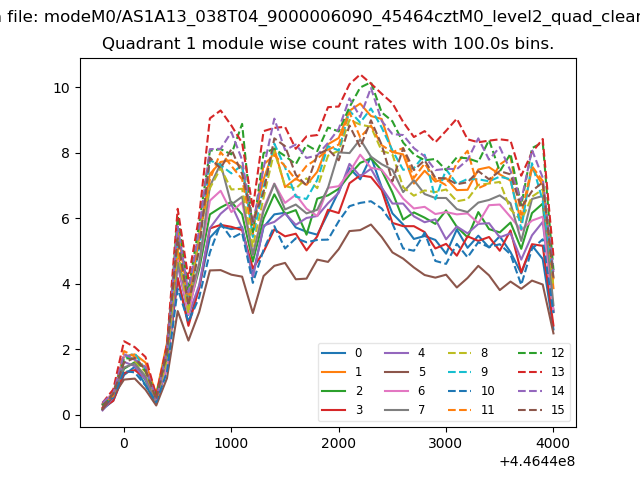
| Module-wise count rates for Quadrant A Data is divided into 100 sec bins |
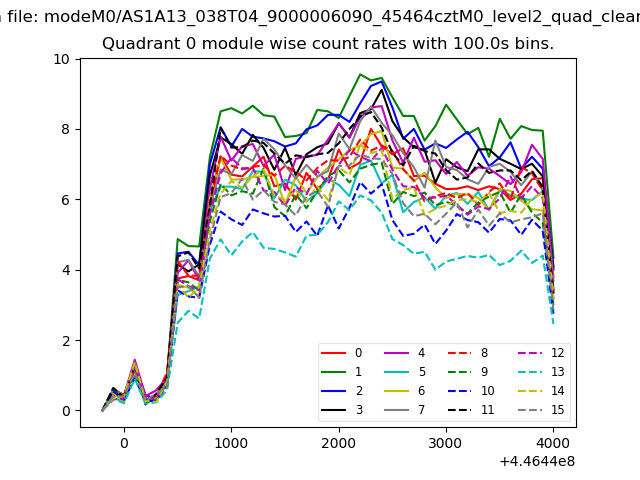 |
 |
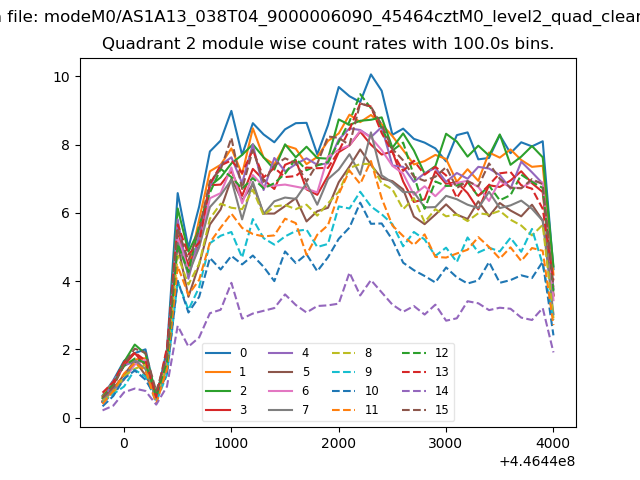
| Module-wise count rates for Quadrant B Data is divided into 100 sec bins |
 |
 |
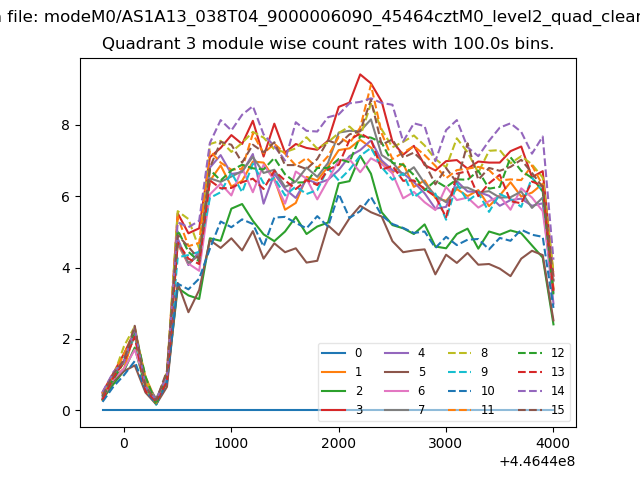
| Module-wise count rates for Quadrant C Data is divided into 100 sec bins |
 |
 |
| Module-wise count rates for Quadrant D Data is divided into 100 sec bins |
 |
 |
| Parameter | Plot |
|---|---|
| CZT HV Monitor |  |
| D_VDD | 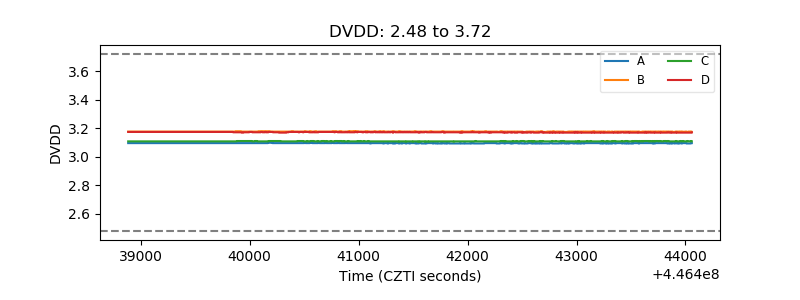 |
| Temperature 1 | 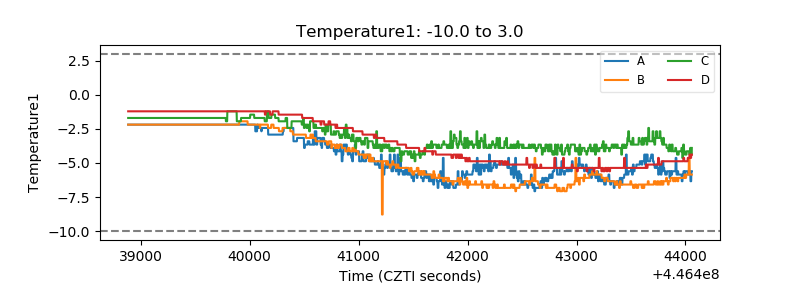 |
| Veto HV Monitor | 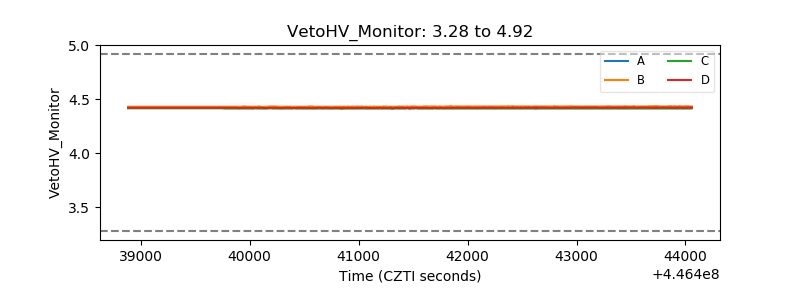 |
| Veto LLD | 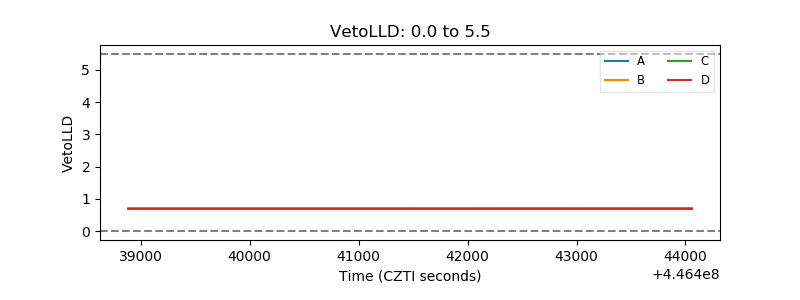 |
| Alpha Counter | 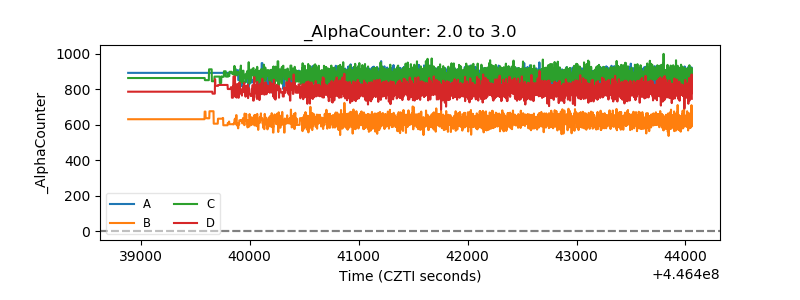 |
| _CPM_Rate | 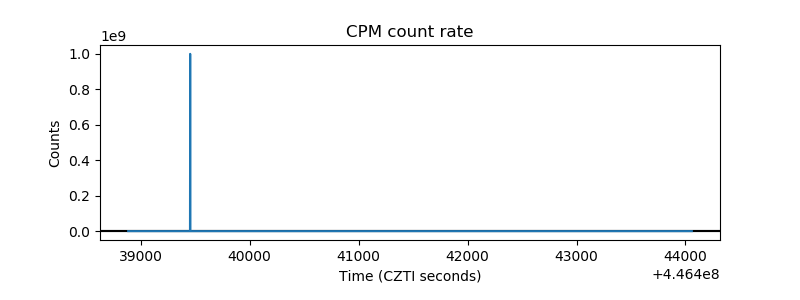 |
| CZT Counter | 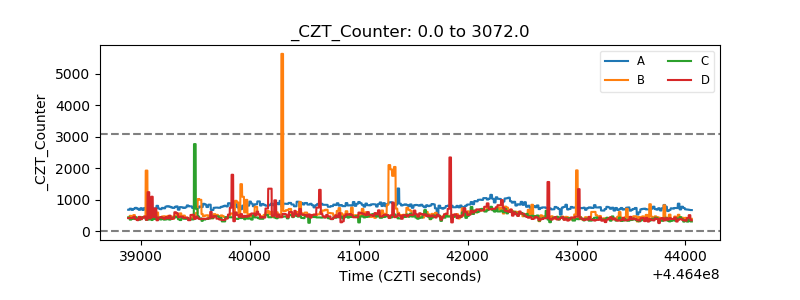 |
| +2.5 Volts monitor | 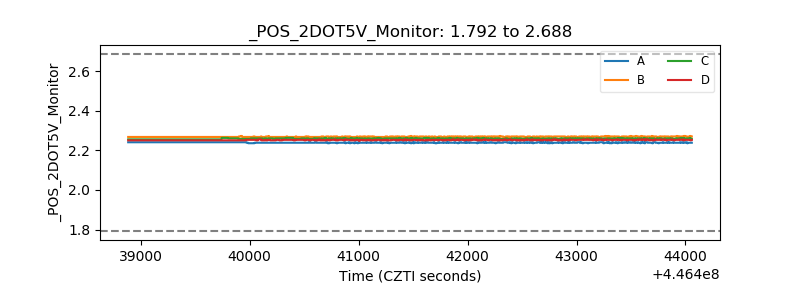 |
| +5 Volts monitor | 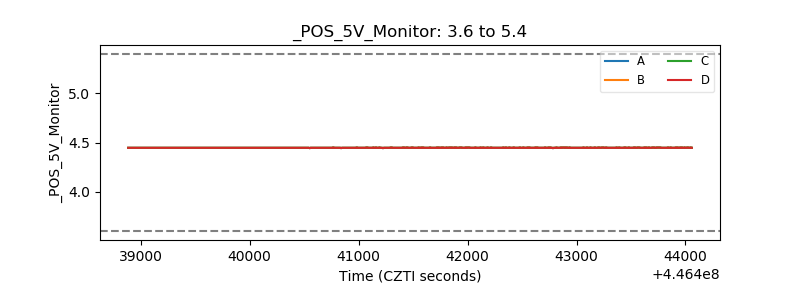 |
| _ROLL_ROT | 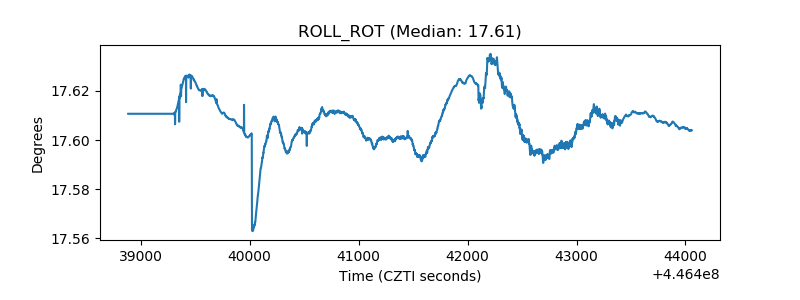 |
| _Roll_DEC | 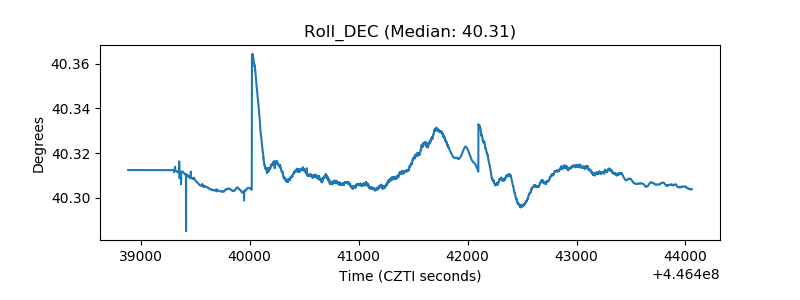 |
| _Roll_RA | 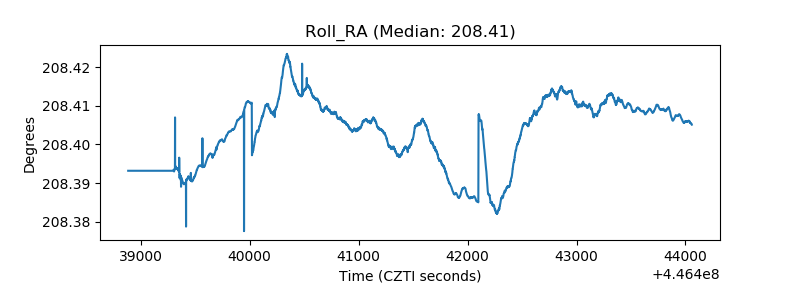 |
| Veto Counter | 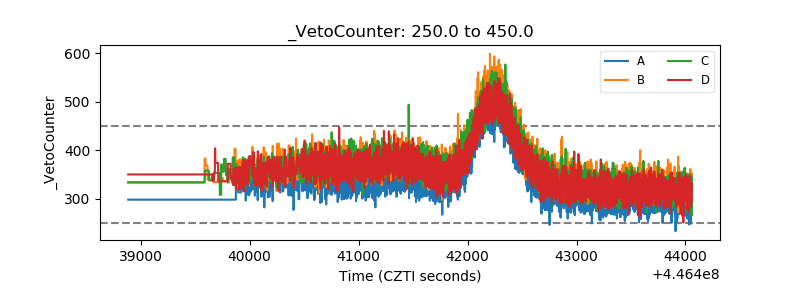 |