| Param | Original file | Final file |
|---|---|---|
| Filename | modeM0/AS1A13_038T04_9000006090_45468cztM0_level2.fits | modeM0/AS1A13_038T04_9000006090_45468cztM0_level2_quad_clean.evt |
| Size (bytes) | 1,215,106,560 | 293,834,880 |
| Size | 1.1 GB | 280.2 MB |
| Events in quadrant A | 15,162,360 | 1,913,406 |
| Events in quadrant B | 9,436,533 | 1,989,272 |
| Events in quadrant C | 8,378,041 | 1,933,158 |
| Events in quadrant D | 10,522,572 | 1,743,398 |
| Mode M0 | |||
|---|---|---|---|
| Quadrant | BADHDUFLAG | Total packets | Discarded packets |
| A | 0 | 58626 | 2 |
| B | 0 | 41245 | 2 |
| C | 0 | 39379 | 8 |
| D | 0 | 44110 | 2 |
| Mode M9 | |||
|---|---|---|---|
| Quadrant | BADHDUFLAG | Total packets | Discarded packets |
| A | 0 | 11 | 0 |
| B | 0 | 11 | 0 |
| C | 0 | 11 | 0 |
| D | 0 | 11 | 0 |
| Mode SS | |||
|---|---|---|---|
| Quadrant | BADHDUFLAG | Total packets | Discarded packets |
| A | 0 | 386 | 0 |
| B | 0 | 386 | 0 |
| C | 0 | 386 | 0 |
| D | 0 | 386 | 0 |
| Quadrant | Total seconds | Saturated seconds | Saturation percentage |
|---|---|---|---|
| A | 19116 | 672 | 3.515380% |
| B | 19117 | 646 | 3.379191% |
| C | 19114 | 351 | 1.836350% |
| D | 19116 | 559 | 2.924252% |
Noise dominated data is calculated using 1-second bins in cleaned event files. If a bin has >2000 counts, and if more than 50% of those come from <1% of pixels, then it is considered to be noise-dominated and hence unusable.
| Quadrant | # 1 sec bins | Bins with >0 counts | Bins with >2000 counts | High rate bins dominated by noise | Noise dominated (total time) | Noise dominated (detector-on time) | Marked lightcurve |
|---|---|---|---|---|---|---|---|
| A | 20161 | 19118 | 7 | 7 | 0.03% | 0.04% | 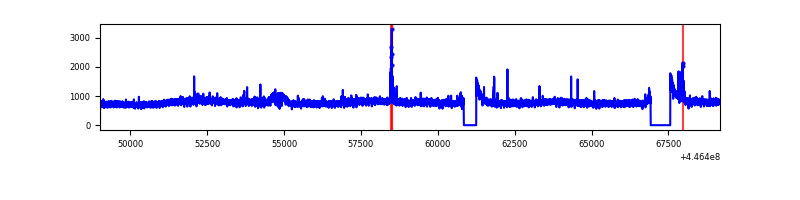 |
| B | 20162 | 19119 | 102 | 102 | 0.51% | 0.53% | 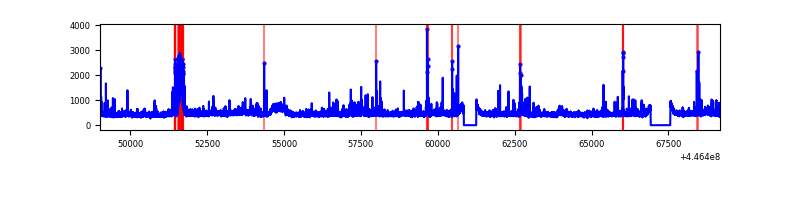 |
| C | 20162 | 19117 | 25 | 25 | 0.12% | 0.13% | 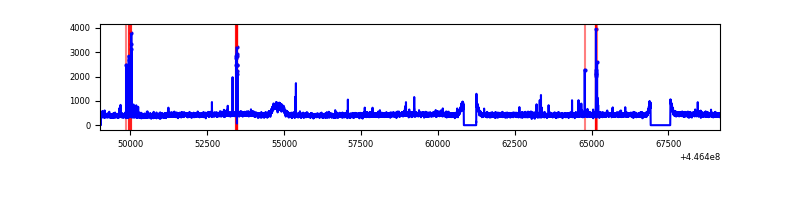 |
| D | 20161 | 19118 | 144 | 144 | 0.71% | 0.75% | 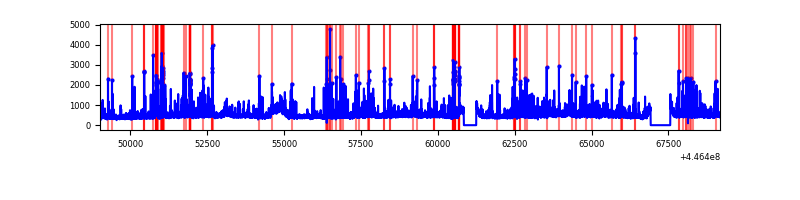 |
Top three noisy pixels from each quadrant. If the there are fewer than three noisy pixels in the level2.evt file, extra rows are filled as -1
| Pixel properties | Quadrant properties | ||||||
|---|---|---|---|---|---|---|---|
| Quadrant | DetID | PixID | Counts | Sigma | Mean | Median | Sigma |
| A | 10 | 83 | 6782542 | 15281.17 | 2130 | 2081 | 443.7 |
| A | 13 | 248 | 58287 | 126.67 | 2130 | 2081 | 443.7 |
| A | 13 | 210 | 44429 | 95.44 | 2130 | 2081 | 443.7 |
| B | 15 | 201 | 446120 | 1053.1 | 2125 | 2057 | 421.7 |
| B | 5 | 172 | 192092 | 450.67 | 2125 | 2057 | 421.7 |
| B | 3 | 112 | 111288 | 259.04 | 2125 | 2057 | 421.7 |
| C | 14 | 254 | 81521 | 162.44 | 2100 | 2111 | 488.8 |
| C | 3 | 233 | 37110 | 71.59 | 2100 | 2111 | 488.8 |
| C | 1 | 3 | 22122 | 40.93 | 2100 | 2111 | 488.8 |
| D | 1 | 52 | 712648 | 1362.38 | 2093 | 2027 | 521.6 |
| D | 11 | 241 | 547809 | 1046.35 | 2093 | 2027 | 521.6 |
| D | 13 | 249 | 398887 | 760.85 | 2093 | 2027 | 521.6 |
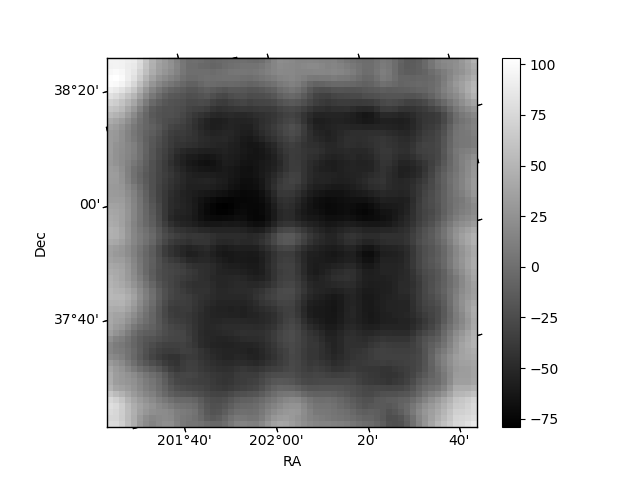
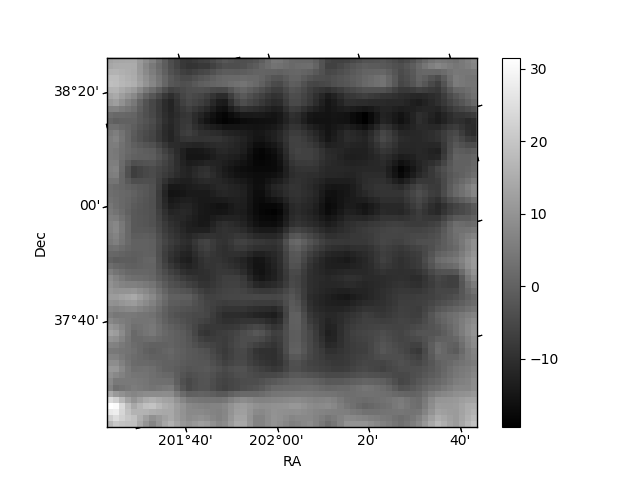
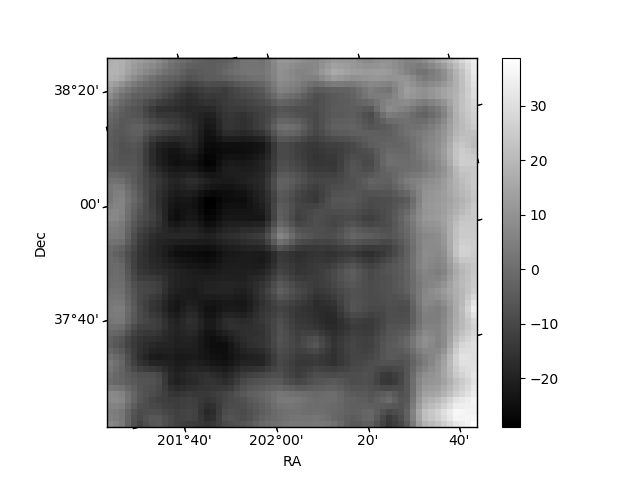
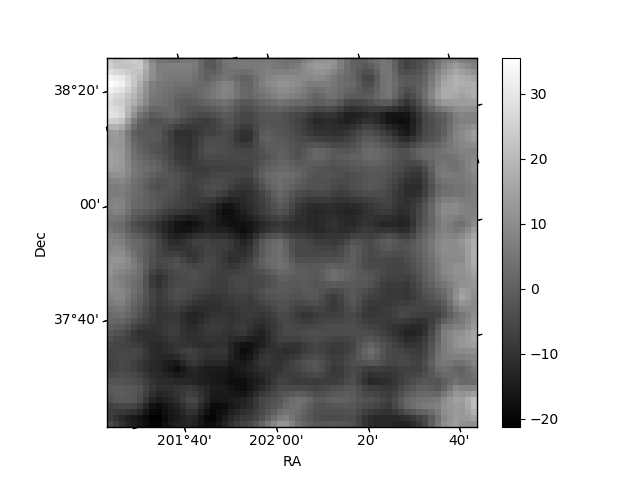
Histogram calculated using DETX and DETY for each event in the final _common_clean file
| Quadrant A | 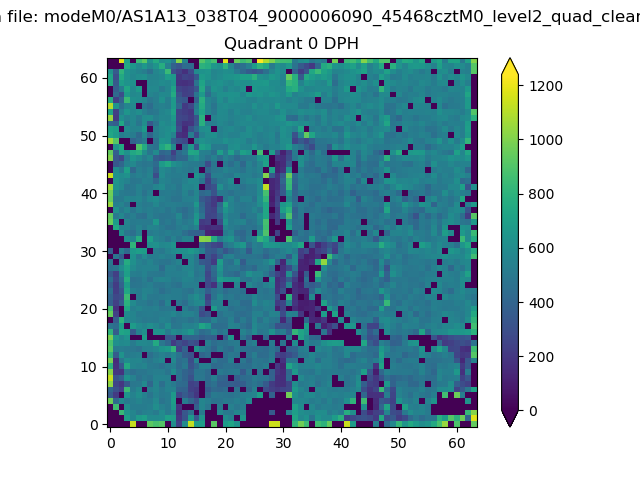 |
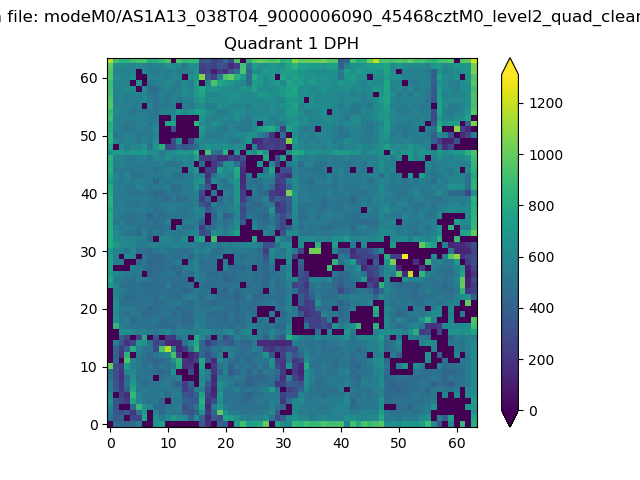 |
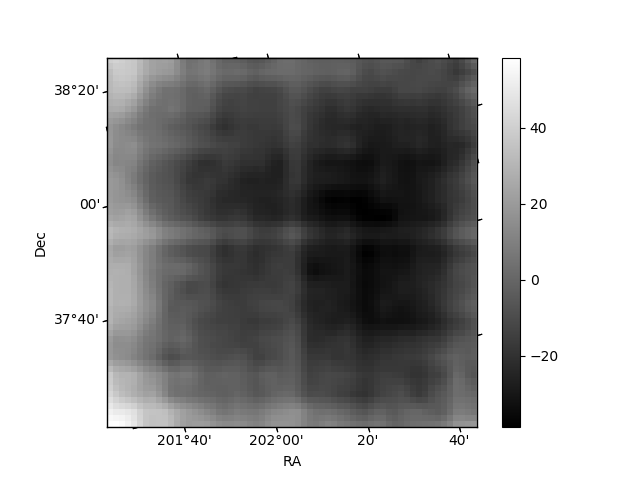
Quadrant B |
|---|---|---|---|
| Quadrant D | 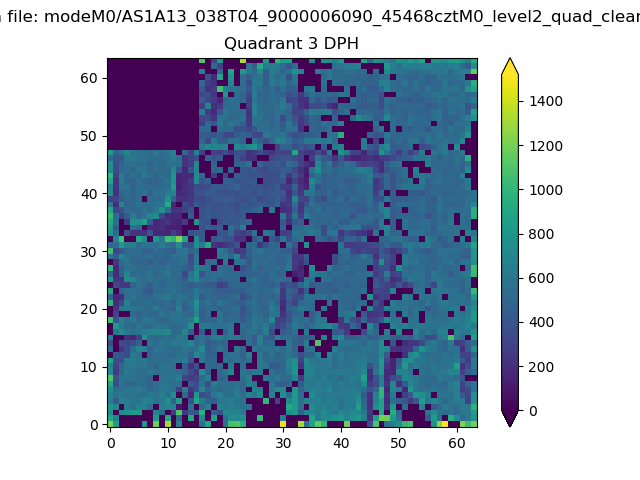 |
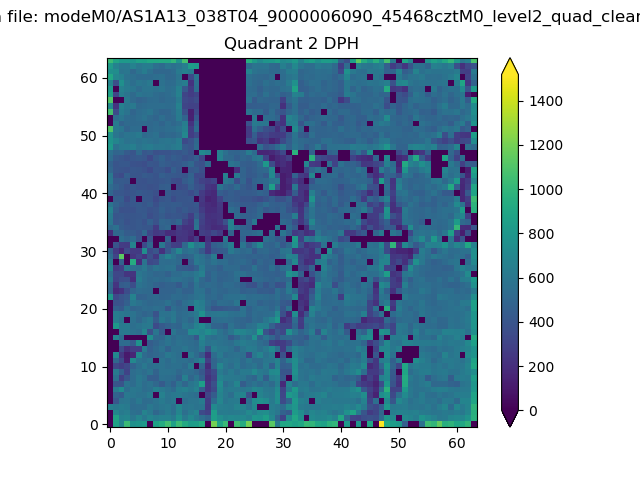 |
Quadrant C |
| Plot type | Count rate plots | Images |
|---|---|---|
| Comparison with Poisson distribution Blue bars denote a histogram of data divided into 1 sec bins. Red curve is a Poisson curve with rate = median count rate of data. |
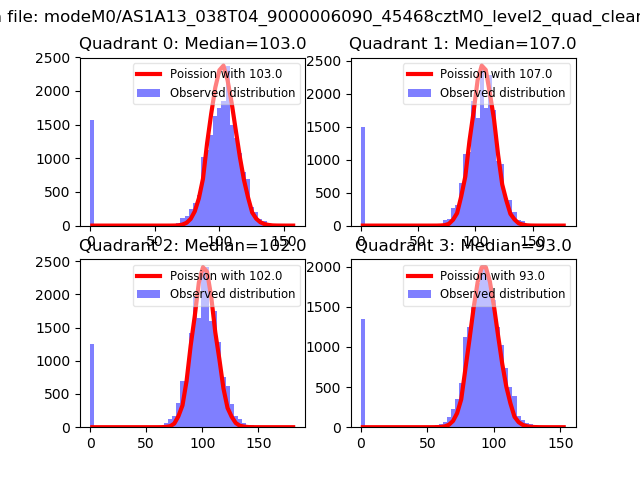 |
 |
| Quadrant-wise count rates Data is divided into 100 sec bins |
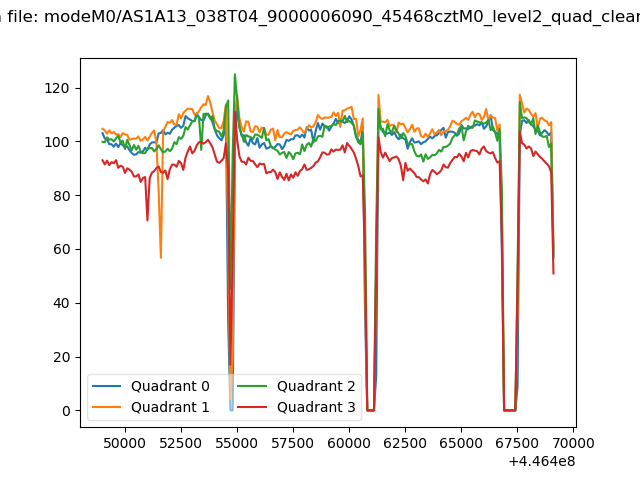 |
|
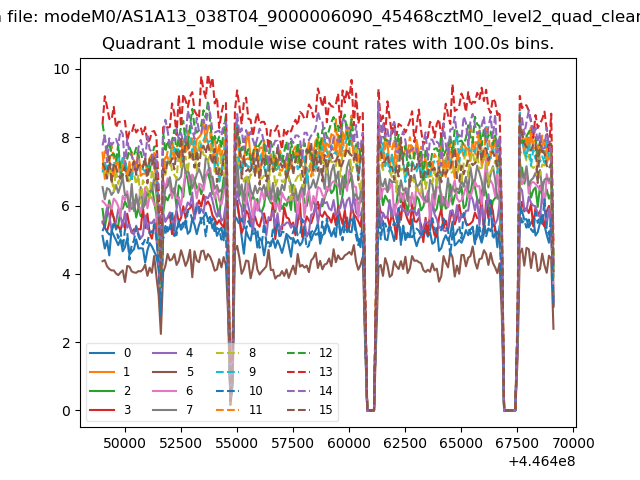
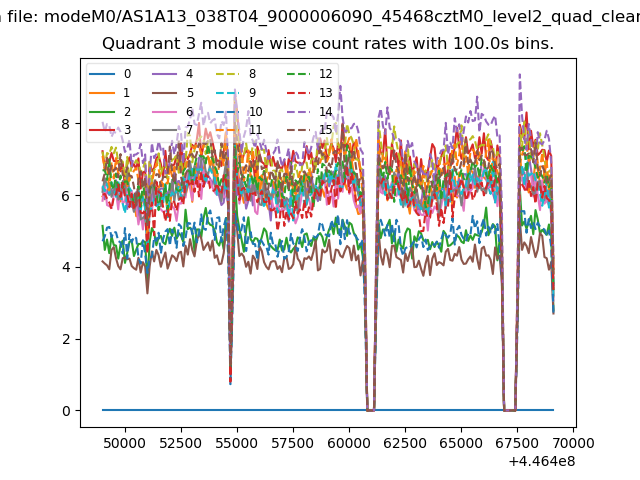
| Module-wise count rates for Quadrant A Data is divided into 100 sec bins |
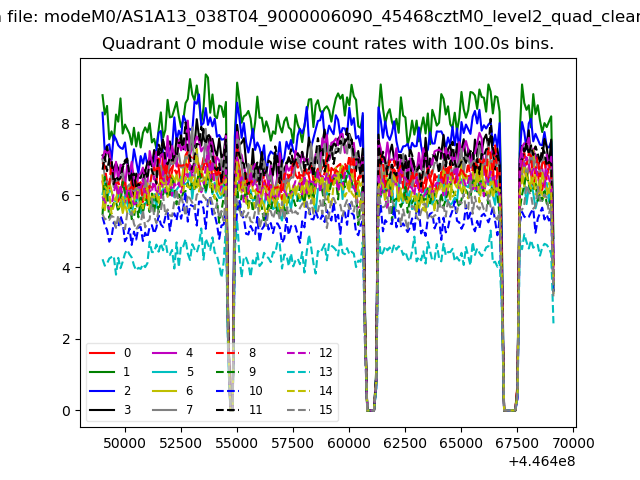 |
 |
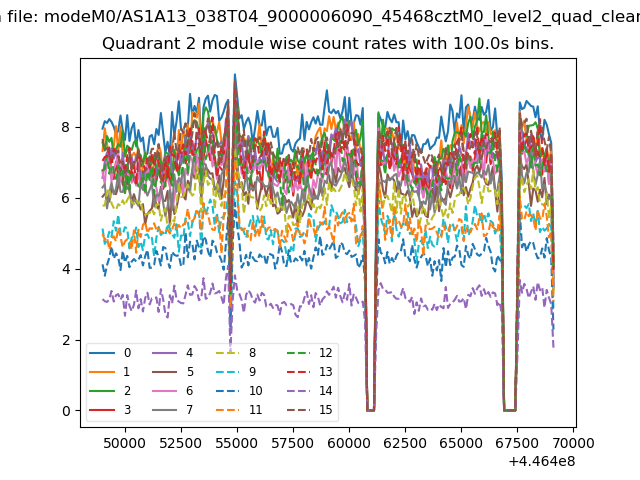
| Module-wise count rates for Quadrant B Data is divided into 100 sec bins |
 |
 |
| Module-wise count rates for Quadrant C Data is divided into 100 sec bins |
 |
 |
| Module-wise count rates for Quadrant D Data is divided into 100 sec bins |
 |
 |
| Parameter | Plot |
|---|---|
| CZT HV Monitor | 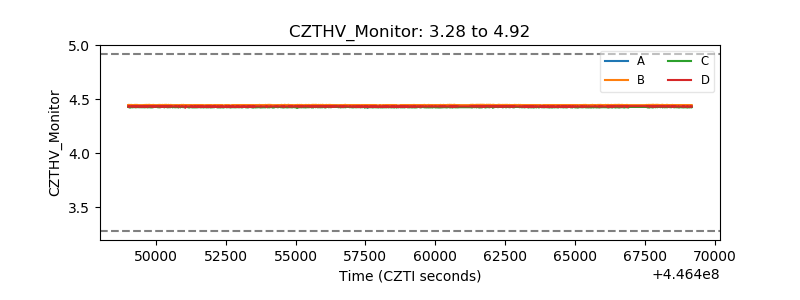 |
| D_VDD | 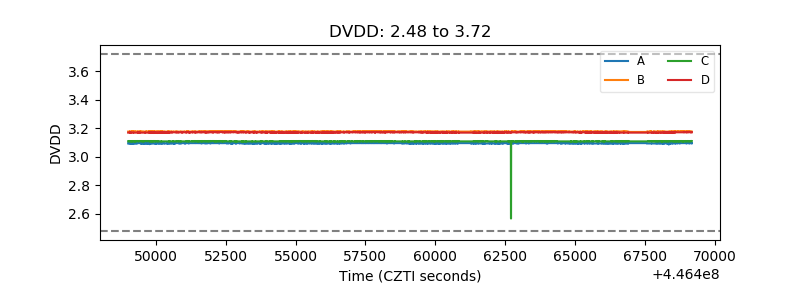 |
| Temperature 1 | 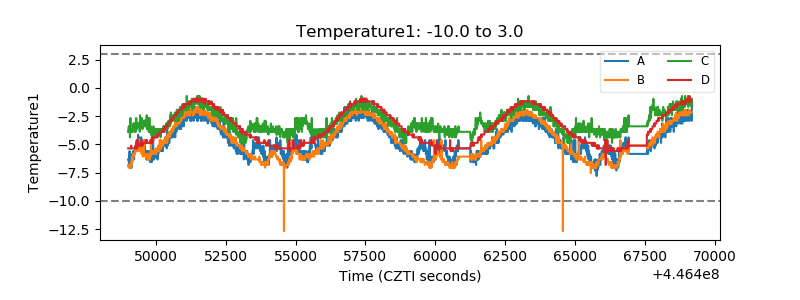 |
| Veto HV Monitor | 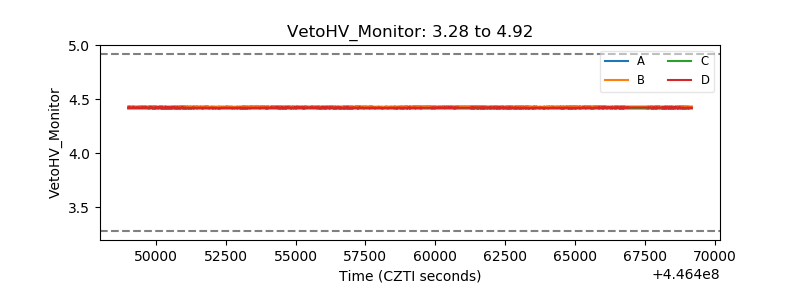 |
| Veto LLD | 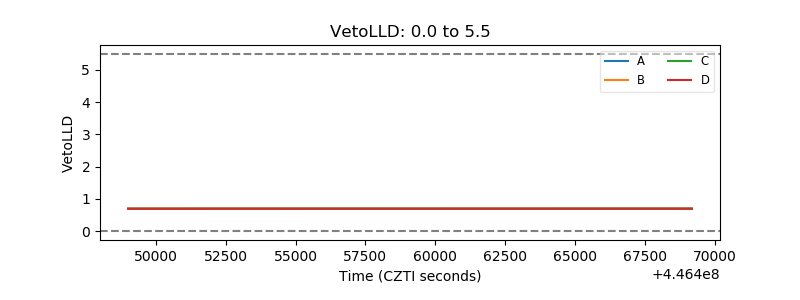 |
| Alpha Counter | 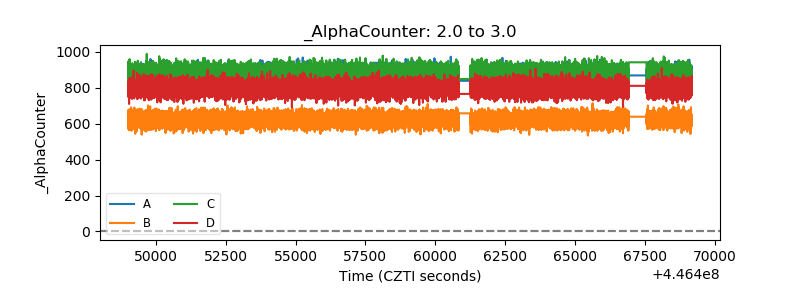 |
| _CPM_Rate | 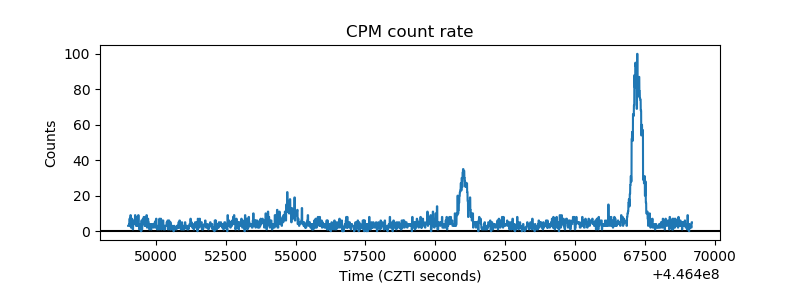 |
| CZT Counter | 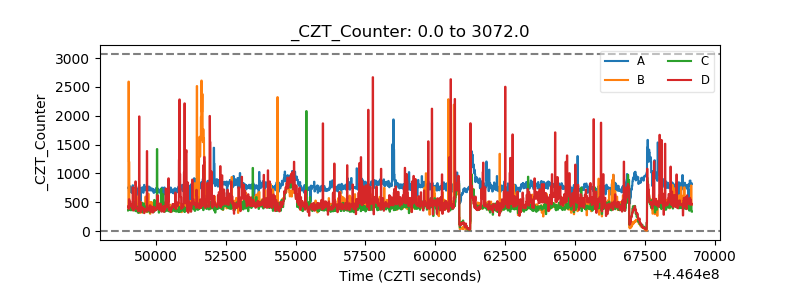 |
| +2.5 Volts monitor |  |
| +5 Volts monitor | 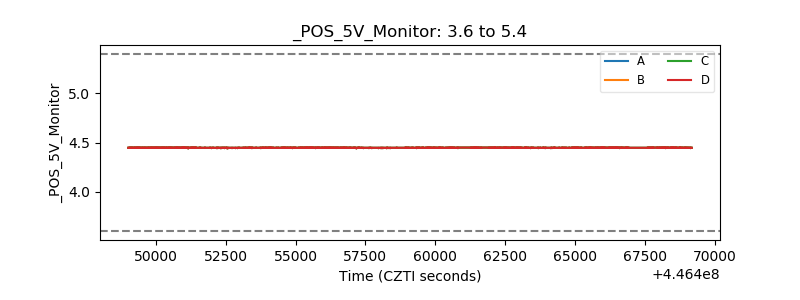 |
| _ROLL_ROT | 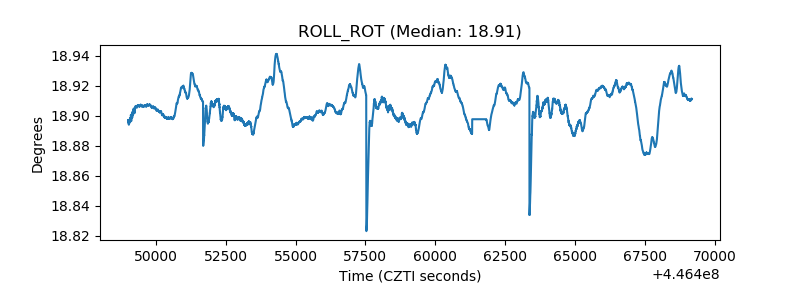 |
| _Roll_DEC | 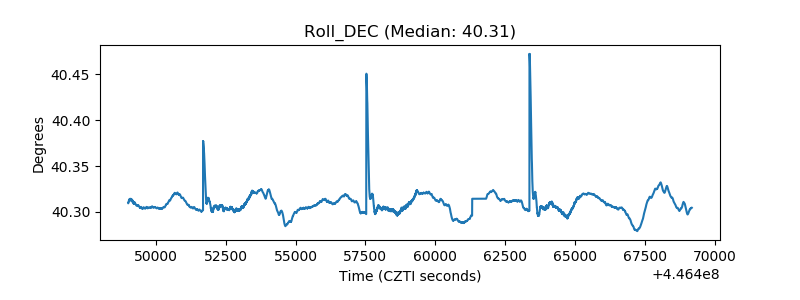 |
| _Roll_RA | 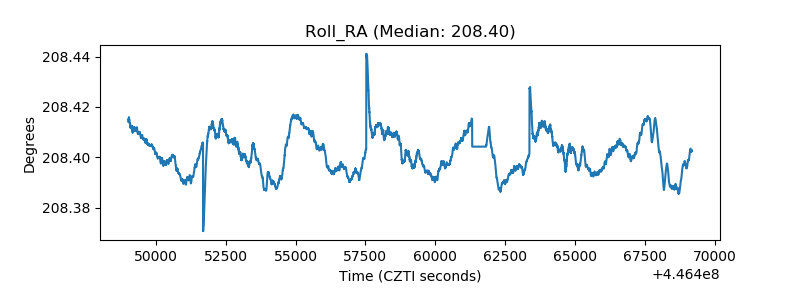 |
| Veto Counter | 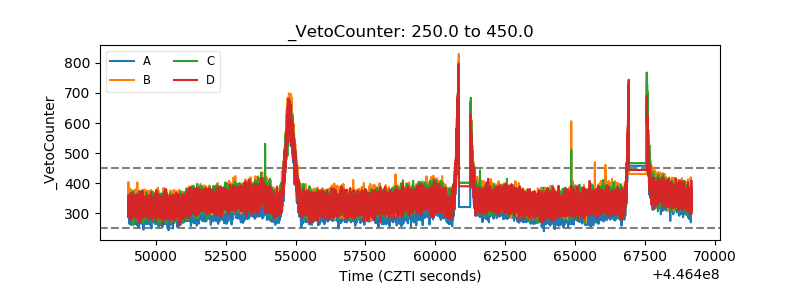 |