| Param | Original file | Final file |
|---|---|---|
| Filename | modeM0/AS1A13_042T03_9000006094_45476cztM0_level2.fits | modeM0/AS1A13_042T03_9000006094_45476cztM0_level2_quad_clean.evt |
| Size (bytes) | 463,320,000 | 116,182,080 |
| Size | 441.9 MB | 110.8 MB |
| Events in quadrant A | 5,952,128 | 757,206 |
| Events in quadrant B | 3,521,533 | 806,280 |
| Events in quadrant C | 3,213,540 | 769,817 |
| Events in quadrant D | 3,921,499 | 698,180 |
| Mode SS | |||
|---|---|---|---|
| Quadrant | BADHDUFLAG | Total packets | Discarded packets |
| A | 0 | 146 | 0 |
| B | 0 | 146 | 0 |
| C | 0 | 146 | 0 |
| D | 0 | 146 | 0 |
| Mode M9 | |||
|---|---|---|---|
| Quadrant | BADHDUFLAG | Total packets | Discarded packets |
| A | 0 | 21 | 0 |
| B | 0 | 21 | 0 |
| C | 0 | 21 | 0 |
| D | 0 | 21 | 0 |
| Mode M0 | |||
|---|---|---|---|
| Quadrant | BADHDUFLAG | Total packets | Discarded packets |
| A | 0 | 22949 | 2 |
| B | 0 | 15335 | 2 |
| C | 0 | 14630 | 2 |
| D | 0 | 16734 | 2 |
| Quadrant | Total seconds | Saturated seconds | Saturation percentage |
|---|---|---|---|
| A | 6977 | 274 | 3.927189% |
| B | 6977 | 140 | 2.006593% |
| C | 6977 | 52 | 0.745306% |
| D | 6977 | 108 | 1.547943% |
Noise dominated data is calculated using 1-second bins in cleaned event files. If a bin has >2000 counts, and if more than 50% of those come from <1% of pixels, then it is considered to be noise-dominated and hence unusable.
| Quadrant | # 1 sec bins | Bins with >0 counts | Bins with >2000 counts | High rate bins dominated by noise | Noise dominated (total time) | Noise dominated (detector-on time) | Marked lightcurve |
|---|---|---|---|---|---|---|---|
| A | 9197 | 6979 | 25 | 25 | 0.27% | 0.36% | 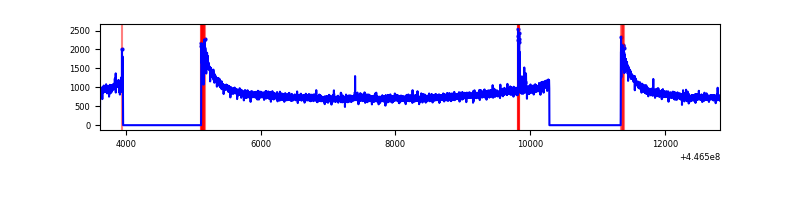 |
| B | 9197 | 6979 | 27 | 27 | 0.29% | 0.39% | 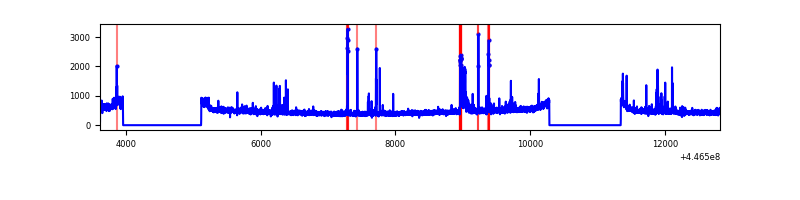 |
| C | 9197 | 6979 | 7 | 7 | 0.08% | 0.10% | 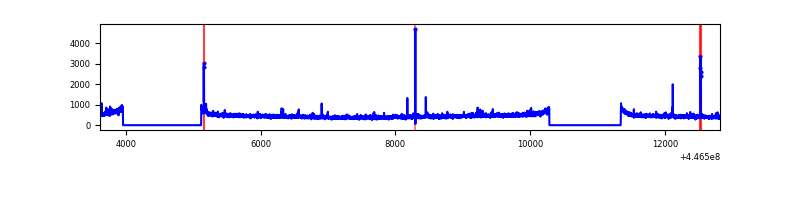 |
| D | 9197 | 6979 | 47 | 47 | 0.51% | 0.67% | 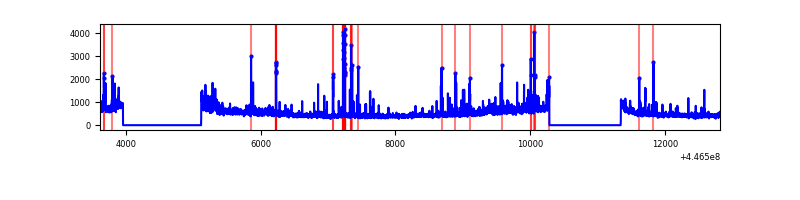 |
Top three noisy pixels from each quadrant. If the there are fewer than three noisy pixels in the level2.evt file, extra rows are filled as -1
| Pixel properties | Quadrant properties | ||||||
|---|---|---|---|---|---|---|---|
| Quadrant | DetID | PixID | Counts | Sigma | Mean | Median | Sigma |
| A | 10 | 83 | 2811110 | 16933.42 | 798 | 782 | 166.0 |
| A | 13 | 248 | 50291 | 298.31 | 798 | 782 | 166.0 |
| A | 3 | 137 | 9344 | 51.59 | 798 | 782 | 166.0 |
| B | 12 | 18 | 69954 | 433.1 | 809 | 786 | 159.7 |
| B | 0 | 189 | 65604 | 405.86 | 809 | 786 | 159.7 |
| B | 5 | 172 | 46457 | 285.97 | 809 | 786 | 159.7 |
| C | 3 | 233 | 33805 | 175.06 | 797 | 800 | 188.5 |
| C | 14 | 254 | 29965 | 154.7 | 797 | 800 | 188.5 |
| C | 12 | 249 | 16593 | 83.77 | 797 | 800 | 188.5 |
| D | 11 | 241 | 311511 | 1572.67 | 787 | 764 | 197.6 |
| D | 1 | 52 | 241050 | 1216.07 | 787 | 764 | 197.6 |
| D | 13 | 249 | 159024 | 800.94 | 787 | 764 | 197.6 |
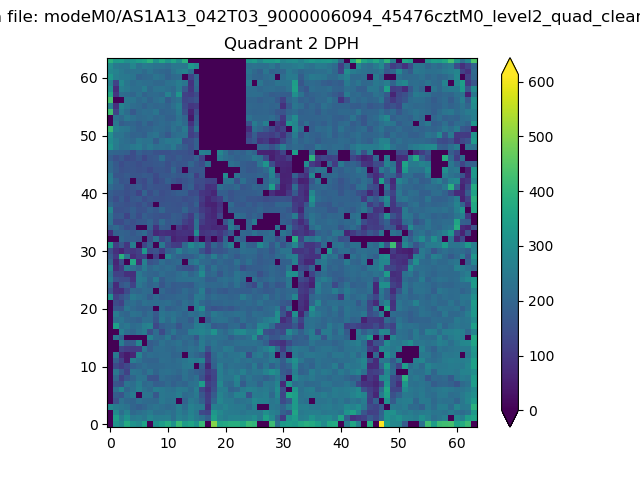
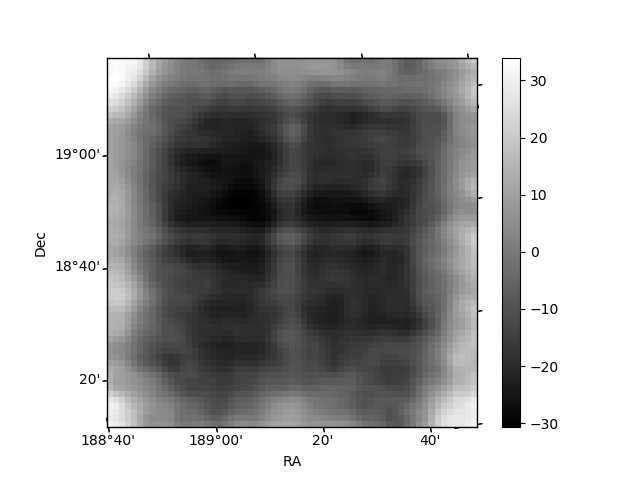
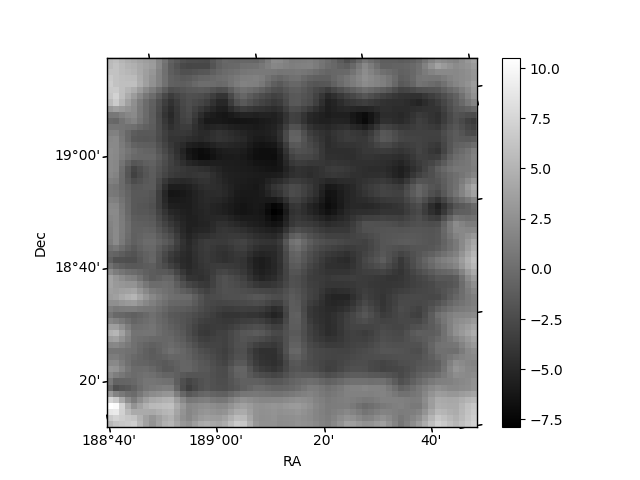
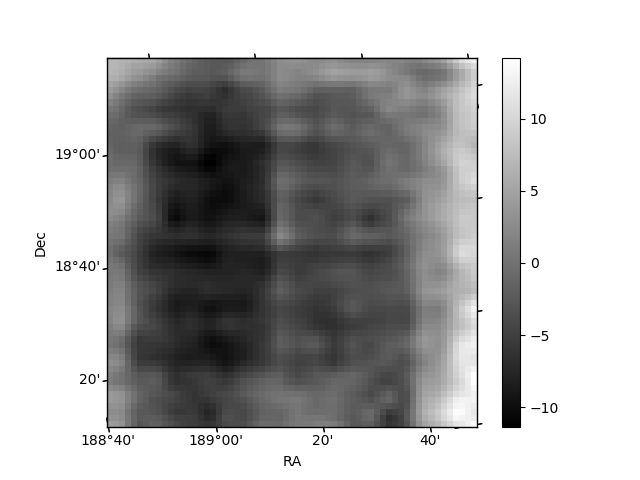
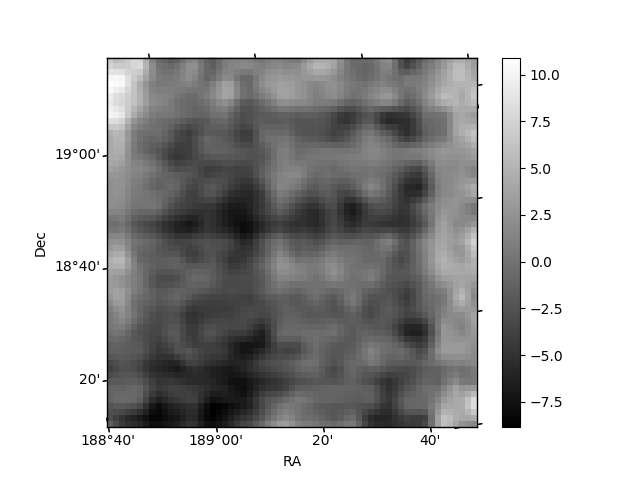
Histogram calculated using DETX and DETY for each event in the final _common_clean file
| Quadrant A | 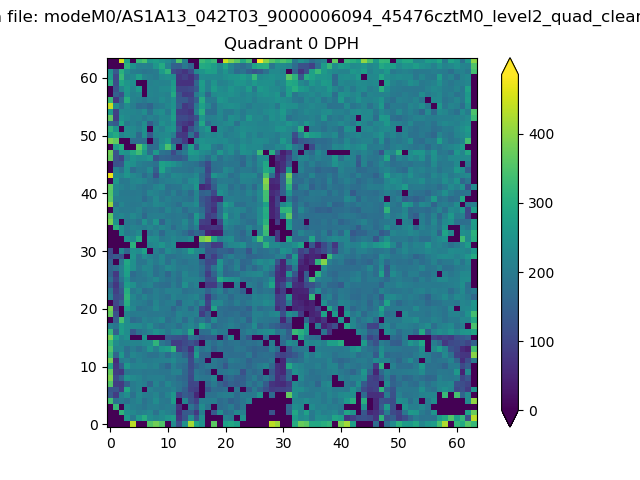 |
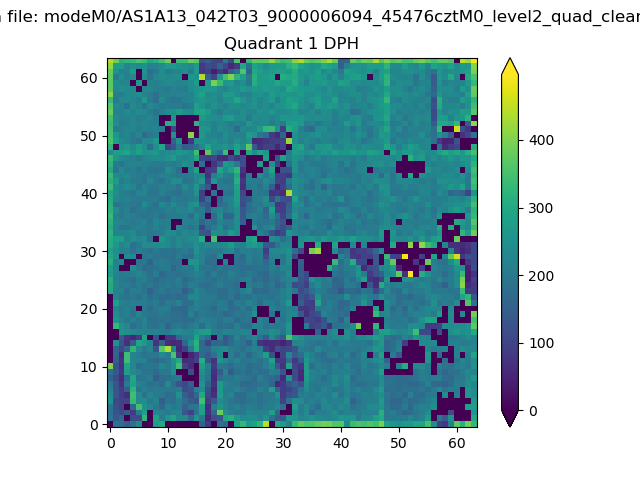 |
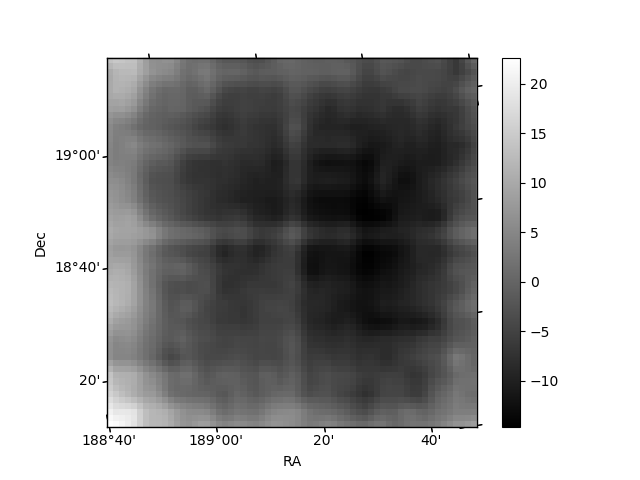
Quadrant B |
|---|---|---|---|
| Quadrant D | 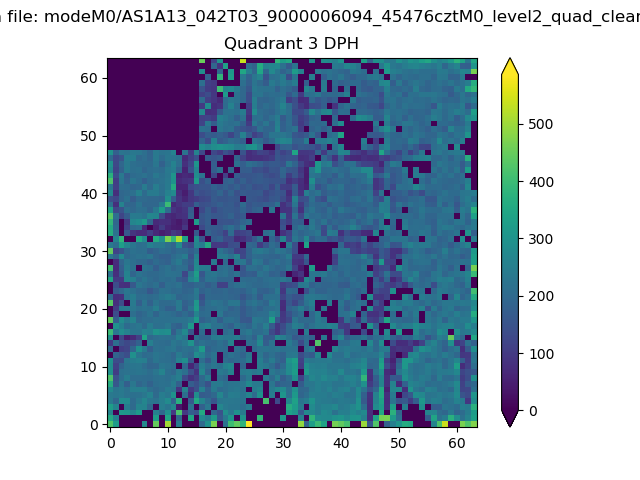 |
 |
Quadrant C |
| Plot type | Count rate plots | Images |
|---|---|---|
| Comparison with Poisson distribution Blue bars denote a histogram of data divided into 1 sec bins. Red curve is a Poisson curve with rate = median count rate of data. |
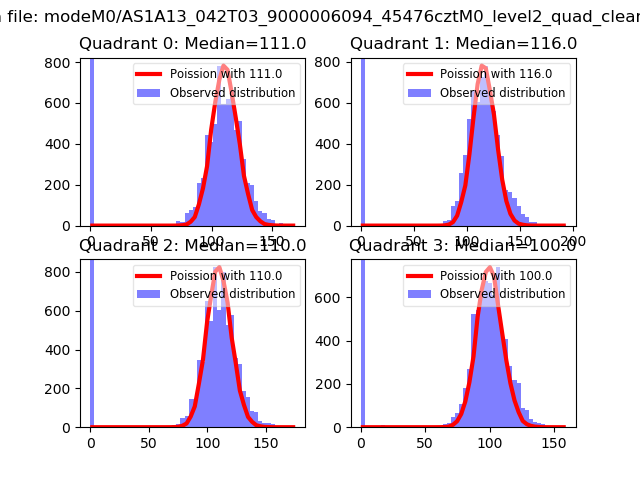 |
 |
| Quadrant-wise count rates Data is divided into 100 sec bins |
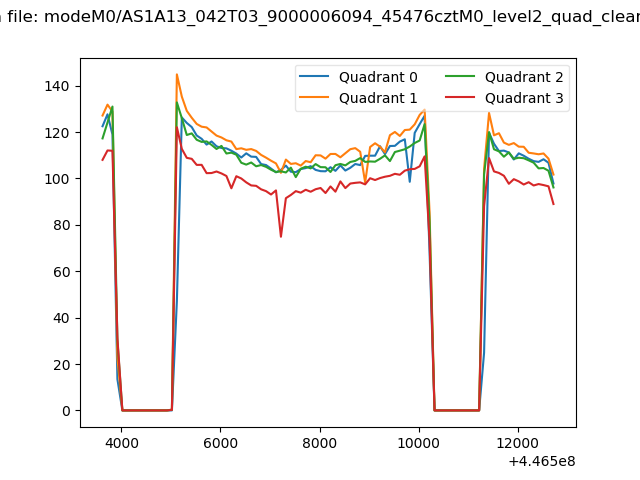 |
|
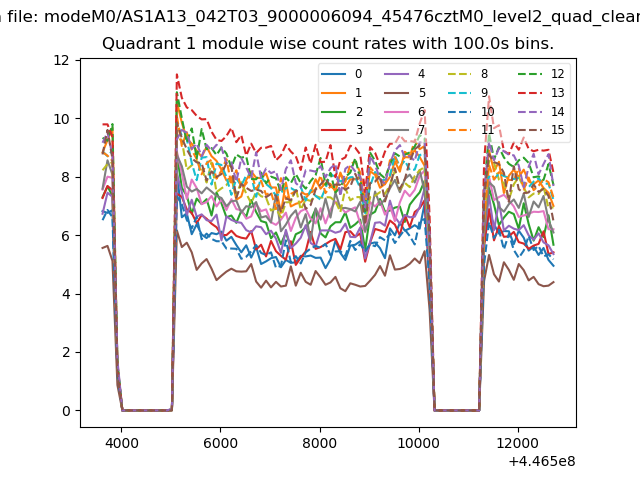
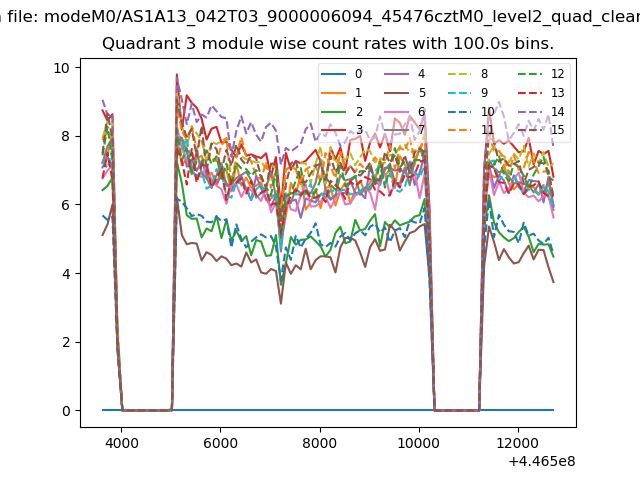
| Module-wise count rates for Quadrant A Data is divided into 100 sec bins |
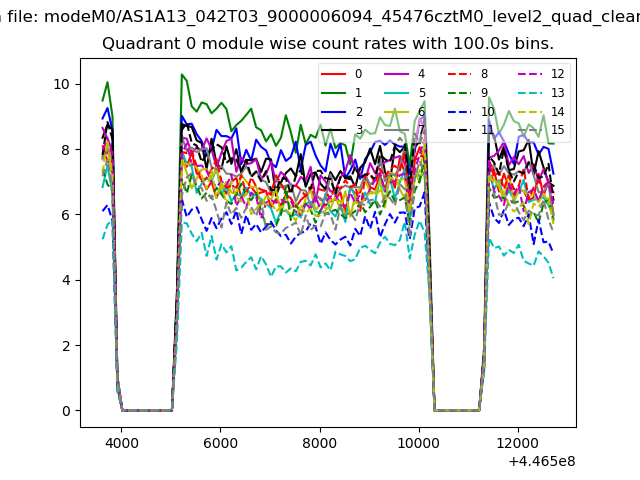 |
 |
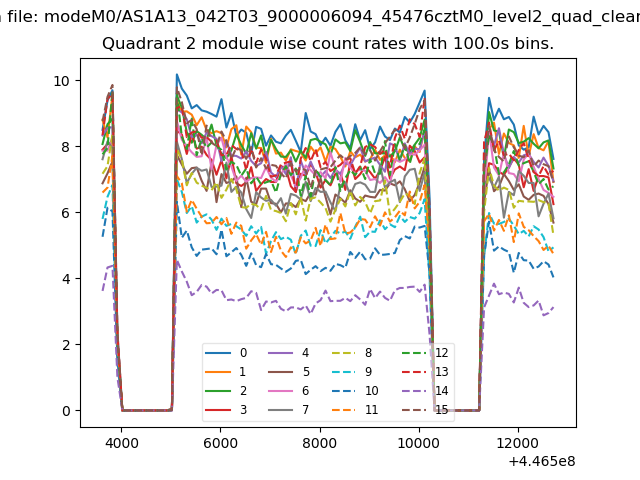
| Module-wise count rates for Quadrant B Data is divided into 100 sec bins |
 |
 |
| Module-wise count rates for Quadrant C Data is divided into 100 sec bins |
 |
 |
| Module-wise count rates for Quadrant D Data is divided into 100 sec bins |
 |
 |
| Parameter | Plot |
|---|---|
| CZT HV Monitor | 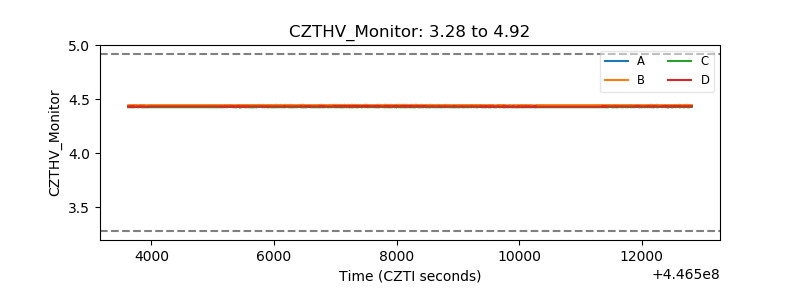 |
| D_VDD | 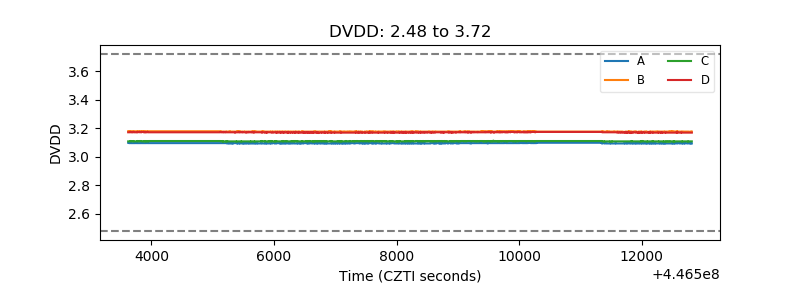 |
| Temperature 1 | 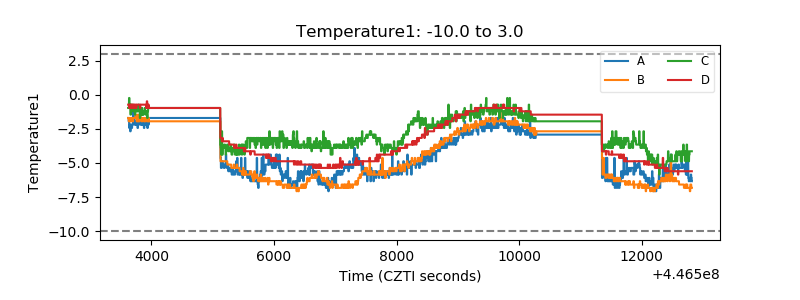 |
| Veto HV Monitor | 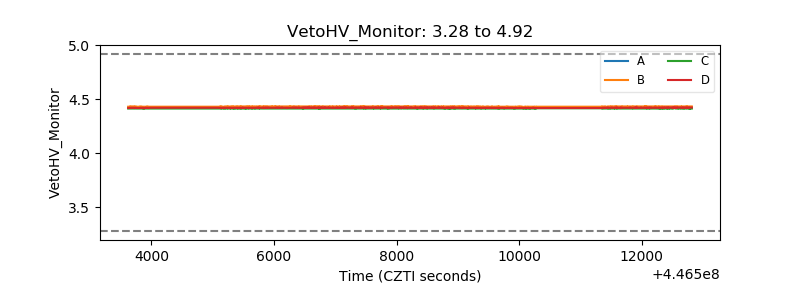 |
| Veto LLD | 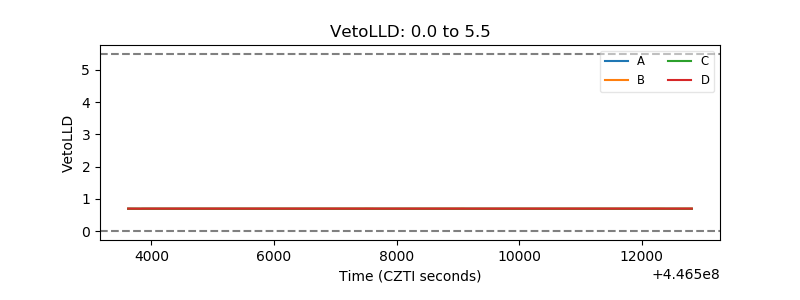 |
| Alpha Counter | 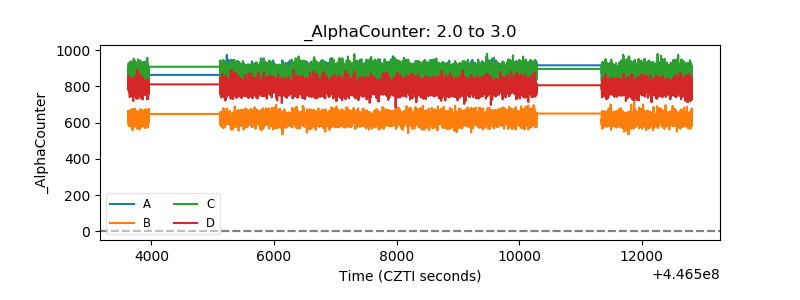 |
| _CPM_Rate | 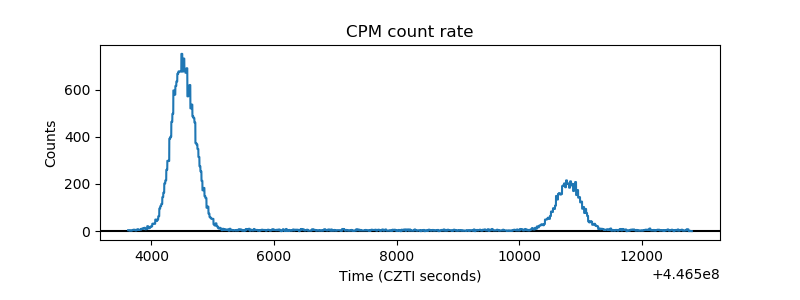 |
| CZT Counter | 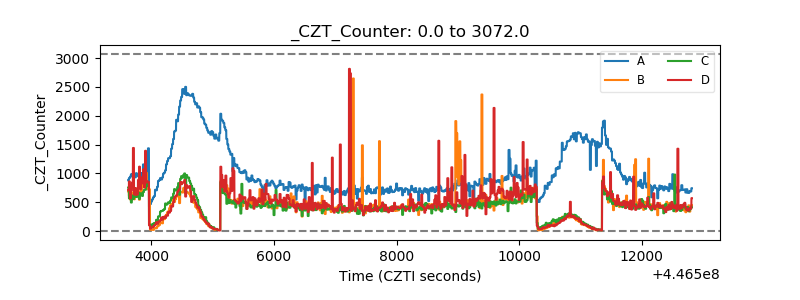 |
| +2.5 Volts monitor | 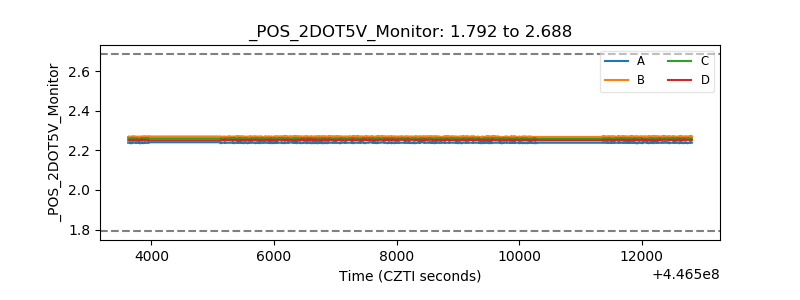 |
| +5 Volts monitor | 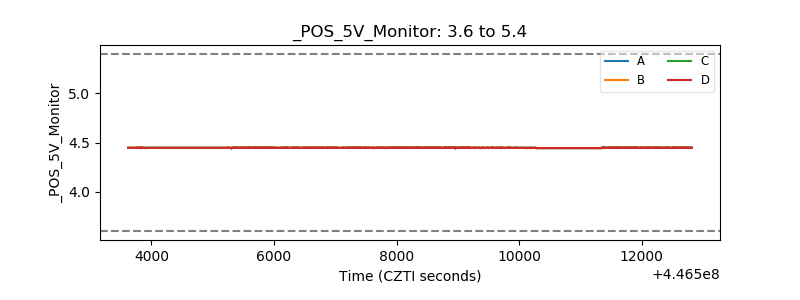 |
| _ROLL_ROT | 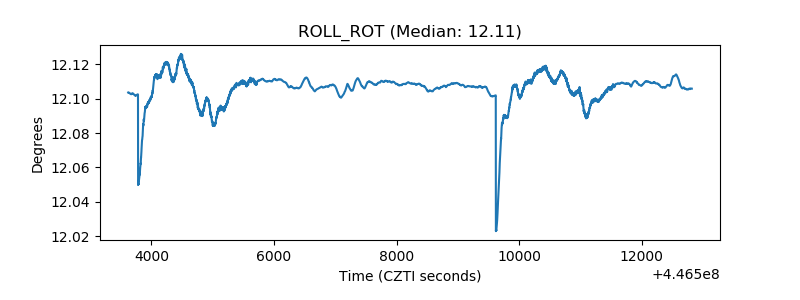 |
| _Roll_DEC | 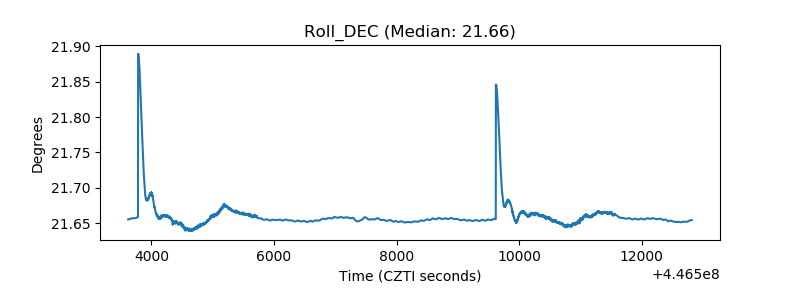 |
| _Roll_RA | 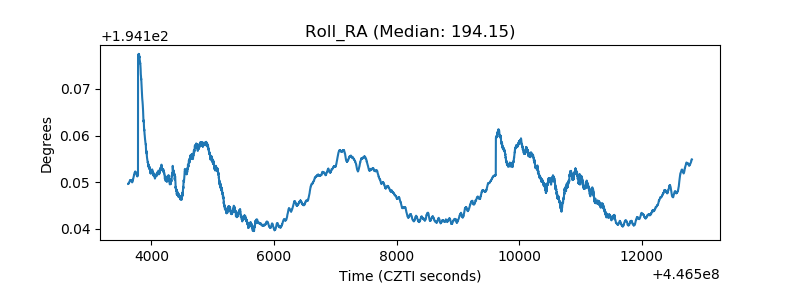 |
| Veto Counter | 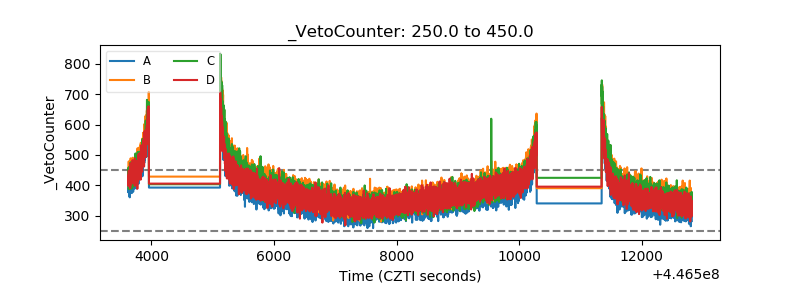 |