| Param | Original file | Final file |
|---|---|---|
| Filename | modeM0/AS1A13_042T03_9000006094_45480cztM0_level2.fits | modeM0/AS1A13_042T03_9000006094_45480cztM0_level2_quad_clean.evt |
| Size (bytes) | 495,475,200 | 114,327,360 |
| Size | 472.5 MB | 109.0 MB |
| Events in quadrant A | 5,658,348 | 755,405 |
| Events in quadrant B | 3,462,515 | 789,278 |
| Events in quadrant C | 3,618,102 | 749,245 |
| Events in quadrant D | 5,031,818 | 656,971 |
| Mode SS | |||
|---|---|---|---|
| Quadrant | BADHDUFLAG | Total packets | Discarded packets |
| A | 0 | 146 | 0 |
| B | 0 | 146 | 0 |
| C | 0 | 146 | 0 |
| D | 0 | 146 | 0 |
| Mode M0 | |||
|---|---|---|---|
| Quadrant | BADHDUFLAG | Total packets | Discarded packets |
| A | 0 | 22302 | 1 |
| B | 0 | 15434 | 0 |
| C | 0 | 16293 | 0 |
| D | 0 | 19975 | 0 |
| Quadrant | Total seconds | Saturated seconds | Saturation percentage |
|---|---|---|---|
| A | 7337 | 196 | 2.671392% |
| B | 7338 | 128 | 1.744345% |
| C | 7338 | 164 | 2.234941% |
| D | 7338 | 453 | 6.173344% |
Noise dominated data is calculated using 1-second bins in cleaned event files. If a bin has >2000 counts, and if more than 50% of those come from <1% of pixels, then it is considered to be noise-dominated and hence unusable.
| Quadrant | # 1 sec bins | Bins with >0 counts | Bins with >2000 counts | High rate bins dominated by noise | Noise dominated (total time) | Noise dominated (detector-on time) | Marked lightcurve |
|---|---|---|---|---|---|---|---|
| A | 7337 | 7337 | 0 | 0 | 0.00% | 0.00% | 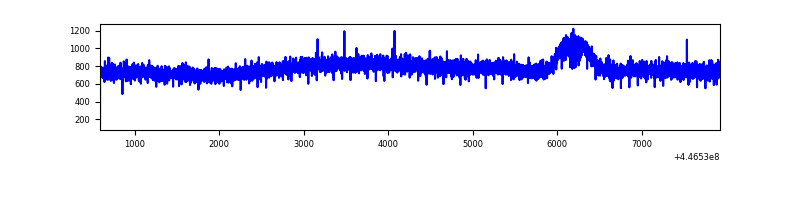 |
| B | 7338 | 7338 | 12 | 12 | 0.16% | 0.16% | 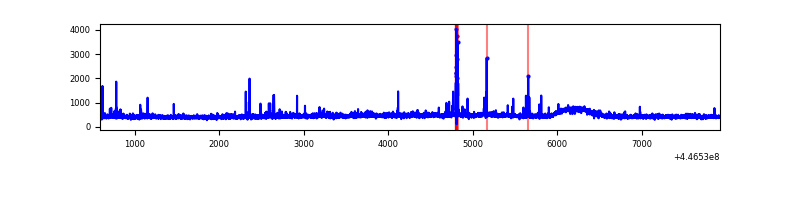 |
| C | 7338 | 7338 | 105 | 105 | 1.43% | 1.43% | 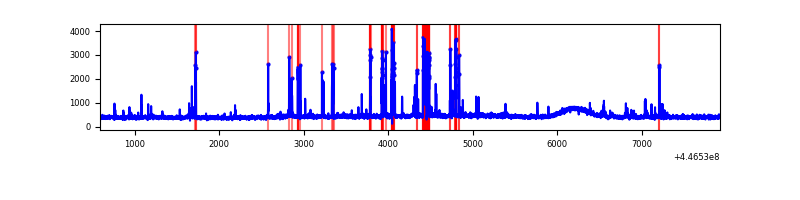 |
| D | 7338 | 7338 | 296 | 296 | 4.03% | 4.03% | 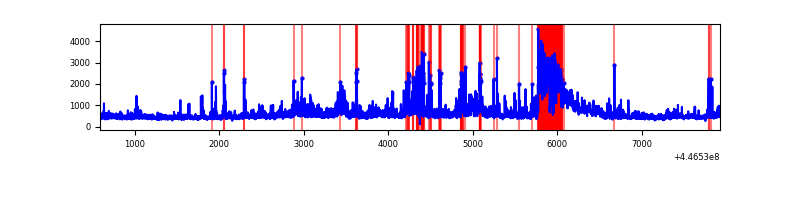 |
Top three noisy pixels from each quadrant. If the there are fewer than three noisy pixels in the level2.evt file, extra rows are filled as -1
| Pixel properties | Quadrant properties | ||||||
|---|---|---|---|---|---|---|---|
| Quadrant | DetID | PixID | Counts | Sigma | Mean | Median | Sigma |
| A | 10 | 83 | 2487419 | 14408.06 | 820 | 800 | 172.6 |
| A | 3 | 137 | 9779 | 52.03 | 820 | 800 | 172.6 |
| A | 13 | 254 | 6625 | 33.75 | 820 | 800 | 172.6 |
| B | 3 | 112 | 74234 | 448.06 | 817 | 793 | 163.9 |
| B | 15 | 85 | 56878 | 342.17 | 817 | 793 | 163.9 |
| B | 5 | 172 | 34956 | 208.43 | 817 | 793 | 163.9 |
| C | 14 | 254 | 311493 | 1647.59 | 797 | 801 | 188.6 |
| C | 3 | 233 | 146044 | 770.22 | 797 | 801 | 188.6 |
| C | 12 | 2 | 35969 | 186.49 | 797 | 801 | 188.6 |
| D | 11 | 224 | 717970 | 3633.39 | 784 | 759 | 197.4 |
| D | 11 | 241 | 625505 | 3164.96 | 784 | 759 | 197.4 |
| D | 1 | 52 | 522797 | 2644.64 | 784 | 759 | 197.4 |
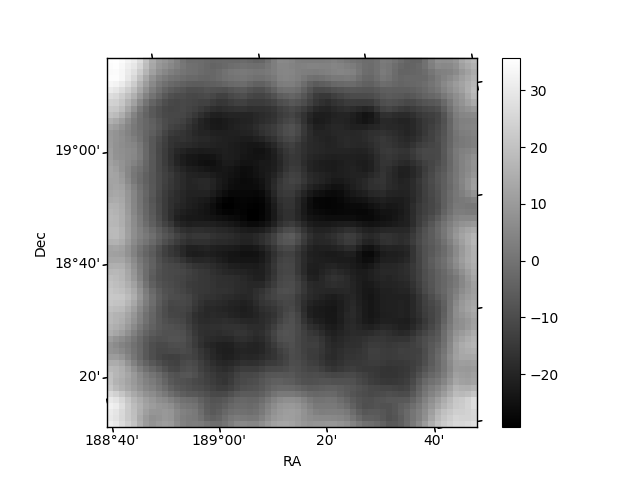
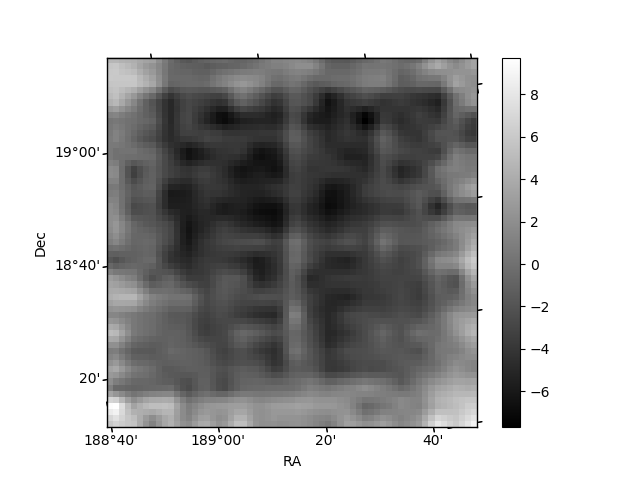
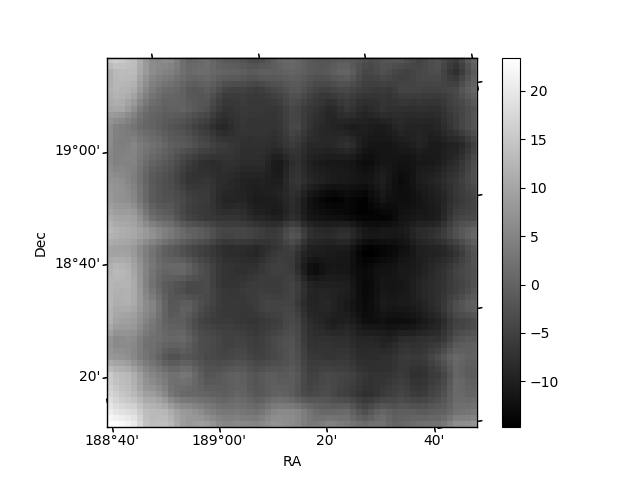
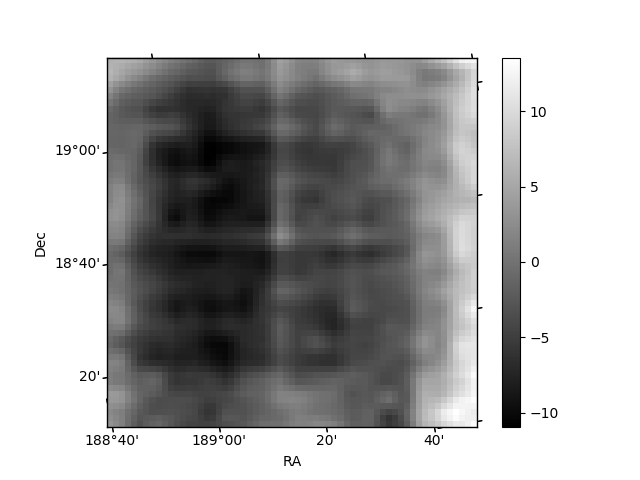
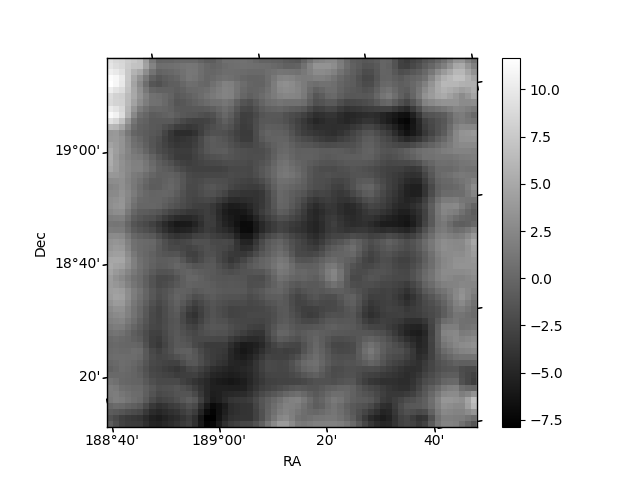
Histogram calculated using DETX and DETY for each event in the final _common_clean file
| Quadrant A | 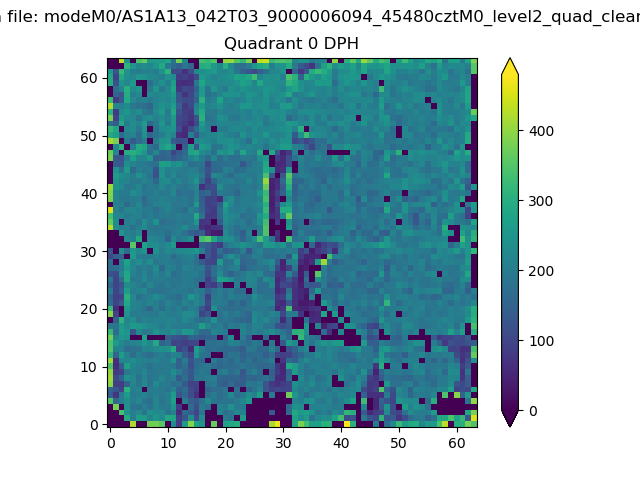 |
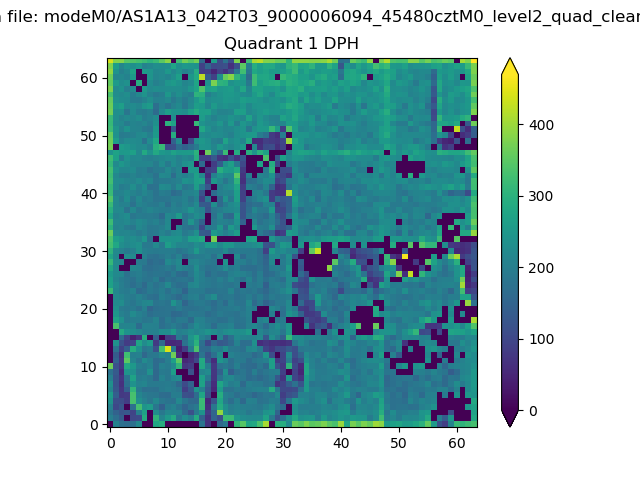 |
Quadrant B |
|---|---|---|---|
| Quadrant D | 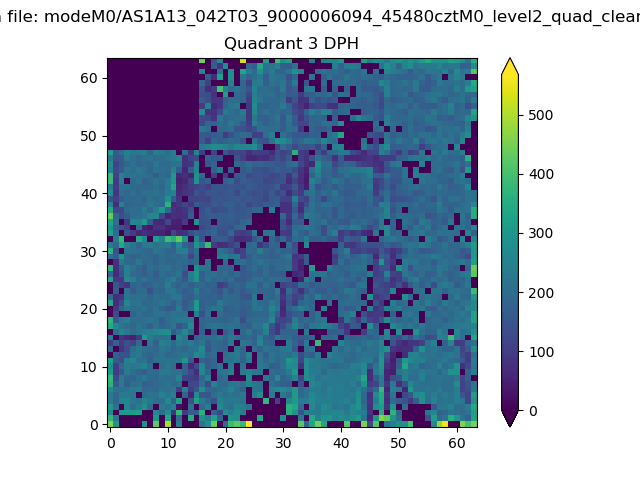 |
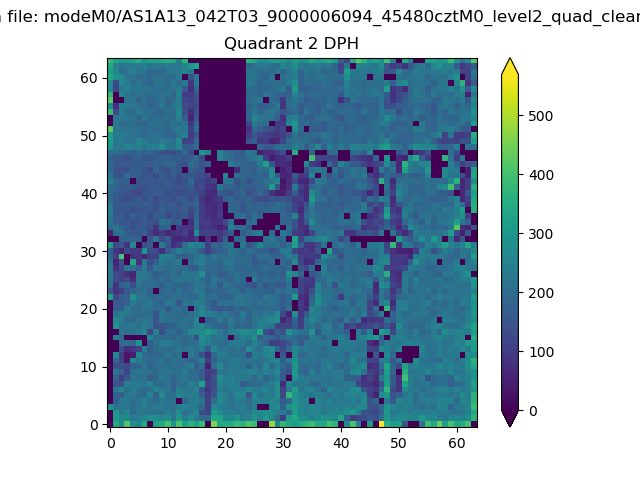 |
Quadrant C |
| Plot type | Count rate plots | Images |
|---|---|---|
| Comparison with Poisson distribution Blue bars denote a histogram of data divided into 1 sec bins. Red curve is a Poisson curve with rate = median count rate of data. |
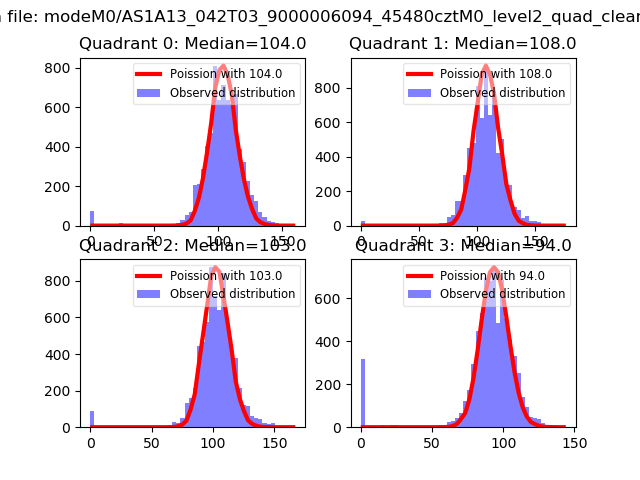 |
 |
| Quadrant-wise count rates Data is divided into 100 sec bins |
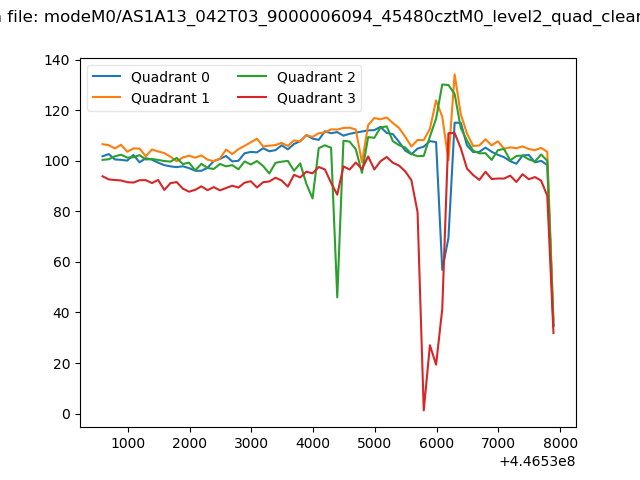 |
|
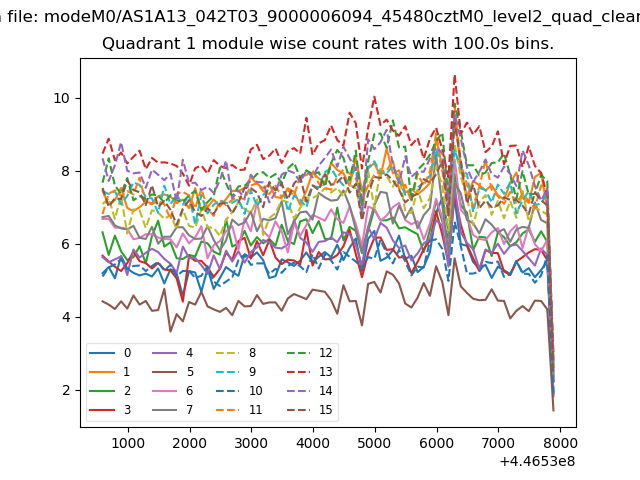
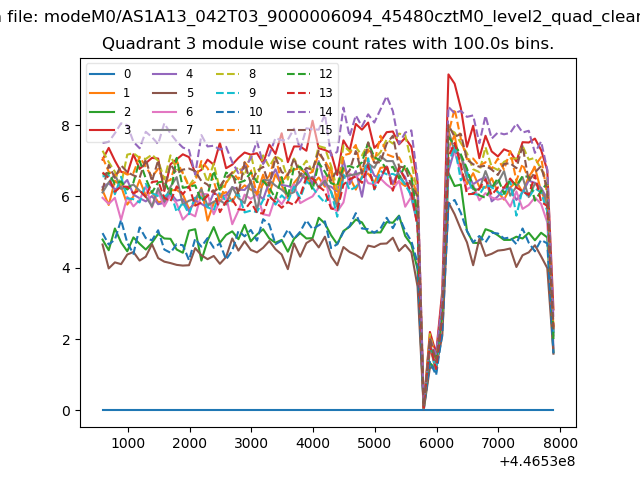
| Module-wise count rates for Quadrant A Data is divided into 100 sec bins |
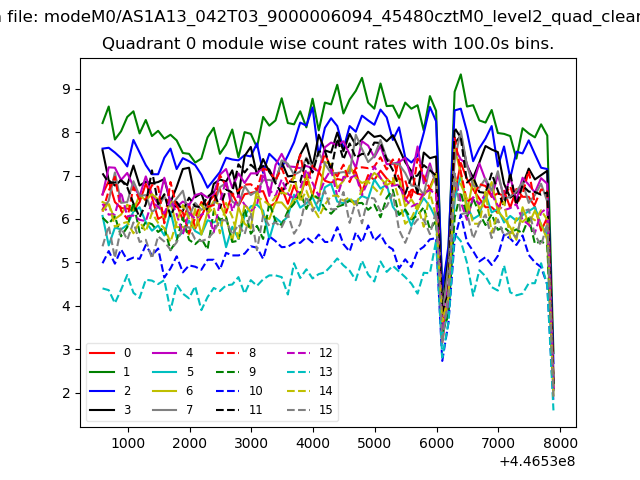 |
 |
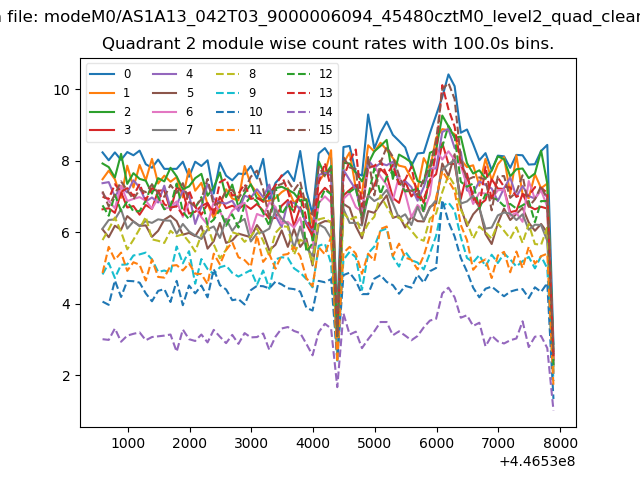
| Module-wise count rates for Quadrant B Data is divided into 100 sec bins |
 |
 |
| Module-wise count rates for Quadrant C Data is divided into 100 sec bins |
 |
 |
| Module-wise count rates for Quadrant D Data is divided into 100 sec bins |
 |
 |
| Parameter | Plot |
|---|---|
| CZT HV Monitor | 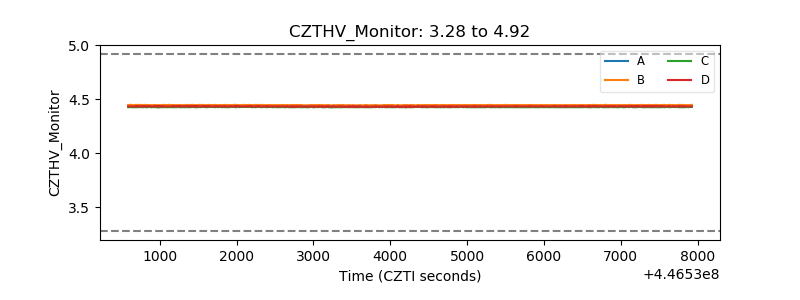 |
| D_VDD | 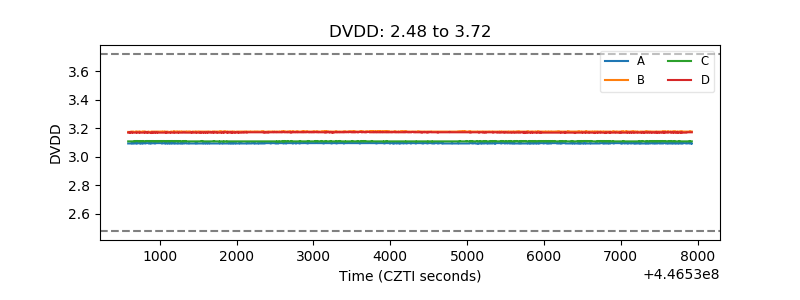 |
| Temperature 1 | 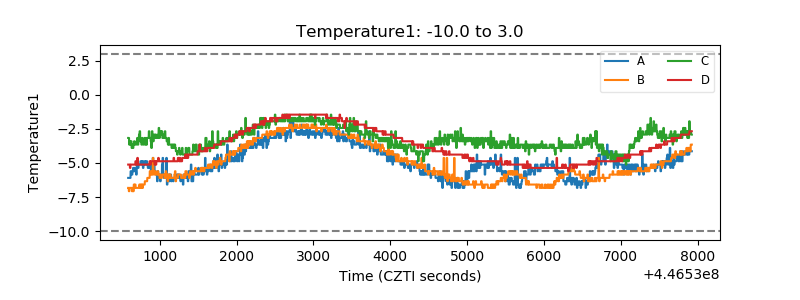 |
| Veto HV Monitor | 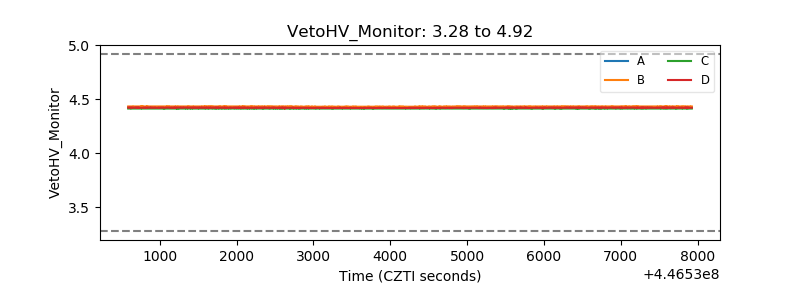 |
| Veto LLD | 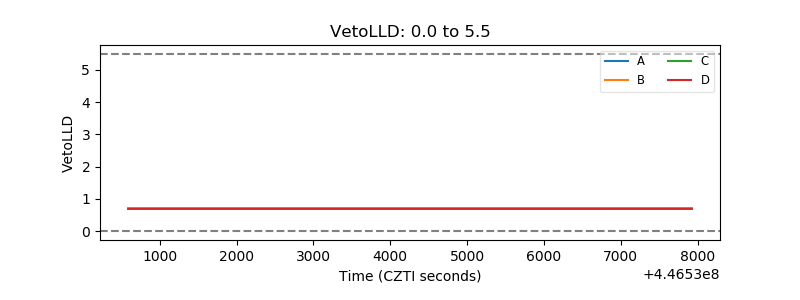 |
| Alpha Counter | 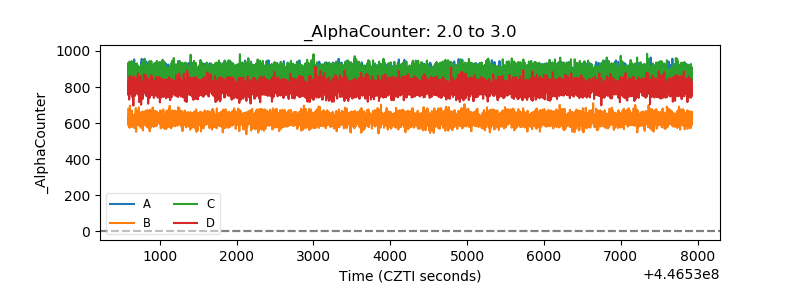 |
| _CPM_Rate | 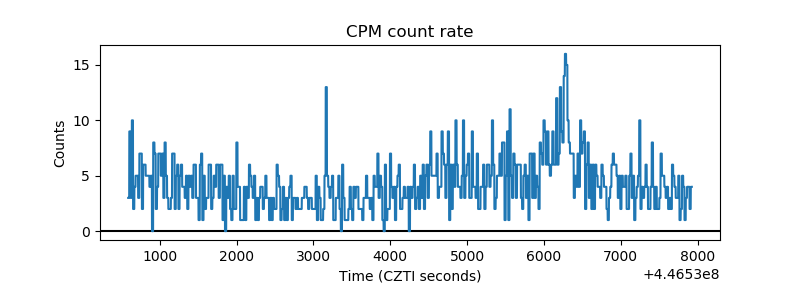 |
| CZT Counter | 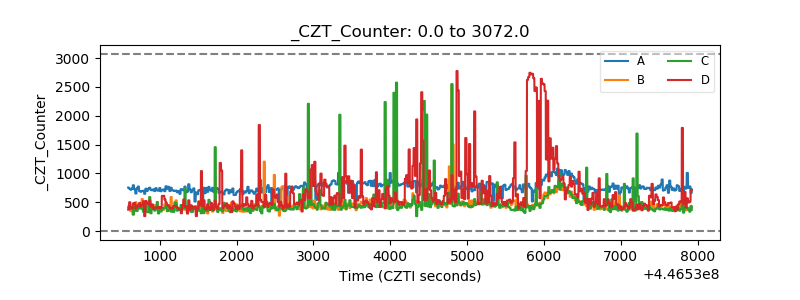 |
| +2.5 Volts monitor | 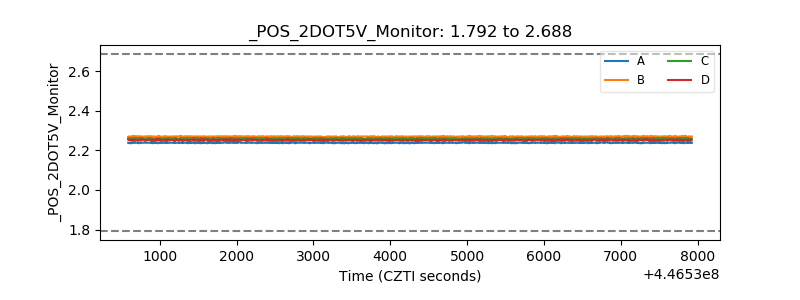 |
| +5 Volts monitor | 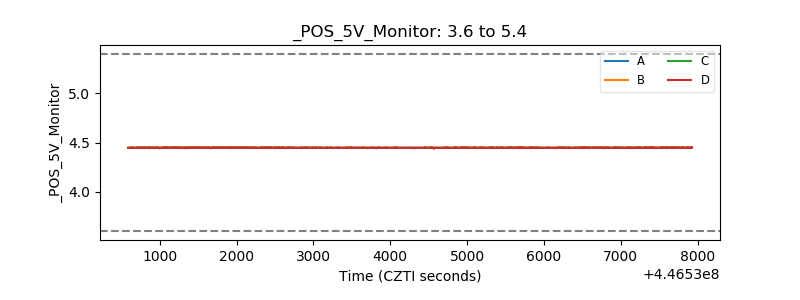 |
| _ROLL_ROT | 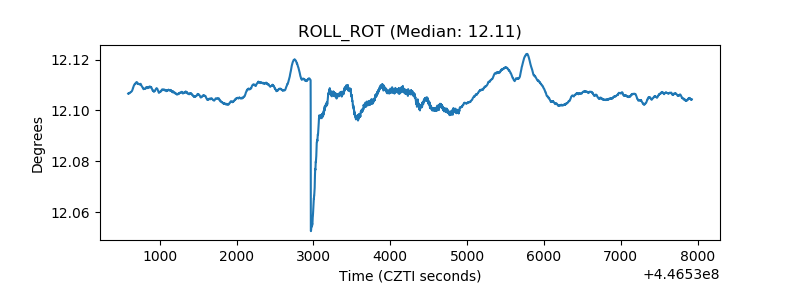 |
| _Roll_DEC | 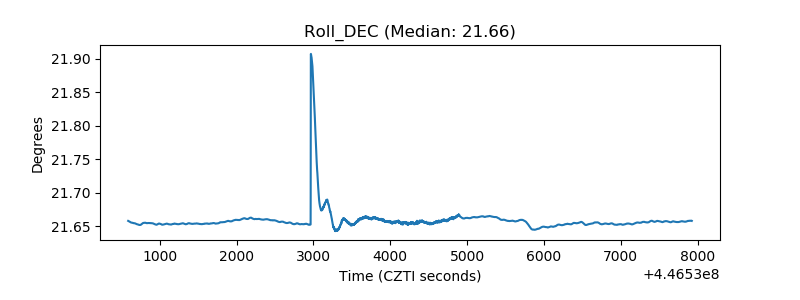 |
| _Roll_RA | 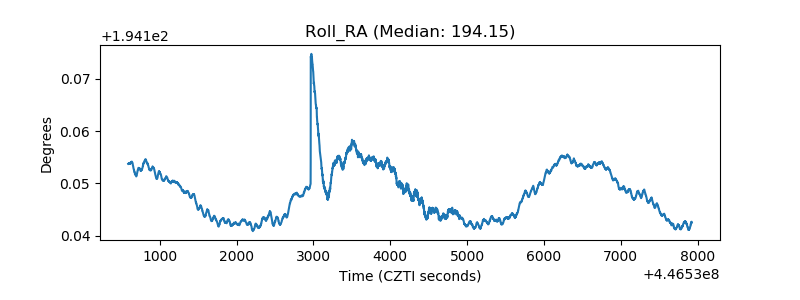 |
| Veto Counter | 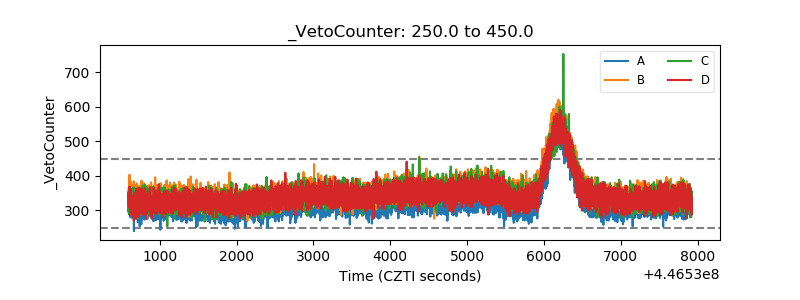 |