| Param | Original file | Final file |
|---|---|---|
| Filename | modeM0/AS1A13_042T03_9000006094_45487cztM0_level2.fits | modeM0/AS1A13_042T03_9000006094_45487cztM0_level2_quad_clean.evt |
| Size (bytes) | 943,349,760 | 228,585,600 |
| Size | 899.6 MB | 218.0 MB |
| Events in quadrant A | 11,378,641 | 1,506,693 |
| Events in quadrant B | 6,964,615 | 1,562,179 |
| Events in quadrant C | 6,767,193 | 1,494,694 |
| Events in quadrant D | 8,693,621 | 1,362,060 |
| Mode SS | |||
|---|---|---|---|
| Quadrant | BADHDUFLAG | Total packets | Discarded packets |
| A | 0 | 288 | 0 |
| B | 0 | 288 | 0 |
| C | 0 | 288 | 0 |
| D | 0 | 288 | 0 |
| Mode M0 | |||
|---|---|---|---|
| Quadrant | BADHDUFLAG | Total packets | Discarded packets |
| A | 0 | 44115 | 0 |
| B | 0 | 30712 | 1 |
| C | 0 | 30988 | 0 |
| D | 0 | 36404 | 0 |
| Quadrant | Total seconds | Saturated seconds | Saturation percentage |
|---|---|---|---|
| A | 14419 | 205 | 1.421735% |
| B | 14418 | 185 | 1.283118% |
| C | 14419 | 171 | 1.185935% |
| D | 14419 | 161 | 1.116582% |
Noise dominated data is calculated using 1-second bins in cleaned event files. If a bin has >2000 counts, and if more than 50% of those come from <1% of pixels, then it is considered to be noise-dominated and hence unusable.
| Quadrant | # 1 sec bins | Bins with >0 counts | Bins with >2000 counts | High rate bins dominated by noise | Noise dominated (total time) | Noise dominated (detector-on time) | Marked lightcurve |
|---|---|---|---|---|---|---|---|
| A | 14419 | 14419 | 5 | 5 | 0.03% | 0.03% | 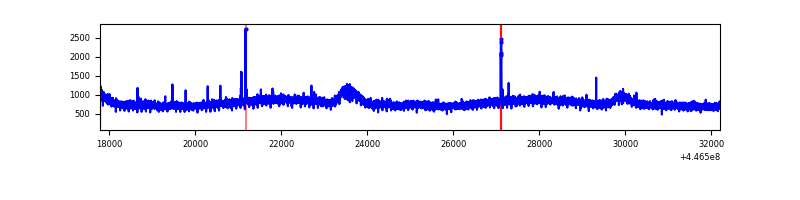 |
| B | 14418 | 14418 | 11 | 11 | 0.08% | 0.08% | 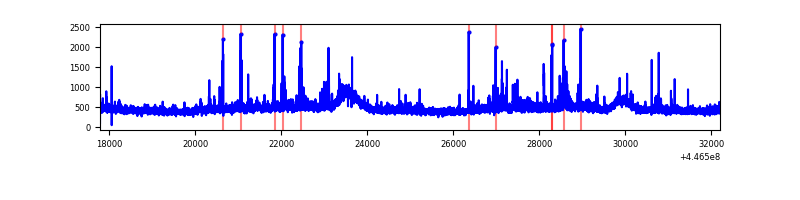 |
| C | 14419 | 14419 | 130 | 130 | 0.90% | 0.90% | 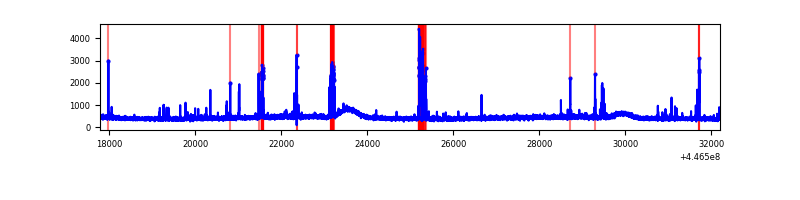 |
| D | 14419 | 14419 | 92 | 92 | 0.64% | 0.64% | 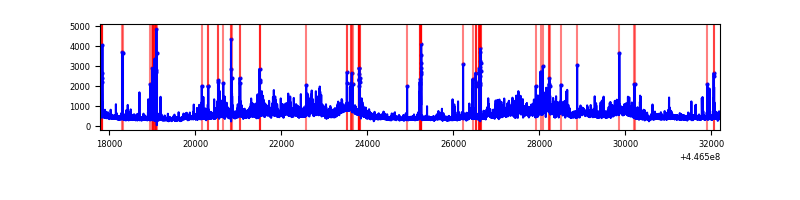 |
Top three noisy pixels from each quadrant. If the there are fewer than three noisy pixels in the level2.evt file, extra rows are filled as -1
| Pixel properties | Quadrant properties | ||||||
|---|---|---|---|---|---|---|---|
| Quadrant | DetID | PixID | Counts | Sigma | Mean | Median | Sigma |
| A | 10 | 83 | 5096874 | 14935.88 | 1619 | 1580 | 341.1 |
| A | 13 | 248 | 31660 | 88.17 | 1619 | 1580 | 341.1 |
| A | 3 | 137 | 19693 | 53.09 | 1619 | 1580 | 341.1 |
| B | 3 | 112 | 199757 | 617.49 | 1619 | 1571 | 321.0 |
| B | 5 | 172 | 71540 | 218.0 | 1619 | 1571 | 321.0 |
| B | 0 | 183 | 64412 | 195.79 | 1619 | 1571 | 321.0 |
| C | 3 | 233 | 348883 | 931.86 | 1581 | 1587 | 372.7 |
| C | 14 | 254 | 129549 | 343.35 | 1581 | 1587 | 372.7 |
| C | 12 | 2 | 89020 | 234.6 | 1581 | 1587 | 372.7 |
| D | 11 | 241 | 1596407 | 3971.62 | 1580 | 1526 | 401.6 |
| D | 1 | 52 | 396034 | 982.41 | 1580 | 1526 | 401.6 |
| D | 13 | 249 | 314077 | 778.32 | 1580 | 1526 | 401.6 |
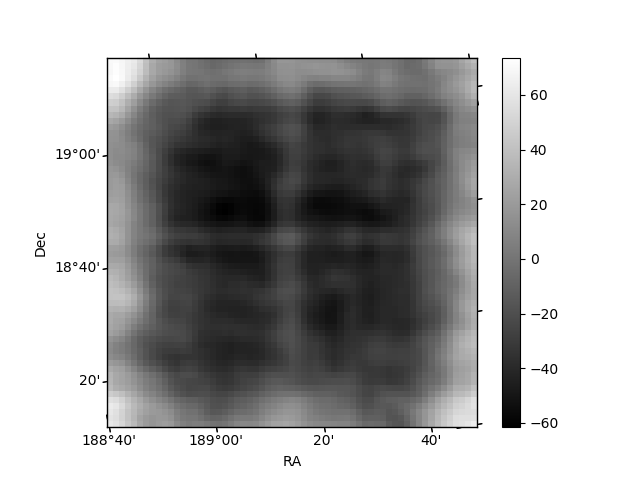
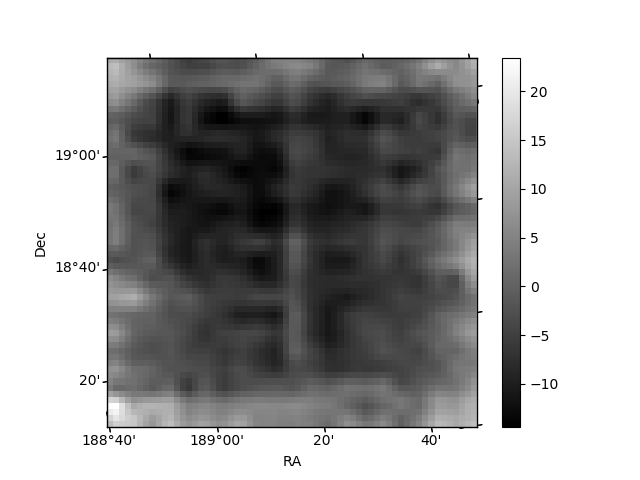
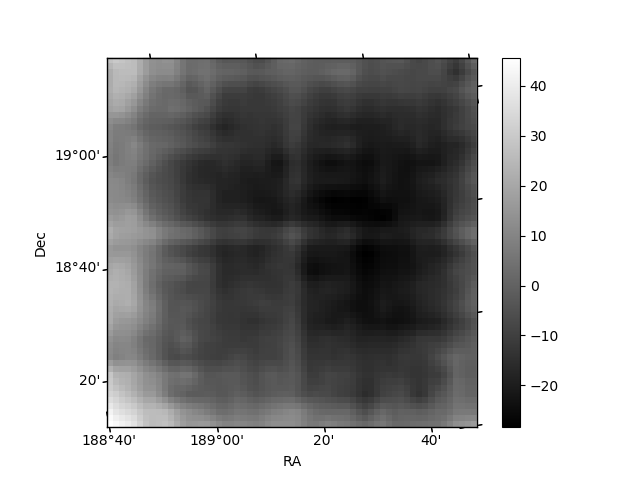
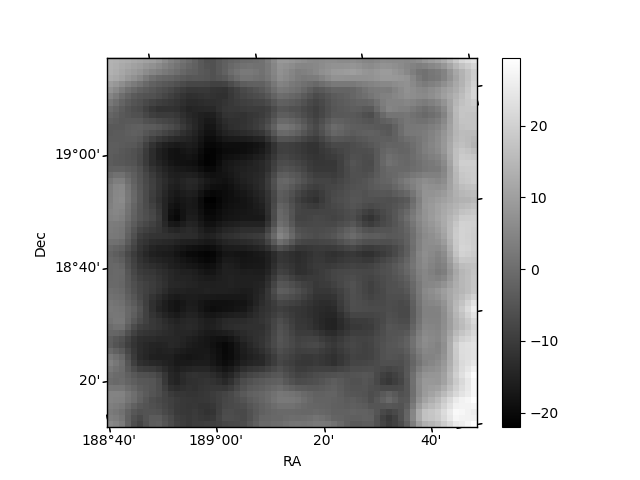
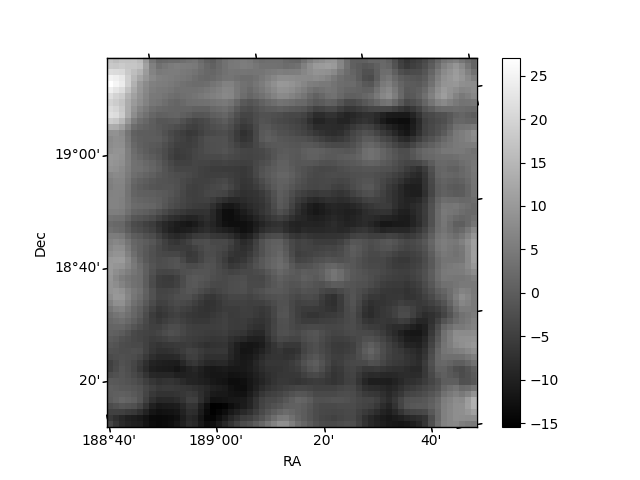
Histogram calculated using DETX and DETY for each event in the final _common_clean file
| Quadrant A | 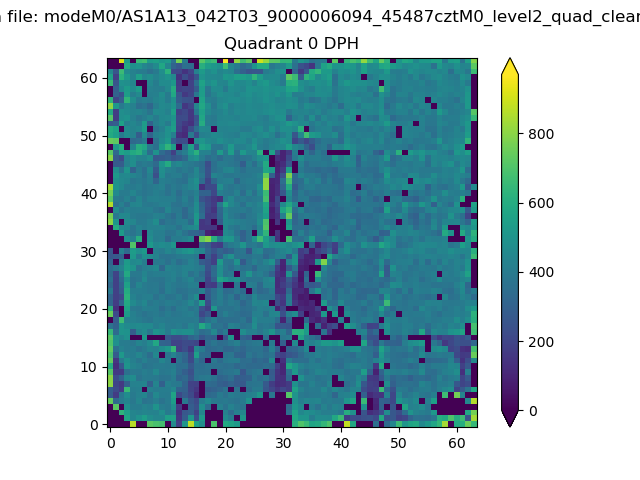 |
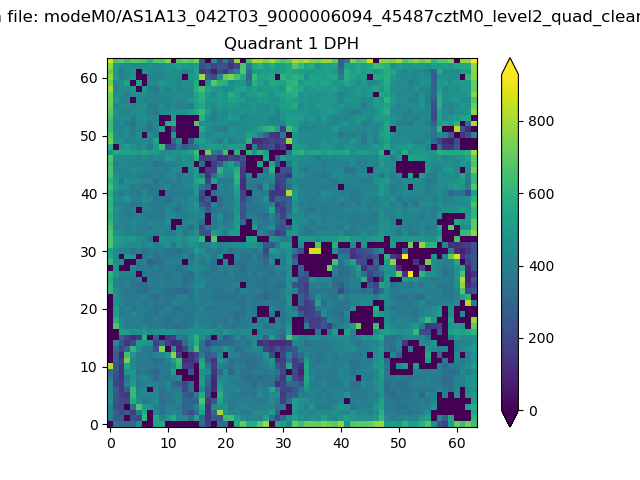 |
Quadrant B |
|---|---|---|---|
| Quadrant D | 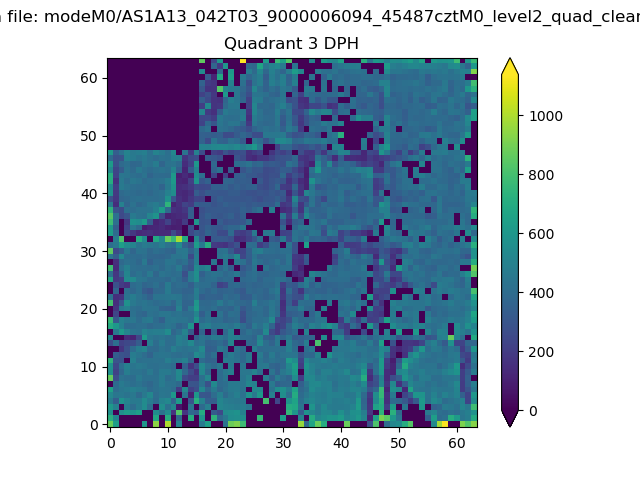 |
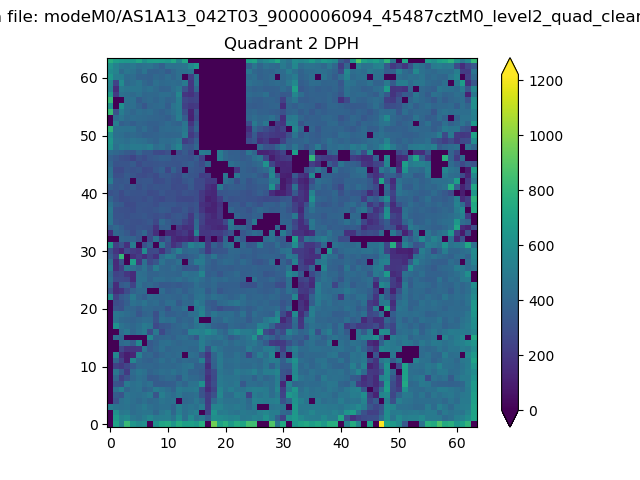 |
Quadrant C |
| Plot type | Count rate plots | Images |
|---|---|---|
| Comparison with Poisson distribution Blue bars denote a histogram of data divided into 1 sec bins. Red curve is a Poisson curve with rate = median count rate of data. |
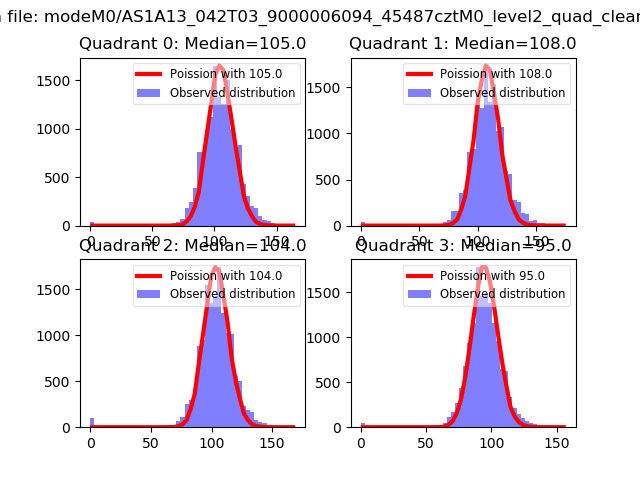 |
 |
| Quadrant-wise count rates Data is divided into 100 sec bins |
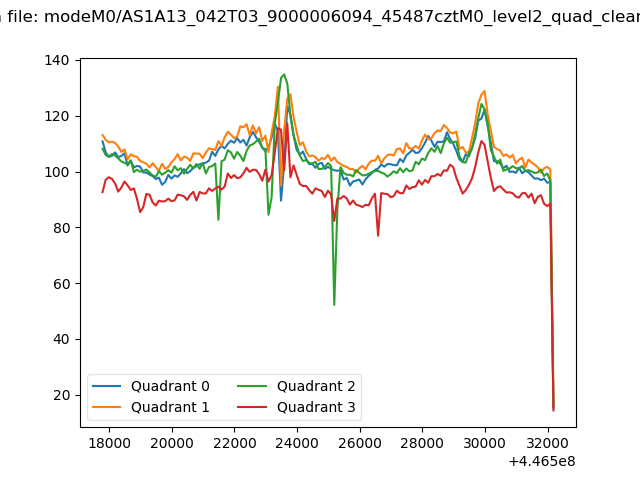 |
|
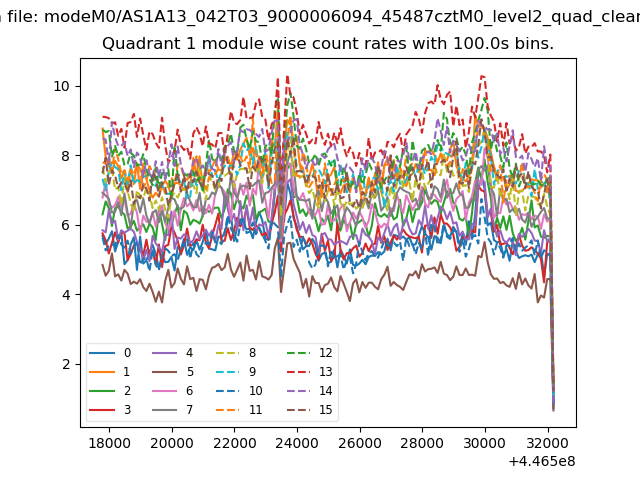
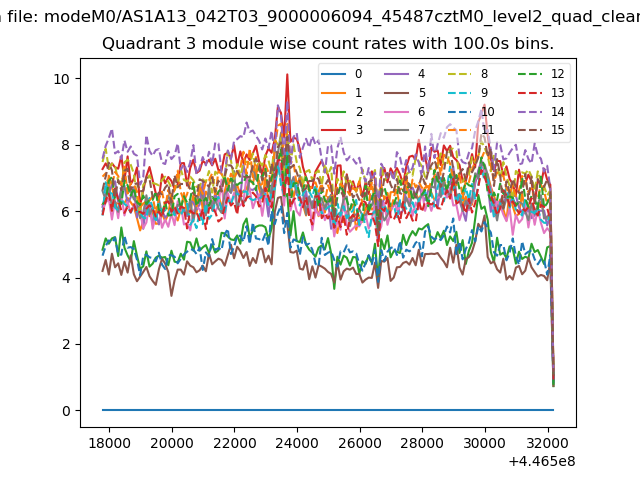
| Module-wise count rates for Quadrant A Data is divided into 100 sec bins |
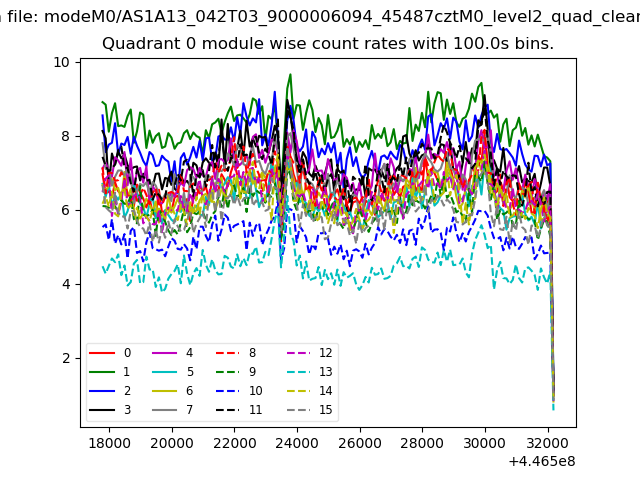 |
 |
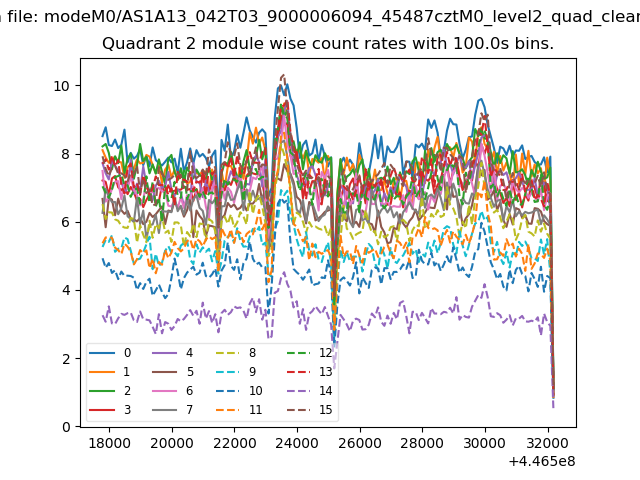
| Module-wise count rates for Quadrant B Data is divided into 100 sec bins |
 |
 |
| Module-wise count rates for Quadrant C Data is divided into 100 sec bins |
 |
 |
| Module-wise count rates for Quadrant D Data is divided into 100 sec bins |
 |
 |
| Parameter | Plot |
|---|---|
| CZT HV Monitor | 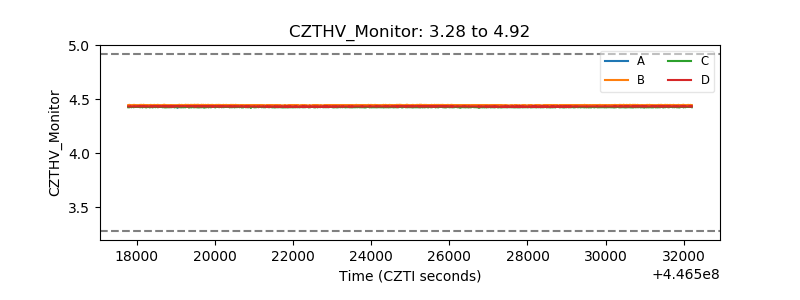 |
| D_VDD | 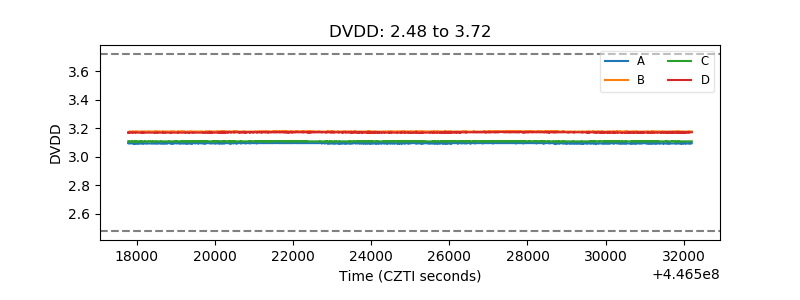 |
| Temperature 1 | 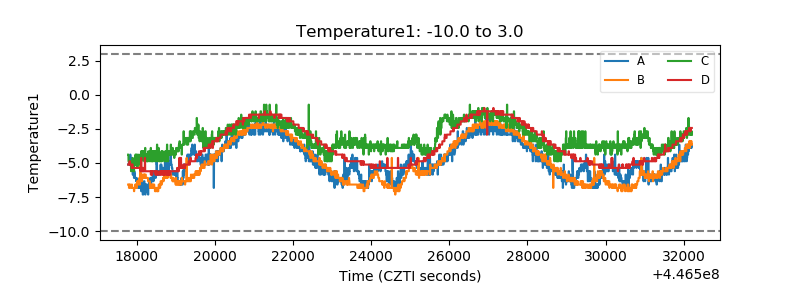 |
| Veto HV Monitor | 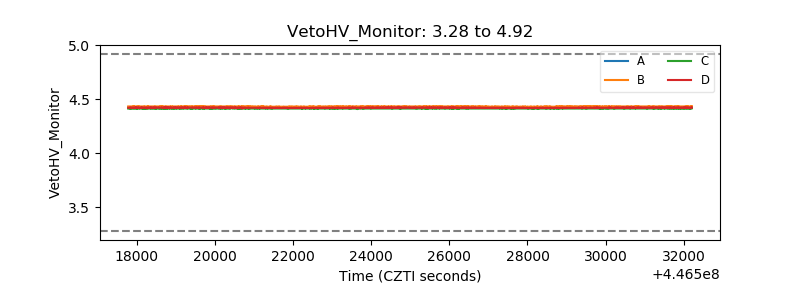 |
| Veto LLD | 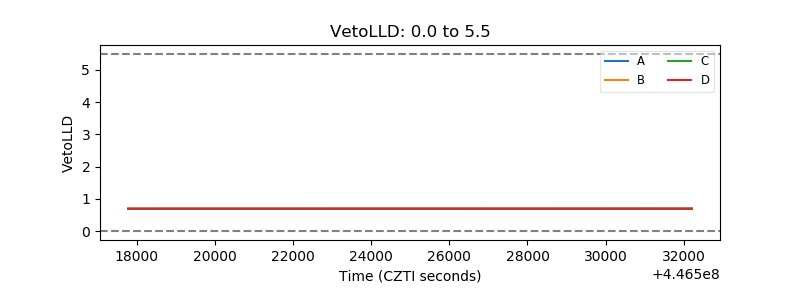 |
| Alpha Counter | 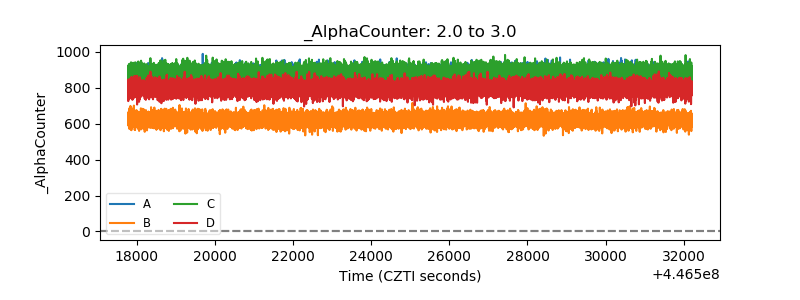 |
| _CPM_Rate | 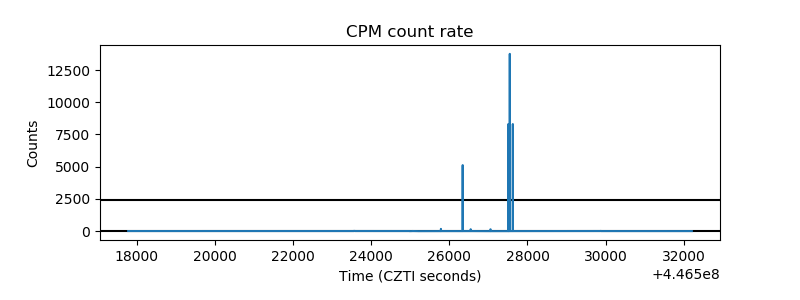 |
| CZT Counter | 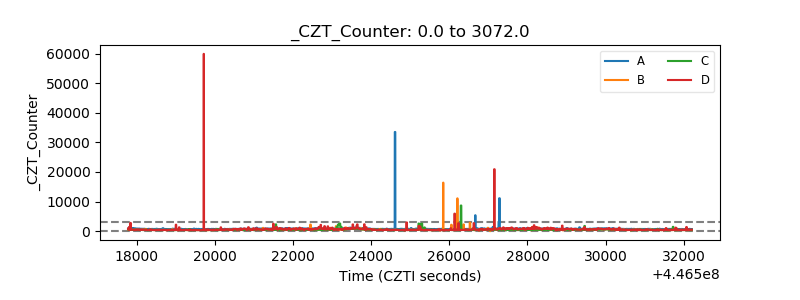 |
| +2.5 Volts monitor | 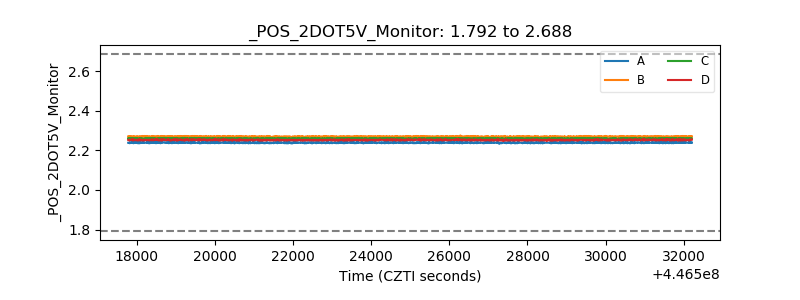 |
| +5 Volts monitor | 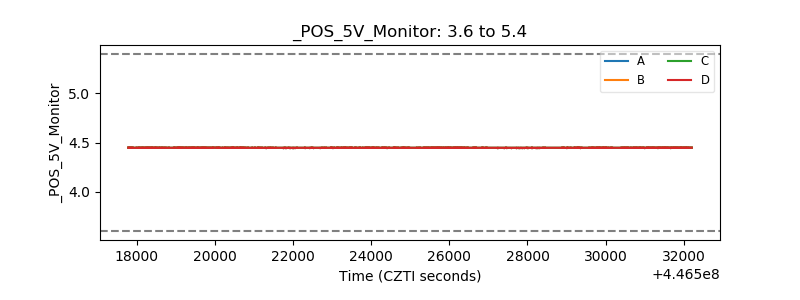 |
| _ROLL_ROT | 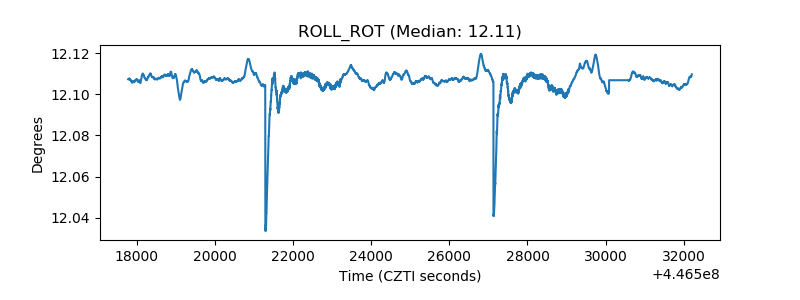 |
| _Roll_DEC | 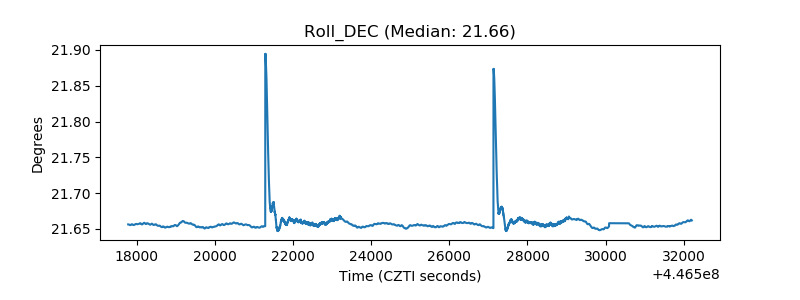 |
| _Roll_RA | 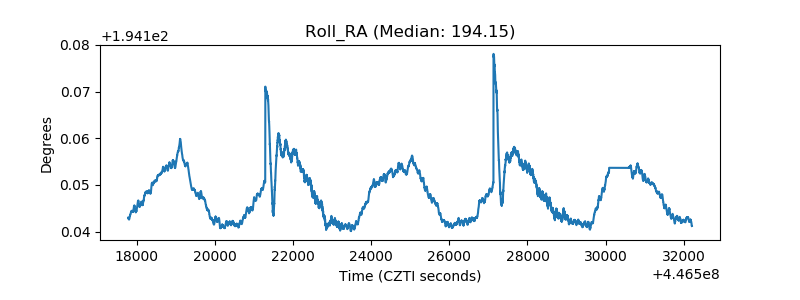 |
| Veto Counter | 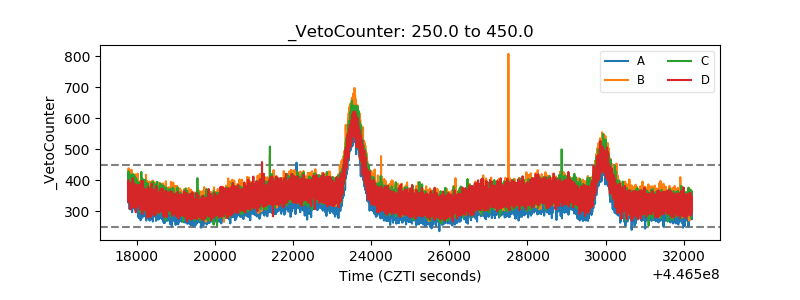 |