| Param | Original file | Final file |
|---|---|---|
| Filename | modeM0/AS1C02_002T01_9000006092_45471cztM0_level2.fits | modeM0/AS1C02_002T01_9000006092_45471cztM0_level2_quad_clean.evt |
| Size (bytes) | 451,555,200 | 106,738,560 |
| Size | 430.6 MB | 101.8 MB |
| Events in quadrant A | 5,829,791 | 704,948 |
| Events in quadrant B | 3,328,081 | 724,042 |
| Events in quadrant C | 2,911,601 | 703,096 |
| Events in quadrant D | 4,136,511 | 642,039 |
| Mode M0 | |||
|---|---|---|---|
| Quadrant | BADHDUFLAG | Total packets | Discarded packets |
| A | 0 | 21457 | 1 |
| B | 0 | 14412 | 1 |
| C | 0 | 13502 | 1 |
| D | 0 | 16645 | 1 |
| Mode M9 | |||
|---|---|---|---|
| Quadrant | BADHDUFLAG | Total packets | Discarded packets |
| A | 0 | 9 | 0 |
| B | 0 | 9 | 0 |
| C | 0 | 9 | 0 |
| D | 0 | 9 | 0 |
| Mode SS | |||
|---|---|---|---|
| Quadrant | BADHDUFLAG | Total packets | Discarded packets |
| A | 0 | 136 | 0 |
| B | 0 | 136 | 0 |
| C | 0 | 136 | 0 |
| D | 0 | 136 | 0 |
| Quadrant | Total seconds | Saturated seconds | Saturation percentage |
|---|---|---|---|
| A | 6556 | 183 | 2.791336% |
| B | 6556 | 118 | 1.799878% |
| C | 6556 | 27 | 0.411836% |
| D | 6556 | 119 | 1.815131% |
Noise dominated data is calculated using 1-second bins in cleaned event files. If a bin has >2000 counts, and if more than 50% of those come from <1% of pixels, then it is considered to be noise-dominated and hence unusable.
| Quadrant | # 1 sec bins | Bins with >0 counts | Bins with >2000 counts | High rate bins dominated by noise | Noise dominated (total time) | Noise dominated (detector-on time) | Marked lightcurve |
|---|---|---|---|---|---|---|---|
| A | 7536 | 6557 | 46 | 46 | 0.61% | 0.70% | 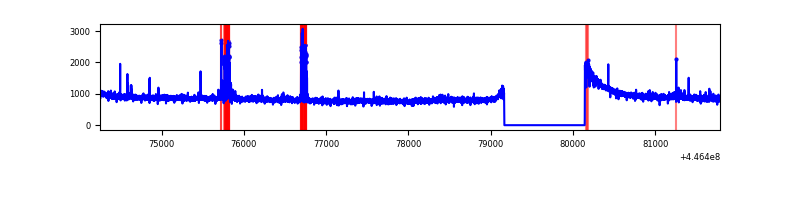 |
| B | 7536 | 6557 | 47 | 47 | 0.62% | 0.72% | 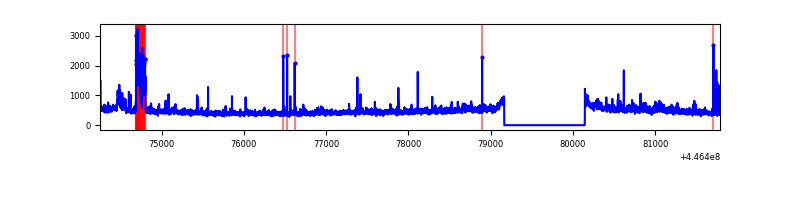 |
| C | 7536 | 6557 | 9 | 9 | 0.12% | 0.14% | 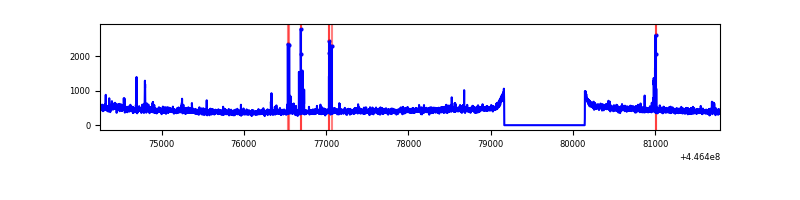 |
| D | 7536 | 6557 | 83 | 83 | 1.10% | 1.27% | 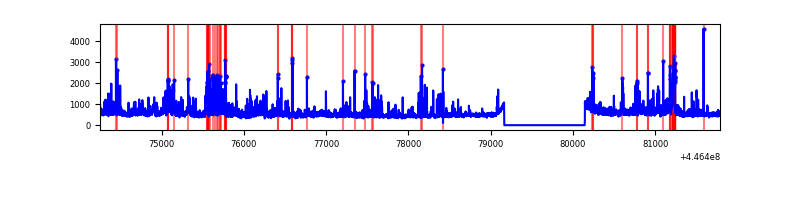 |
Top three noisy pixels from each quadrant. If the there are fewer than three noisy pixels in the level2.evt file, extra rows are filled as -1
| Pixel properties | Quadrant properties | ||||||
|---|---|---|---|---|---|---|---|
| Quadrant | DetID | PixID | Counts | Sigma | Mean | Median | Sigma |
| A | 10 | 83 | 2736579 | 18009.61 | 733 | 718 | 151.9 |
| A | 13 | 248 | 164588 | 1078.72 | 733 | 718 | 151.9 |
| A | 13 | 210 | 84711 | 552.91 | 733 | 718 | 151.9 |
| B | 15 | 201 | 290584 | 2013.59 | 730 | 709 | 144.0 |
| B | 3 | 112 | 50772 | 347.76 | 730 | 709 | 144.0 |
| B | 12 | 111 | 17998 | 120.1 | 730 | 709 | 144.0 |
| C | 14 | 254 | 41138 | 237.95 | 720 | 723 | 169.8 |
| C | 1 | 3 | 33599 | 193.56 | 720 | 723 | 169.8 |
| C | 3 | 233 | 21048 | 119.67 | 720 | 723 | 169.8 |
| D | 11 | 241 | 410262 | 2239.56 | 719 | 697 | 182.9 |
| D | 1 | 52 | 351474 | 1918.1 | 719 | 697 | 182.9 |
| D | 2 | 249 | 249699 | 1361.58 | 719 | 697 | 182.9 |
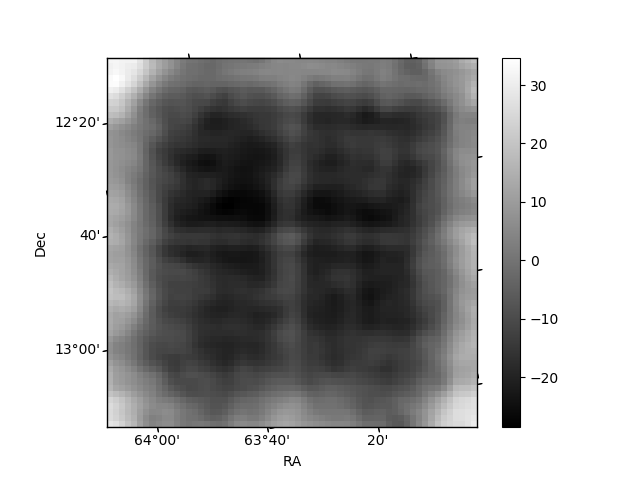
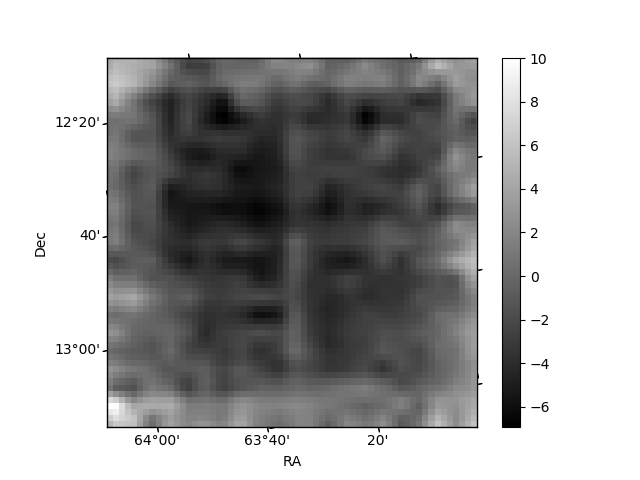
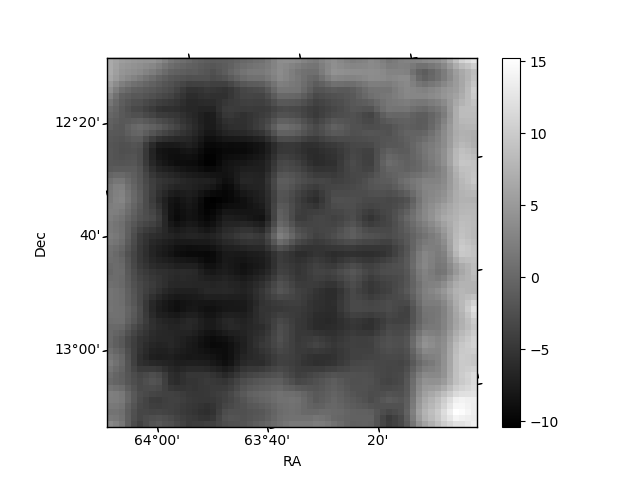
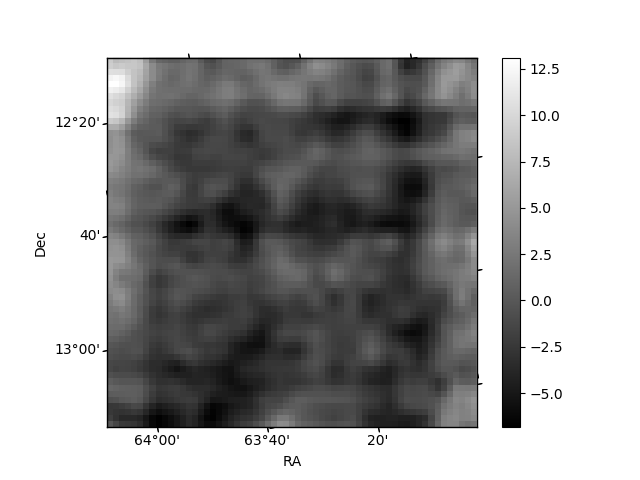
Histogram calculated using DETX and DETY for each event in the final _common_clean file
| Quadrant A | 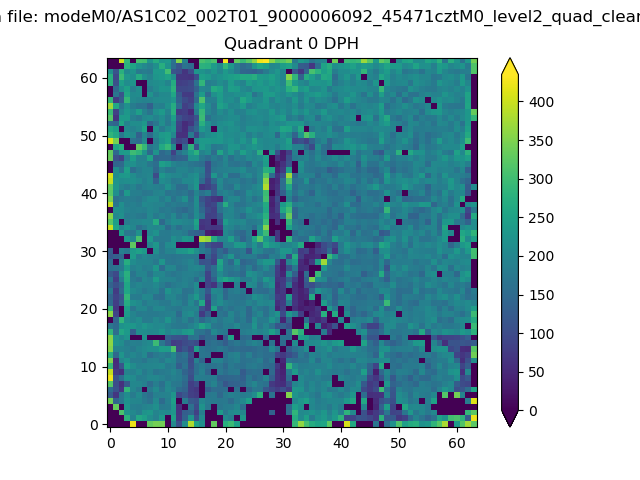 |
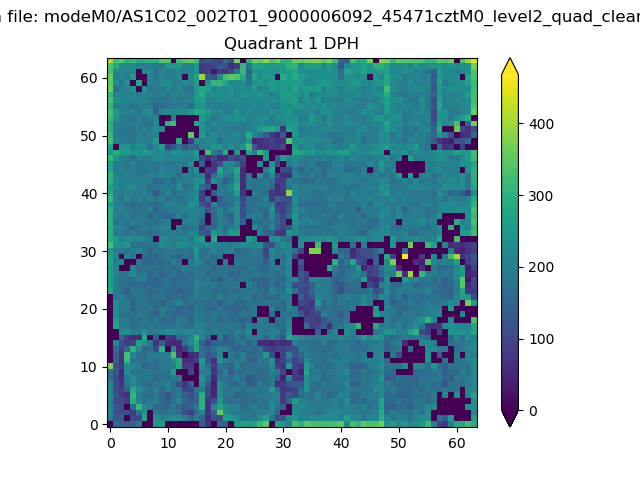 |
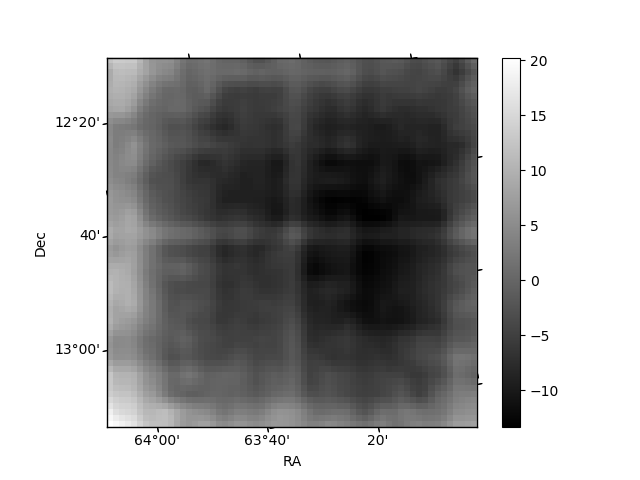
Quadrant B |
|---|---|---|---|
| Quadrant D | 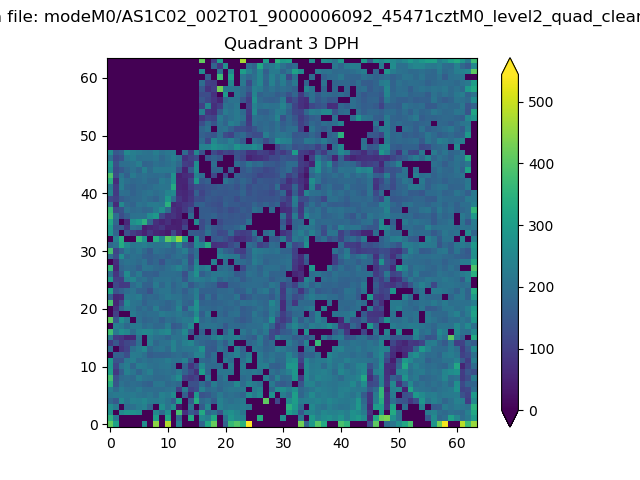 |
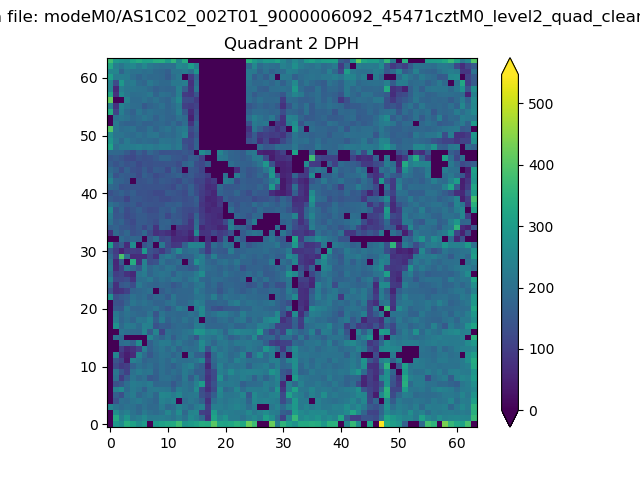 |
Quadrant C |
| Plot type | Count rate plots | Images |
|---|---|---|
| Comparison with Poisson distribution Blue bars denote a histogram of data divided into 1 sec bins. Red curve is a Poisson curve with rate = median count rate of data. |
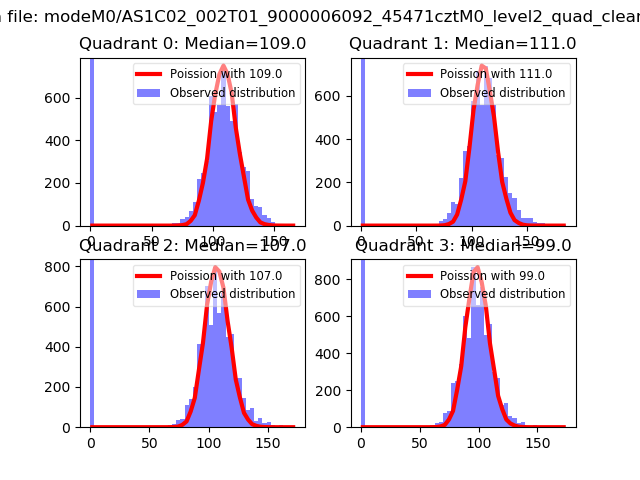 |
 |
| Quadrant-wise count rates Data is divided into 100 sec bins |
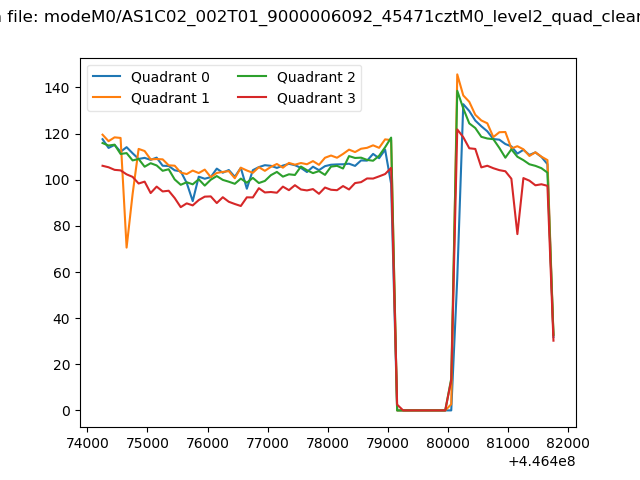 |
|
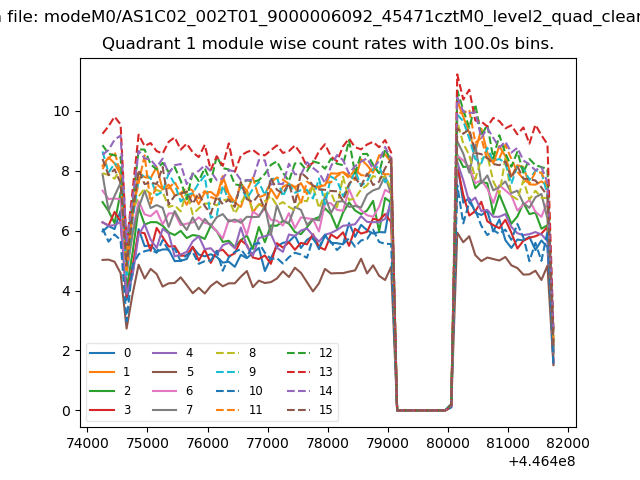
| Module-wise count rates for Quadrant A Data is divided into 100 sec bins |
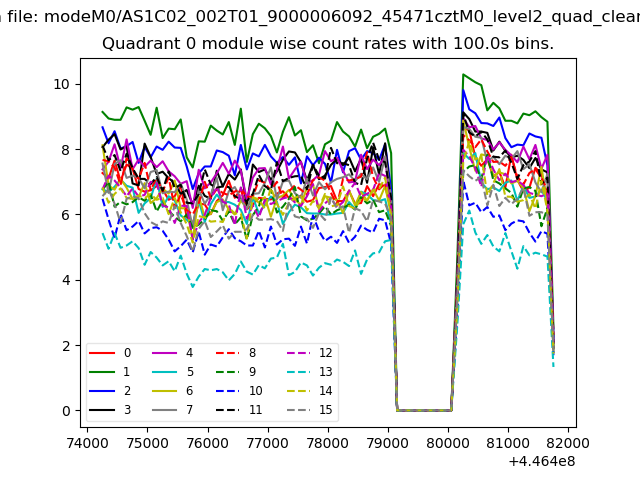 |
 |
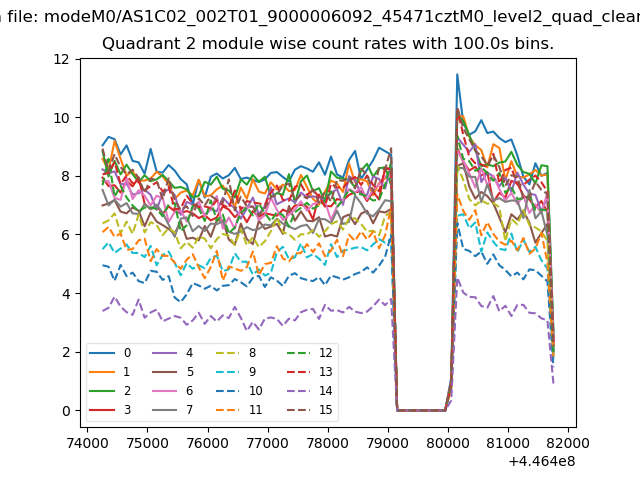
| Module-wise count rates for Quadrant B Data is divided into 100 sec bins |
 |
 |
| Module-wise count rates for Quadrant C Data is divided into 100 sec bins |
 |
 |
| Module-wise count rates for Quadrant D Data is divided into 100 sec bins |
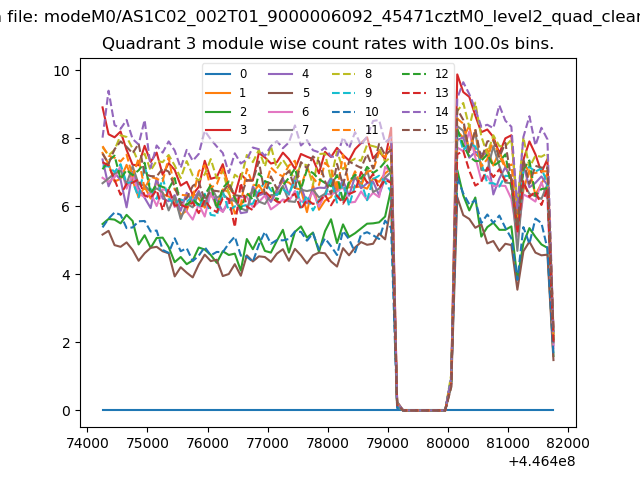 |
 |
| Parameter | Plot |
|---|---|
| CZT HV Monitor | 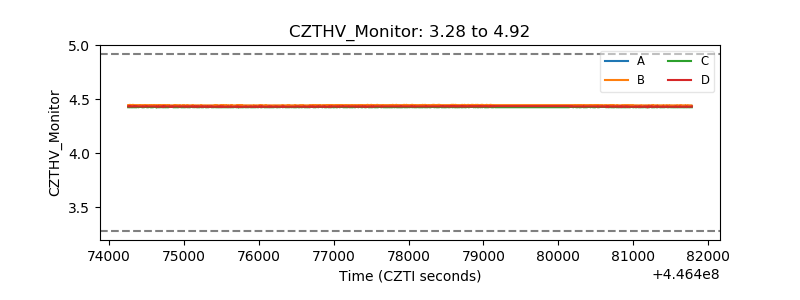 |
| D_VDD | 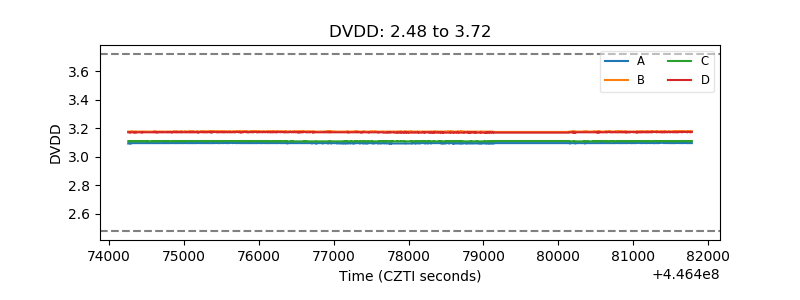 |
| Temperature 1 | 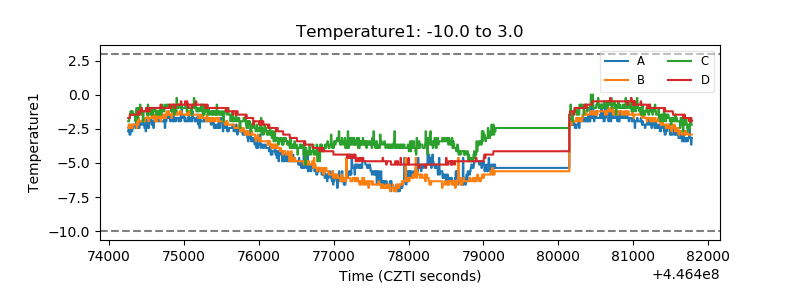 |
| Veto HV Monitor | 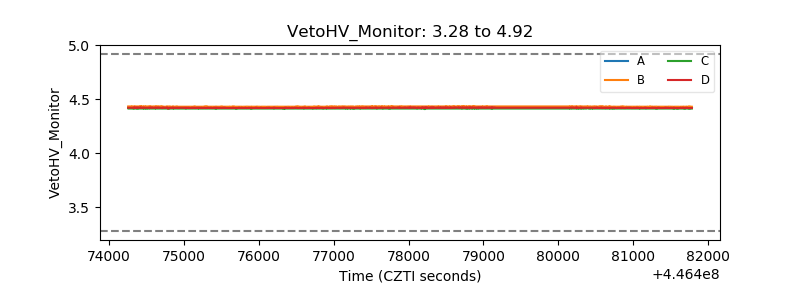 |
| Veto LLD | 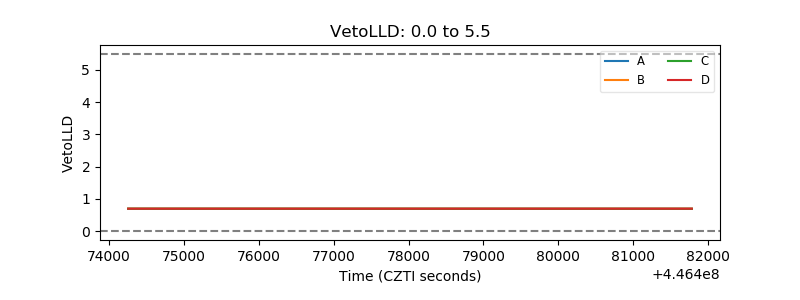 |
| Alpha Counter | 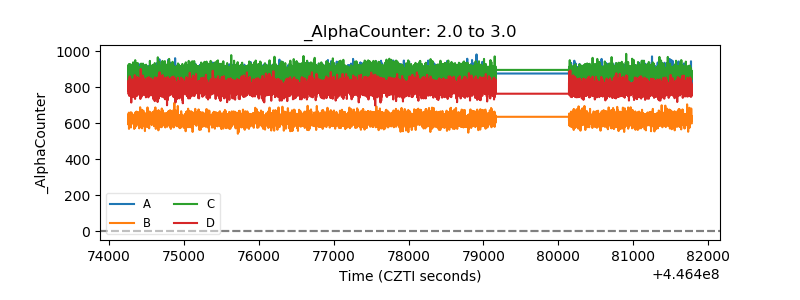 |
| _CPM_Rate | 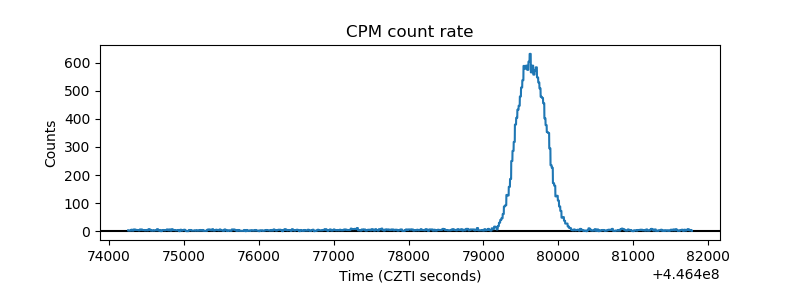 |
| CZT Counter | 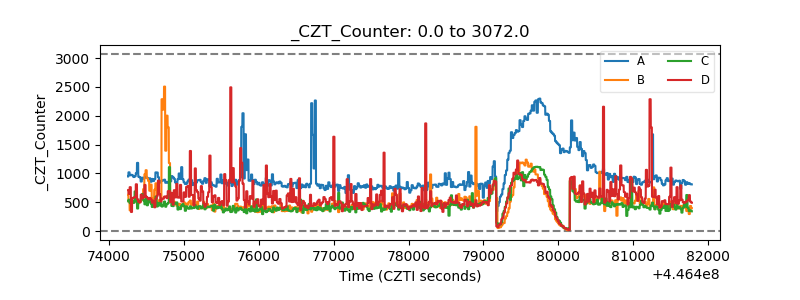 |
| +2.5 Volts monitor | 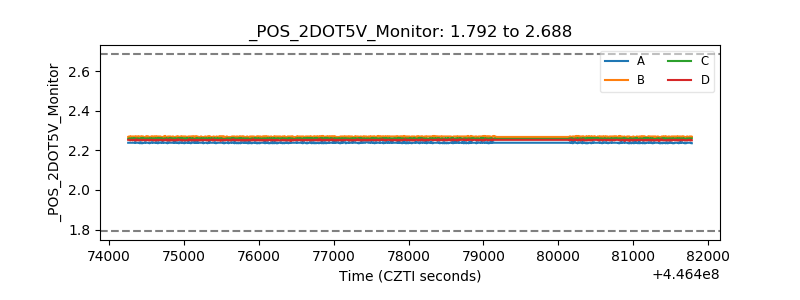 |
| +5 Volts monitor | 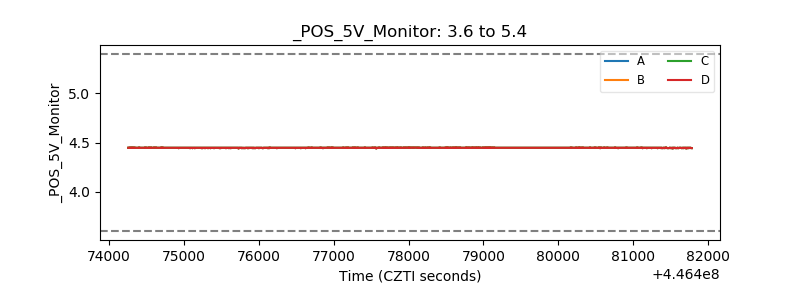 |
| _ROLL_ROT | 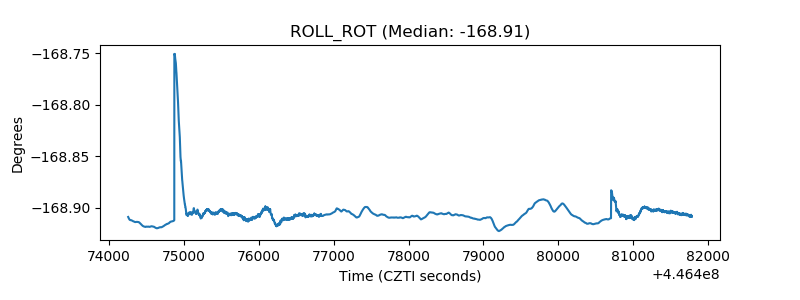 |
| _Roll_DEC | 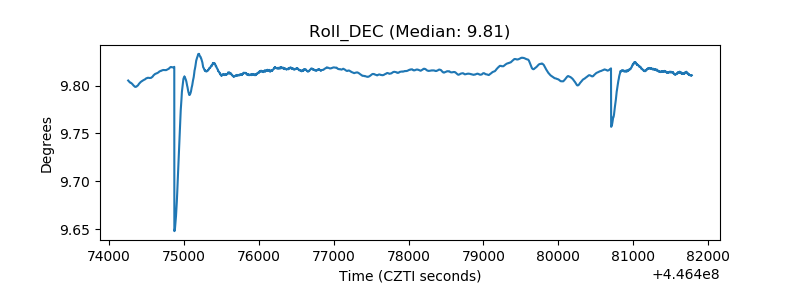 |
| _Roll_RA | 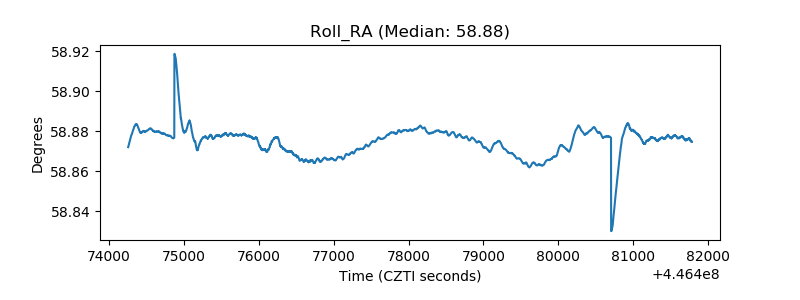 |
| Veto Counter | 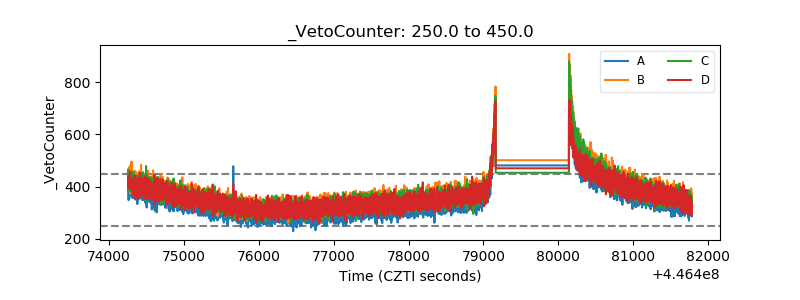 |