| Param | Original file | Final file |
|---|---|---|
| Filename | modeM0/AS1C02_002T01_9000006092_45472cztM0_level2.fits | modeM0/AS1C02_002T01_9000006092_45472cztM0_level2_quad_clean.evt |
| Size (bytes) | 479,877,120 | 112,492,800 |
| Size | 457.6 MB | 107.3 MB |
| Events in quadrant A | 6,041,694 | 740,581 |
| Events in quadrant B | 3,585,625 | 774,546 |
| Events in quadrant C | 3,059,475 | 747,577 |
| Events in quadrant D | 4,555,366 | 674,716 |
| Mode M0 | |||
|---|---|---|---|
| Quadrant | BADHDUFLAG | Total packets | Discarded packets |
| A | 0 | 22505 | 2 |
| B | 0 | 15072 | 2 |
| C | 0 | 13949 | 2 |
| D | 0 | 18138 | 2 |
| Mode M9 | |||
|---|---|---|---|
| Quadrant | BADHDUFLAG | Total packets | Discarded packets |
| A | 0 | 12 | 0 |
| B | 0 | 13 | 0 |
| C | 0 | 13 | 0 |
| D | 0 | 13 | 0 |
| Mode SS | |||
|---|---|---|---|
| Quadrant | BADHDUFLAG | Total packets | Discarded packets |
| A | 0 | 138 | 0 |
| B | 0 | 138 | 0 |
| C | 0 | 138 | 0 |
| D | 0 | 138 | 0 |
| Quadrant | Total seconds | Saturated seconds | Saturation percentage |
|---|---|---|---|
| A | 6720 | 240 | 3.571429% |
| B | 6720 | 99 | 1.473214% |
| C | 6720 | 21 | 0.312500% |
| D | 6720 | 181 | 2.693452% |
Noise dominated data is calculated using 1-second bins in cleaned event files. If a bin has >2000 counts, and if more than 50% of those come from <1% of pixels, then it is considered to be noise-dominated and hence unusable.
| Quadrant | # 1 sec bins | Bins with >0 counts | Bins with >2000 counts | High rate bins dominated by noise | Noise dominated (total time) | Noise dominated (detector-on time) | Marked lightcurve |
|---|---|---|---|---|---|---|---|
| A | 7830 | 6721 | 26 | 26 | 0.33% | 0.39% | 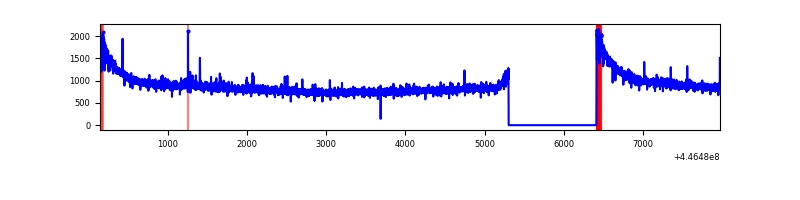 |
| B | 7830 | 6721 | 26 | 26 | 0.33% | 0.39% | 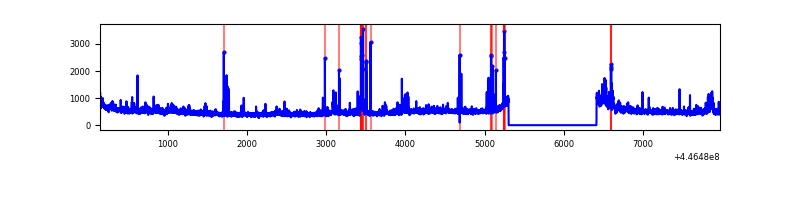 |
| C | 7830 | 6721 | 9 | 9 | 0.11% | 0.13% | 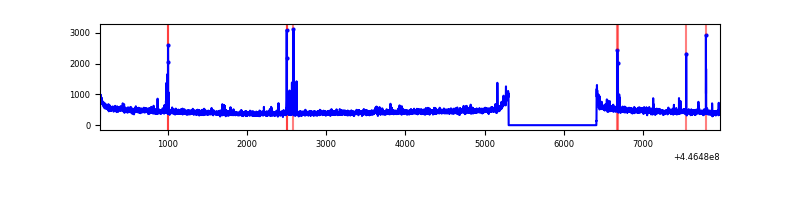 |
| D | 7830 | 6721 | 138 | 138 | 1.76% | 2.05% | 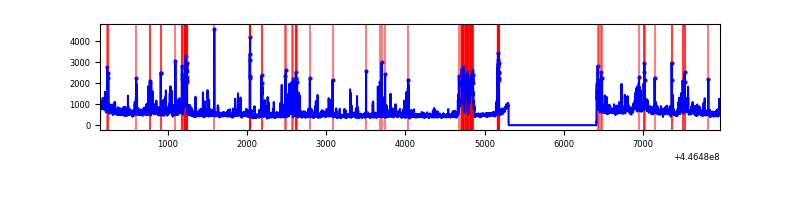 |
Top three noisy pixels from each quadrant. If the there are fewer than three noisy pixels in the level2.evt file, extra rows are filled as -1
| Pixel properties | Quadrant properties | ||||||
|---|---|---|---|---|---|---|---|
| Quadrant | DetID | PixID | Counts | Sigma | Mean | Median | Sigma |
| A | 10 | 83 | 3024462 | 18870.92 | 768 | 752 | 160.2 |
| A | 13 | 248 | 19019 | 114.0 | 768 | 752 | 160.2 |
| A | 13 | 210 | 10492 | 60.79 | 768 | 752 | 160.2 |
| B | 15 | 201 | 200992 | 1313.89 | 770 | 748 | 152.4 |
| B | 3 | 112 | 90763 | 590.63 | 770 | 748 | 152.4 |
| B | 5 | 172 | 89948 | 585.28 | 770 | 748 | 152.4 |
| C | 14 | 254 | 52666 | 291.34 | 756 | 762 | 178.2 |
| C | 1 | 3 | 22644 | 122.82 | 756 | 762 | 178.2 |
| C | 3 | 233 | 14460 | 76.89 | 756 | 762 | 178.2 |
| D | 11 | 241 | 584906 | 3086.27 | 752 | 731 | 189.3 |
| D | 2 | 249 | 345565 | 1821.8 | 752 | 731 | 189.3 |
| D | 13 | 249 | 321775 | 1696.12 | 752 | 731 | 189.3 |
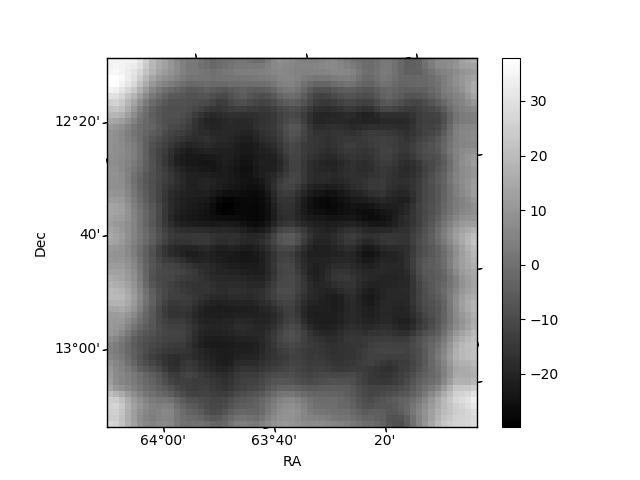
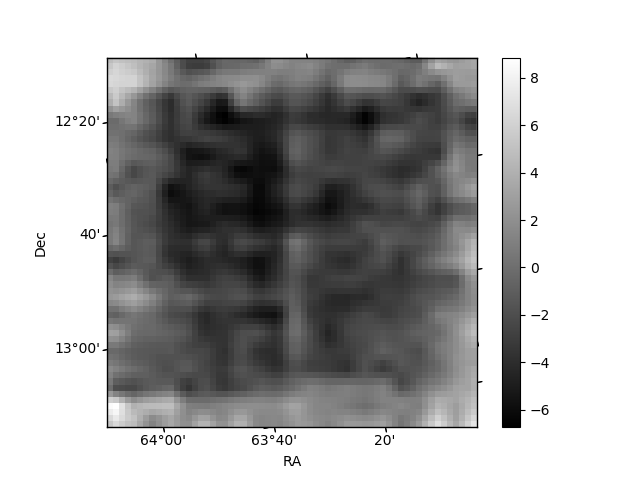
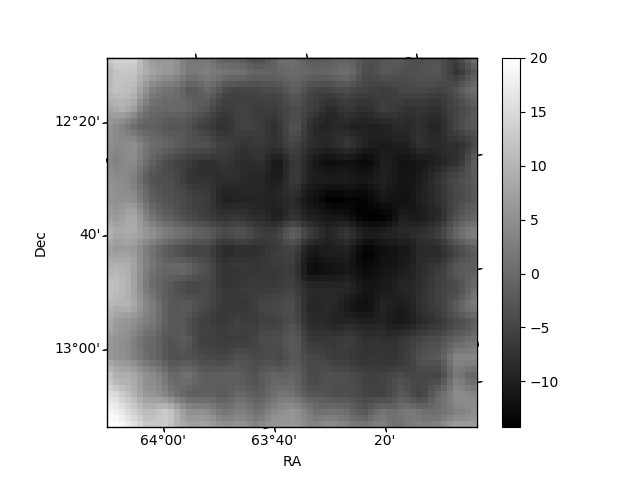
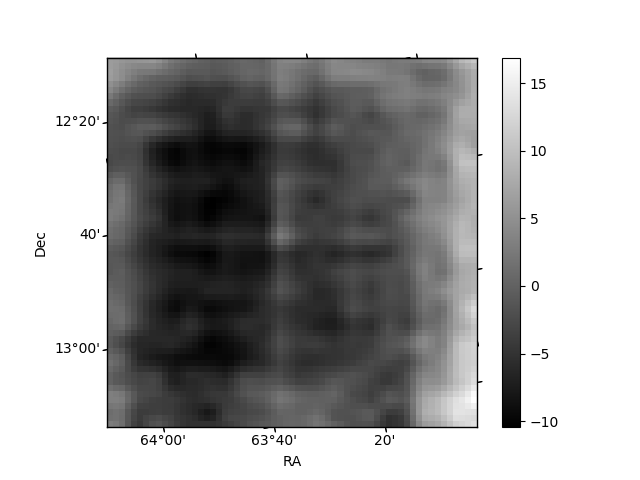
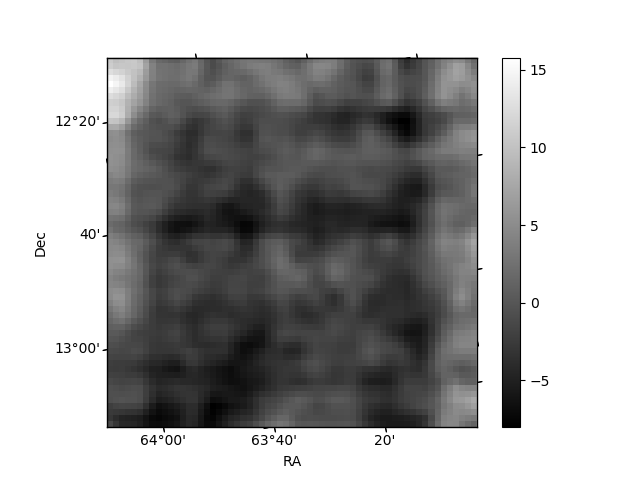
Histogram calculated using DETX and DETY for each event in the final _common_clean file
| Quadrant A | 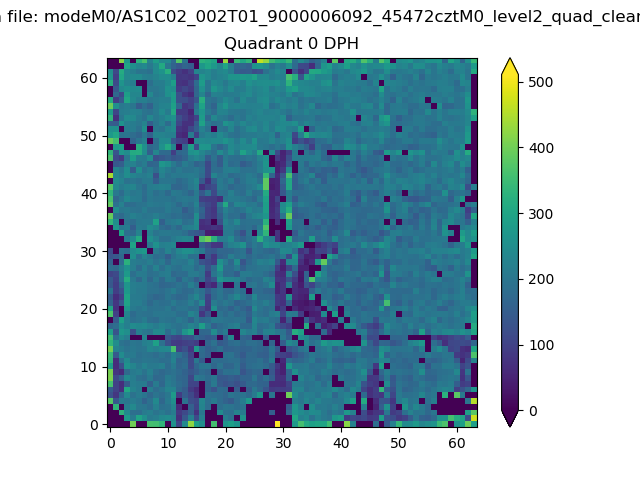 |
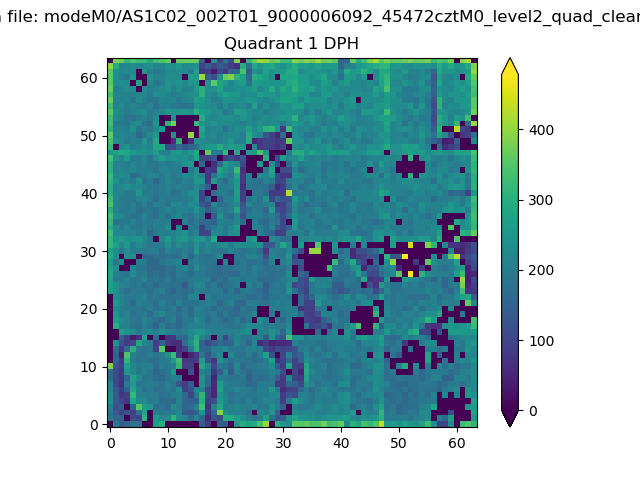 |
Quadrant B |
|---|---|---|---|
| Quadrant D | 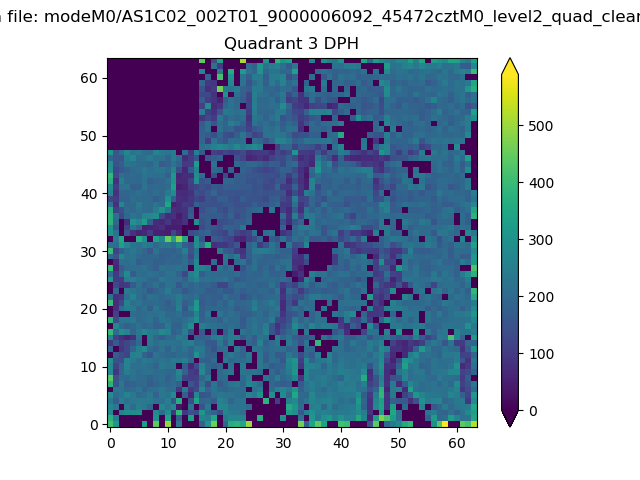 |
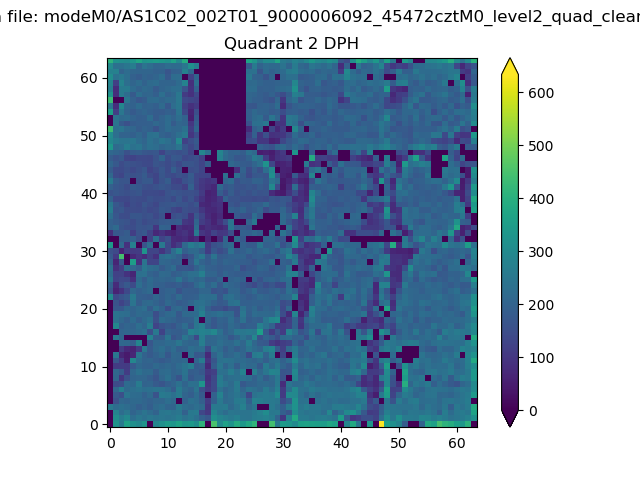 |
Quadrant C |
| Plot type | Count rate plots | Images |
|---|---|---|
| Comparison with Poisson distribution Blue bars denote a histogram of data divided into 1 sec bins. Red curve is a Poisson curve with rate = median count rate of data. |
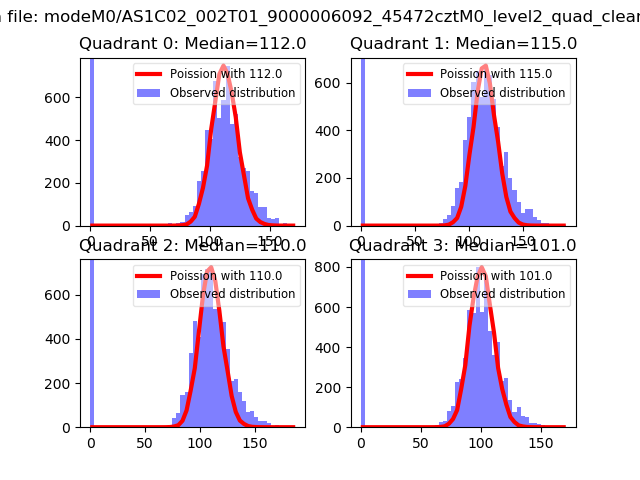 |
 |
| Quadrant-wise count rates Data is divided into 100 sec bins |
 |
|
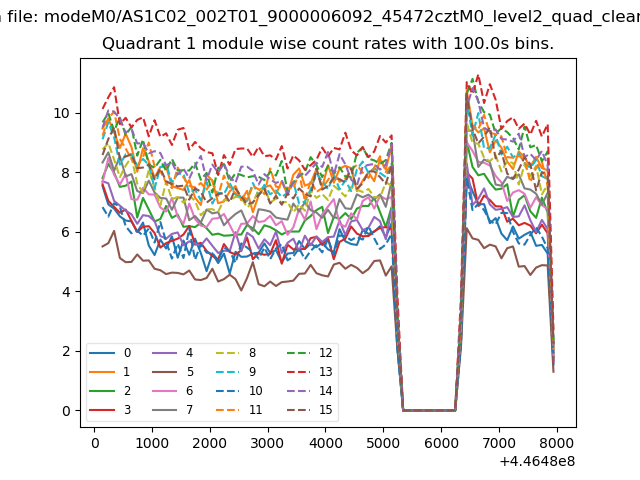
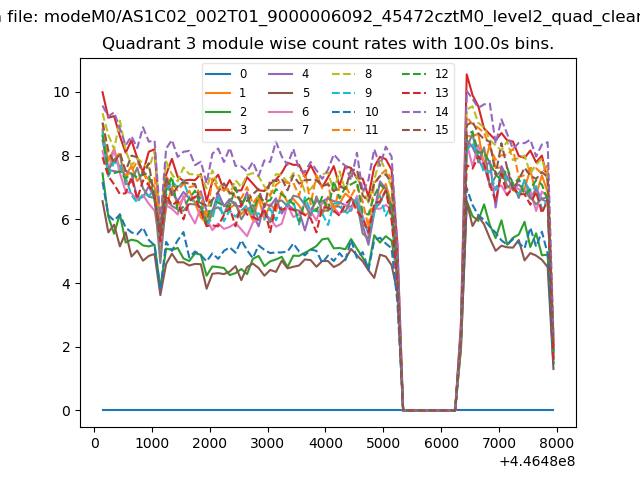
| Module-wise count rates for Quadrant A Data is divided into 100 sec bins |
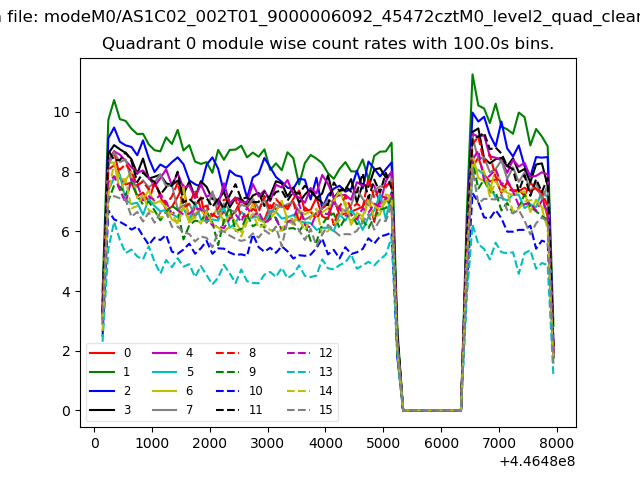 |
 |
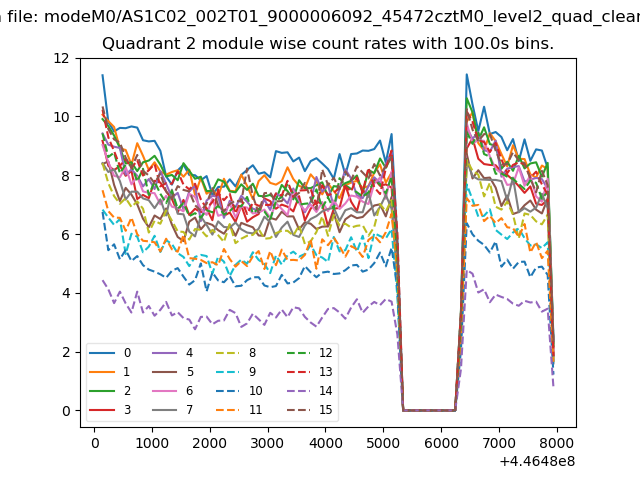
| Module-wise count rates for Quadrant B Data is divided into 100 sec bins |
 |
 |
| Module-wise count rates for Quadrant C Data is divided into 100 sec bins |
 |
 |
| Module-wise count rates for Quadrant D Data is divided into 100 sec bins |
 |
 |
| Parameter | Plot |
|---|---|
| CZT HV Monitor | 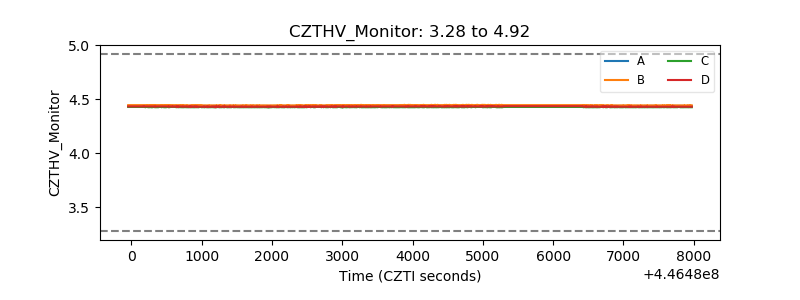 |
| D_VDD | 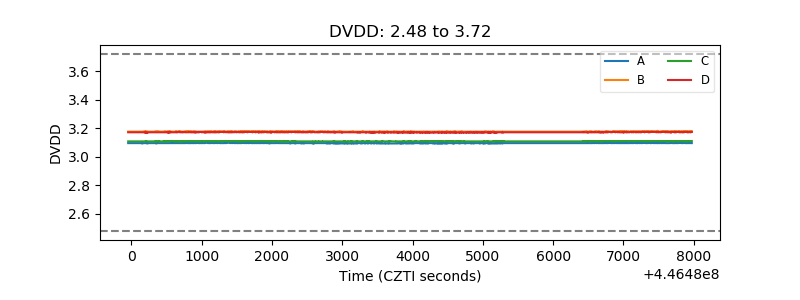 |
| Temperature 1 | 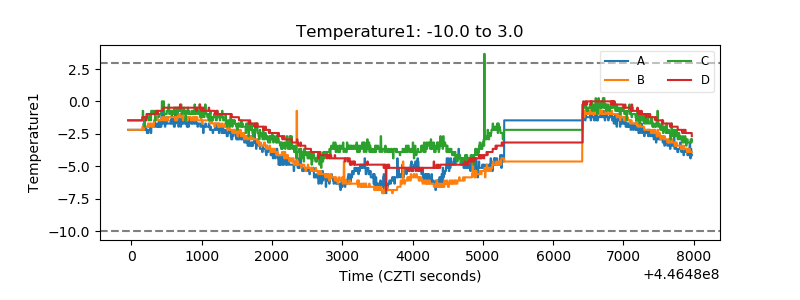 |
| Veto HV Monitor | 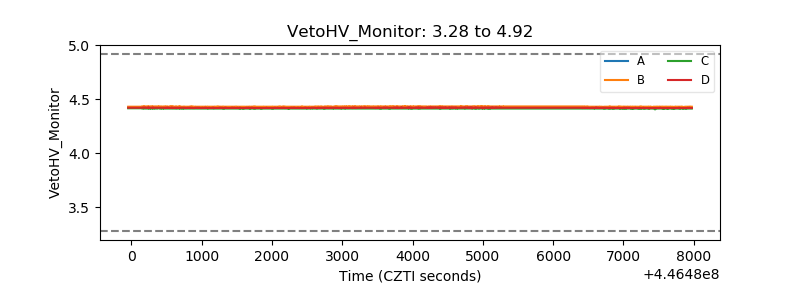 |
| Veto LLD |  |
| Alpha Counter | 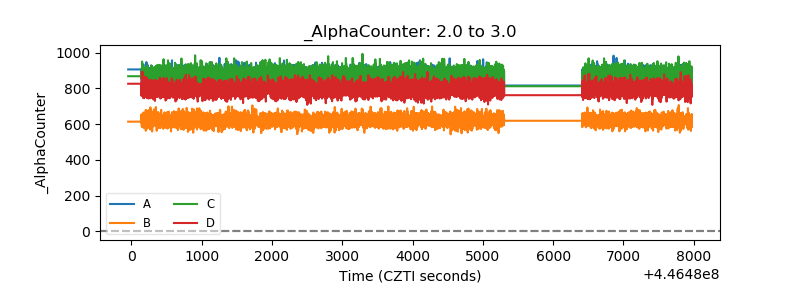 |
| _CPM_Rate | 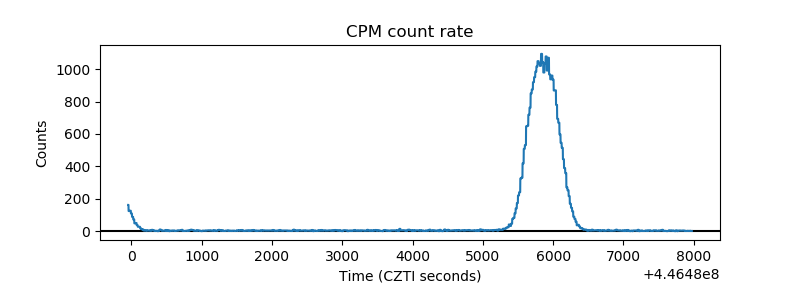 |
| CZT Counter | 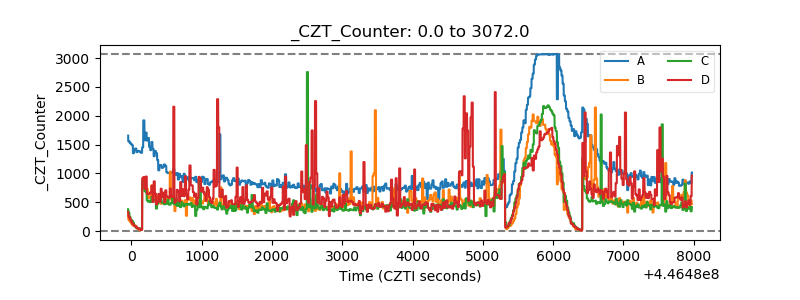 |
| +2.5 Volts monitor | 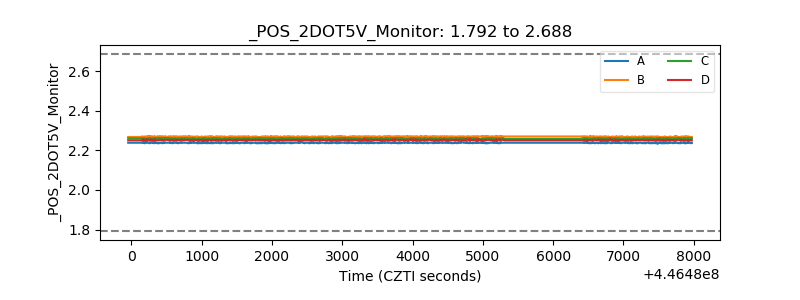 |
| +5 Volts monitor |  |
| _ROLL_ROT | 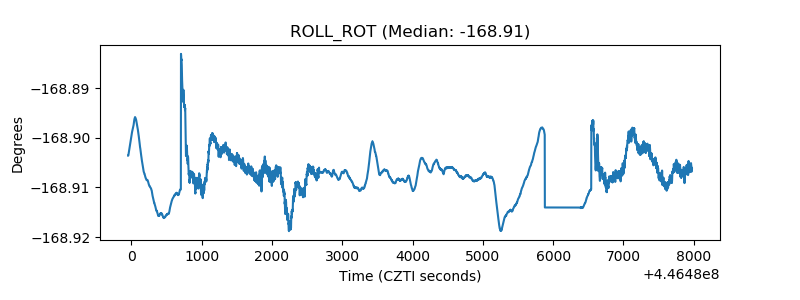 |
| _Roll_DEC | 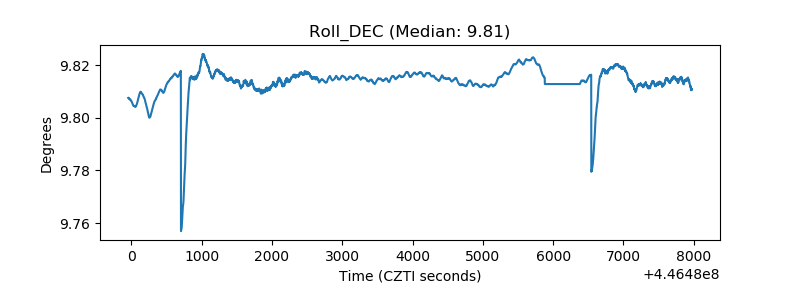 |
| _Roll_RA | 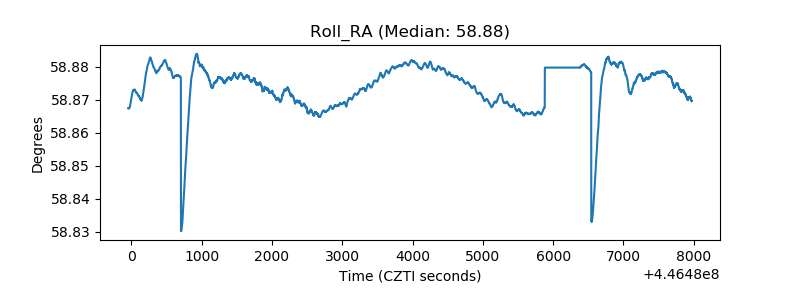 |
| Veto Counter | 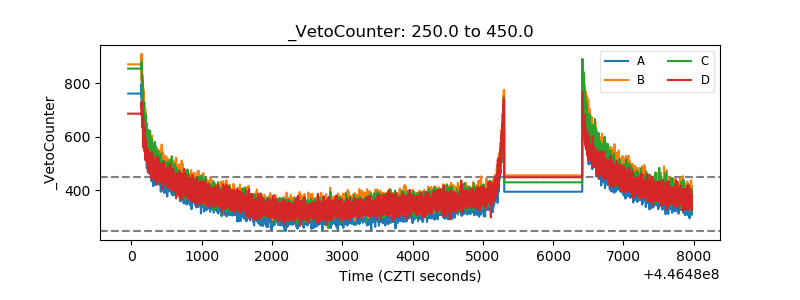 |