| Param | Original file | Final file |
|---|---|---|
| Filename | modeM0/AS1C02_002T01_9000006092_45473cztM0_level2.fits | modeM0/AS1C02_002T01_9000006092_45473cztM0_level2_quad_clean.evt |
| Size (bytes) | 483,059,520 | 109,293,120 |
| Size | 460.7 MB | 104.2 MB |
| Events in quadrant A | 5,864,503 | 724,230 |
| Events in quadrant B | 3,885,611 | 749,349 |
| Events in quadrant C | 2,980,949 | 732,022 |
| Events in quadrant D | 4,654,226 | 657,585 |
| Mode M0 | |||
|---|---|---|---|
| Quadrant | BADHDUFLAG | Total packets | Discarded packets |
| A | 0 | 21835 | 2 |
| B | 0 | 15820 | 2 |
| C | 0 | 13368 | 3 |
| D | 0 | 18345 | 2 |
| Mode M9 | |||
|---|---|---|---|
| Quadrant | BADHDUFLAG | Total packets | Discarded packets |
| A | 0 | 12 | 0 |
| B | 0 | 12 | 0 |
| C | 0 | 12 | 0 |
| D | 0 | 12 | 0 |
| Mode SS | |||
|---|---|---|---|
| Quadrant | BADHDUFLAG | Total packets | Discarded packets |
| A | 0 | 130 | 0 |
| B | 0 | 130 | 0 |
| C | 0 | 130 | 0 |
| D | 0 | 130 | 0 |
| Quadrant | Total seconds | Saturated seconds | Saturation percentage |
|---|---|---|---|
| A | 6395 | 244 | 3.815481% |
| B | 6396 | 241 | 3.767980% |
| C | 6395 | 31 | 0.484754% |
| D | 6395 | 148 | 2.314308% |
Noise dominated data is calculated using 1-second bins in cleaned event files. If a bin has >2000 counts, and if more than 50% of those come from <1% of pixels, then it is considered to be noise-dominated and hence unusable.
| Quadrant | # 1 sec bins | Bins with >0 counts | Bins with >2000 counts | High rate bins dominated by noise | Noise dominated (total time) | Noise dominated (detector-on time) | Marked lightcurve |
|---|---|---|---|---|---|---|---|
| A | 7580 | 6396 | 46 | 46 | 0.61% | 0.72% | 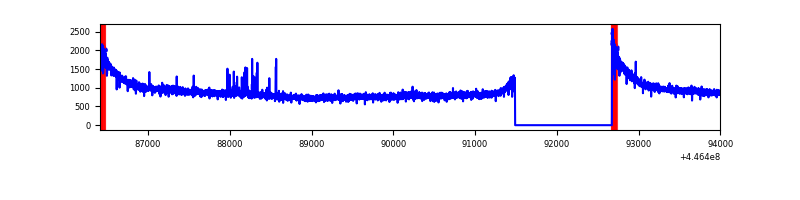 |
| B | 7581 | 6397 | 131 | 131 | 1.73% | 2.05% | 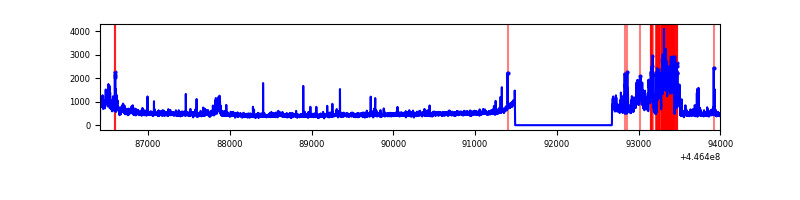 |
| C | 7580 | 6396 | 10 | 10 | 0.13% | 0.16% | 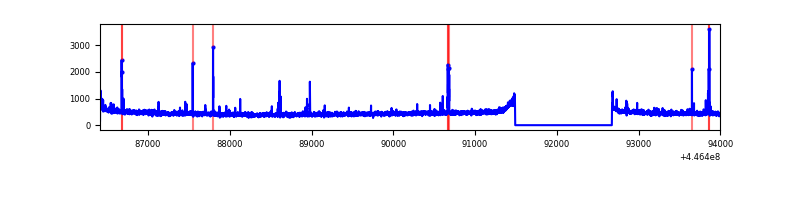 |
| D | 7580 | 6396 | 90 | 90 | 1.19% | 1.41% | 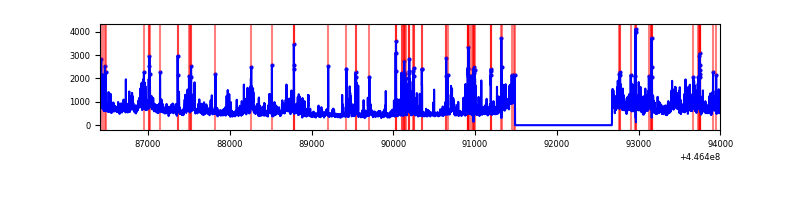 |
Top three noisy pixels from each quadrant. If the there are fewer than three noisy pixels in the level2.evt file, extra rows are filled as -1
| Pixel properties | Quadrant properties | ||||||
|---|---|---|---|---|---|---|---|
| Quadrant | DetID | PixID | Counts | Sigma | Mean | Median | Sigma |
| A | 10 | 83 | 2927273 | 19032.35 | 742 | 725 | 153.8 |
| A | 13 | 248 | 45712 | 292.56 | 742 | 725 | 153.8 |
| A | 0 | 243 | 10283 | 62.16 | 742 | 725 | 153.8 |
| B | 15 | 201 | 626706 | 4316.07 | 743 | 721 | 145.0 |
| B | 3 | 112 | 89949 | 615.21 | 743 | 721 | 145.0 |
| B | 0 | 155 | 51456 | 349.81 | 743 | 721 | 145.0 |
| C | 14 | 254 | 73683 | 423.07 | 733 | 739 | 172.4 |
| C | 3 | 233 | 19940 | 111.36 | 733 | 739 | 172.4 |
| C | 12 | 249 | 8984 | 47.82 | 733 | 739 | 172.4 |
| D | 11 | 241 | 908659 | 4985.89 | 724 | 701 | 182.1 |
| D | 1 | 52 | 401192 | 2199.23 | 724 | 701 | 182.1 |
| D | 2 | 249 | 171881 | 940.0 | 724 | 701 | 182.1 |
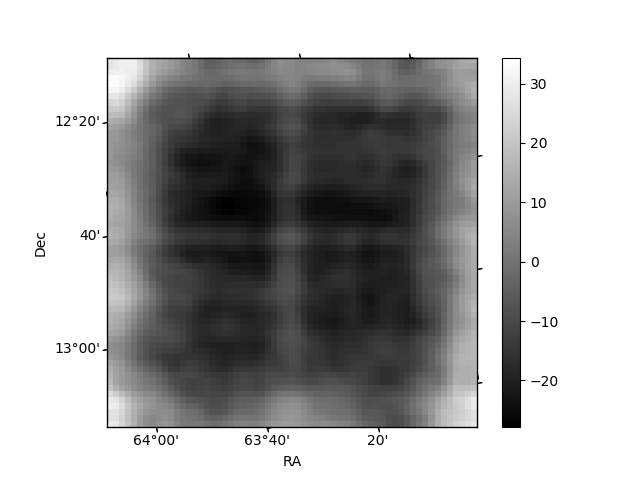
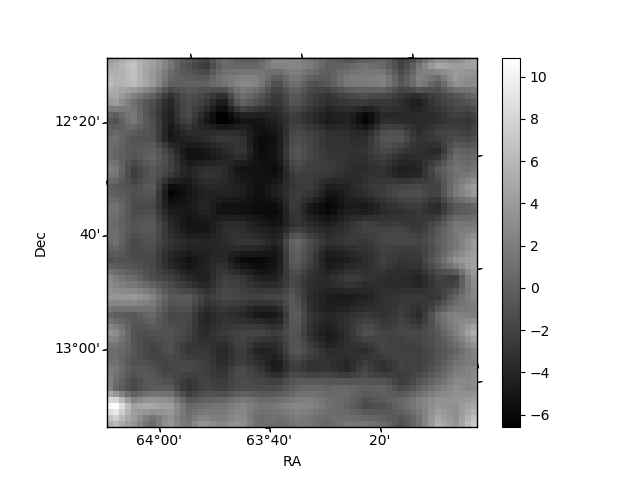
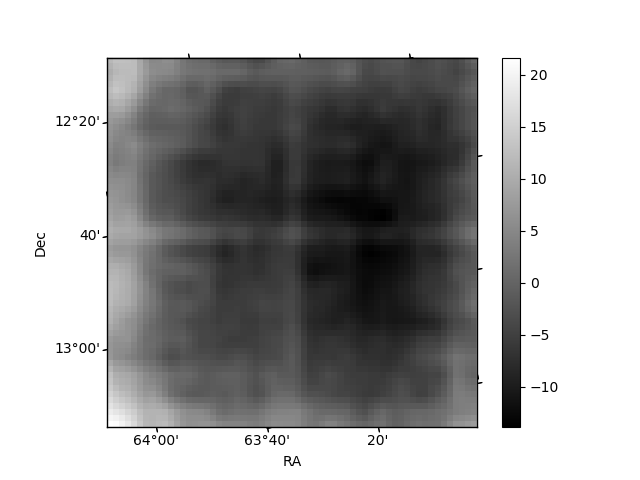
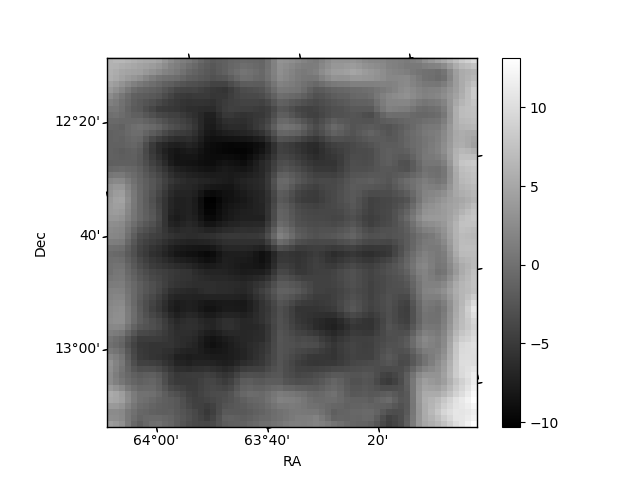
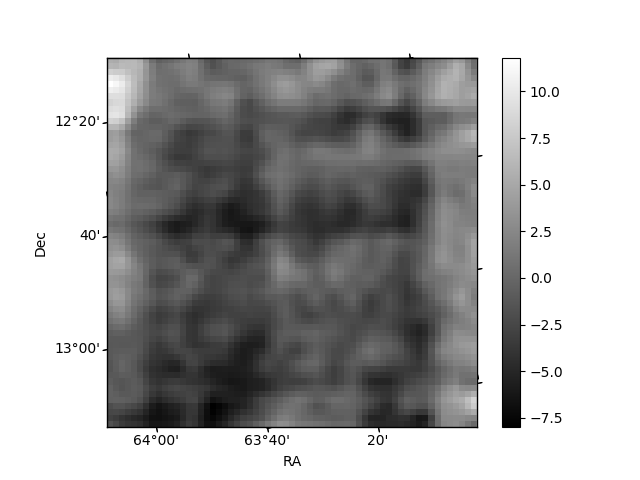
Histogram calculated using DETX and DETY for each event in the final _common_clean file
| Quadrant A | 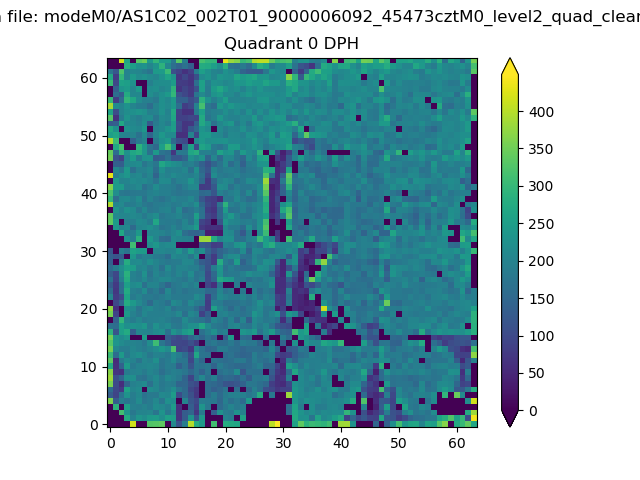 |
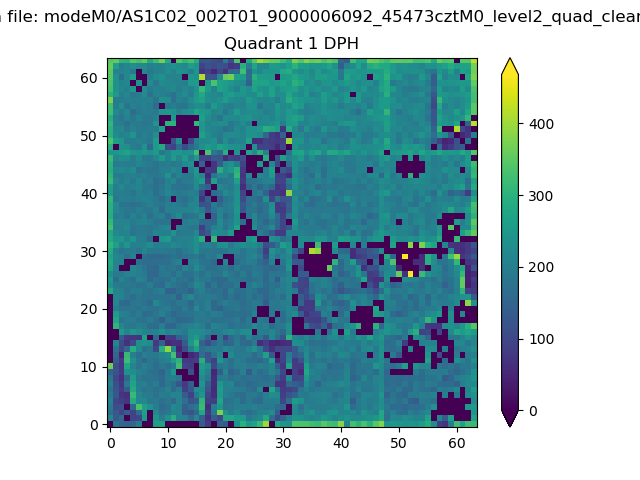 |
Quadrant B |
|---|---|---|---|
| Quadrant D | 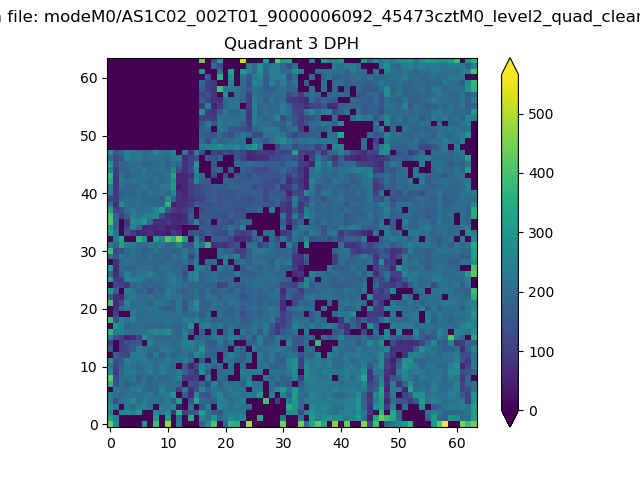 |
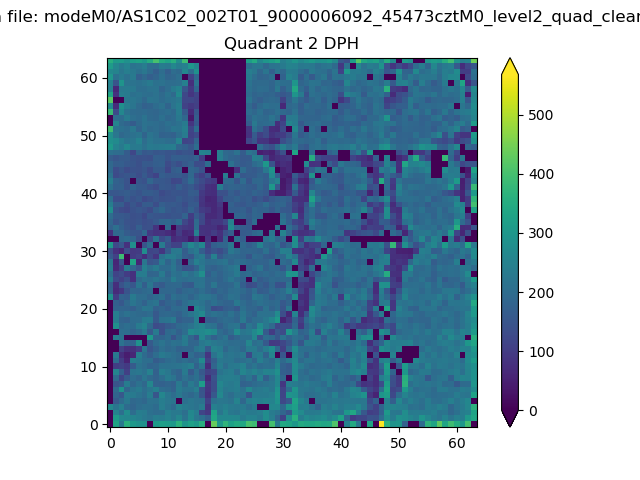 |
Quadrant C |
| Plot type | Count rate plots | Images |
|---|---|---|
| Comparison with Poisson distribution Blue bars denote a histogram of data divided into 1 sec bins. Red curve is a Poisson curve with rate = median count rate of data. |
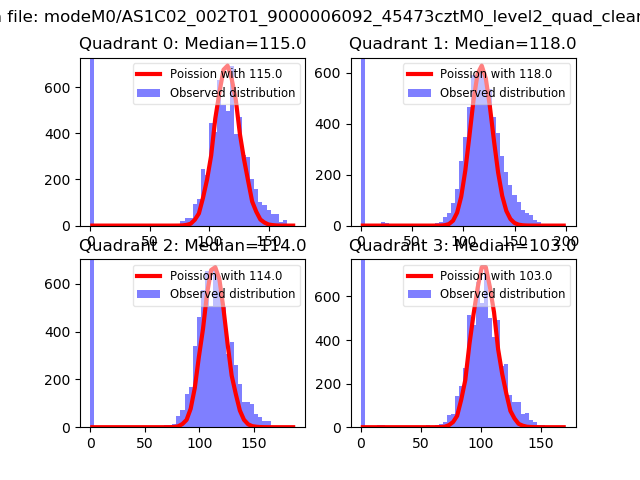 |
 |
| Quadrant-wise count rates Data is divided into 100 sec bins |
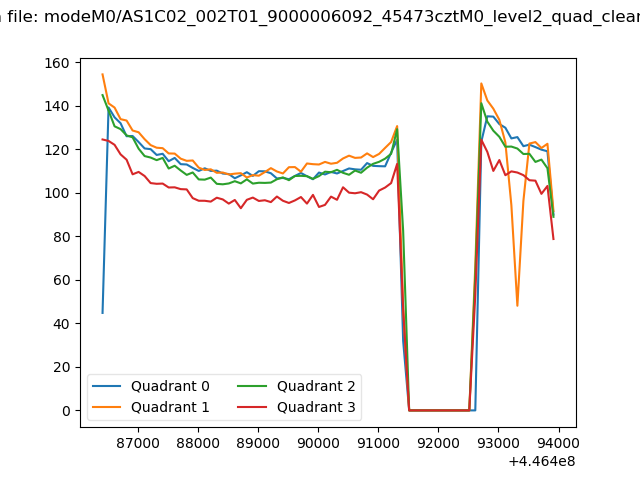 |
|
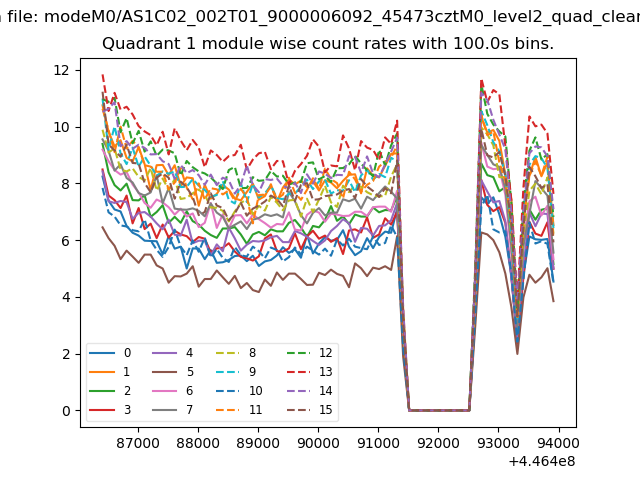
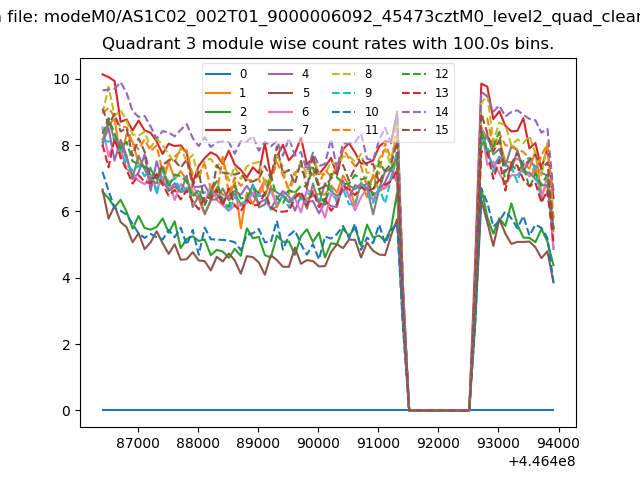
| Module-wise count rates for Quadrant A Data is divided into 100 sec bins |
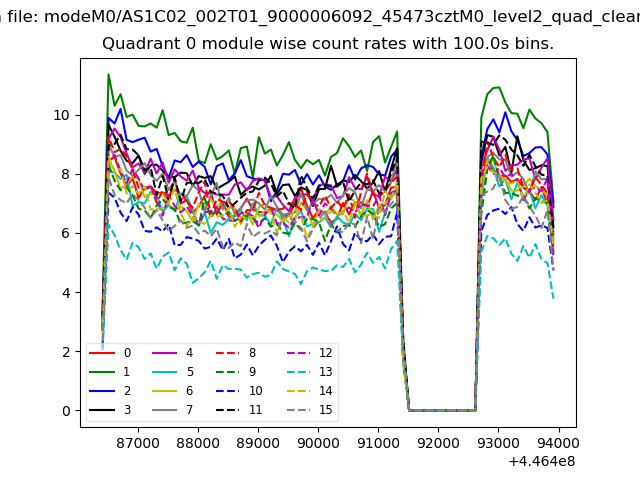 |
 |
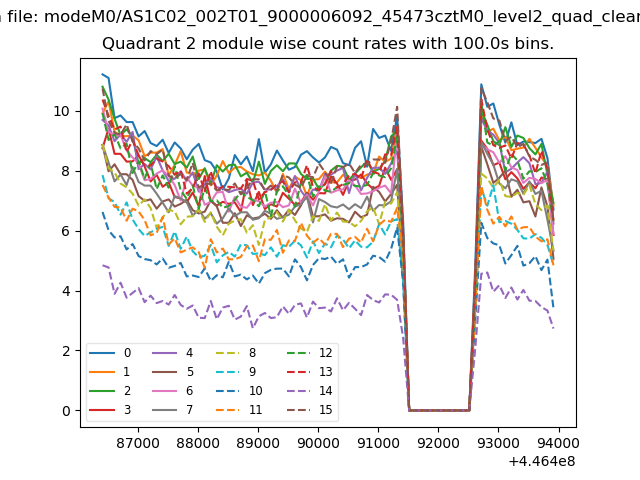
| Module-wise count rates for Quadrant B Data is divided into 100 sec bins |
 |
 |
| Module-wise count rates for Quadrant C Data is divided into 100 sec bins |
 |
 |
| Module-wise count rates for Quadrant D Data is divided into 100 sec bins |
 |
 |
| Parameter | Plot |
|---|---|
| CZT HV Monitor | 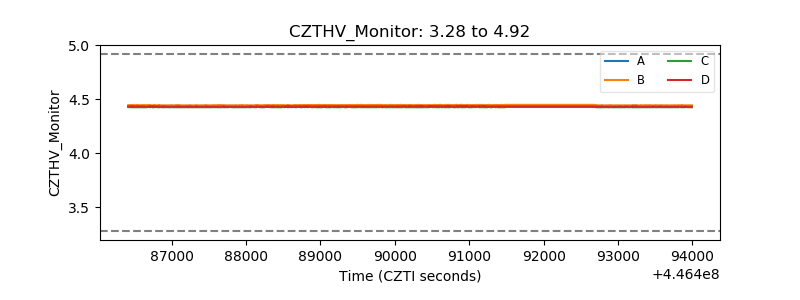 |
| D_VDD | 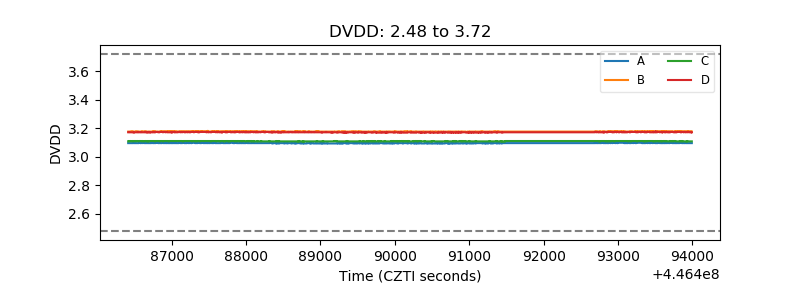 |
| Temperature 1 | 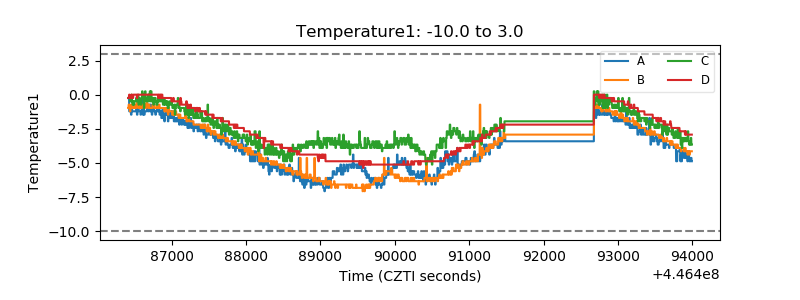 |
| Veto HV Monitor | 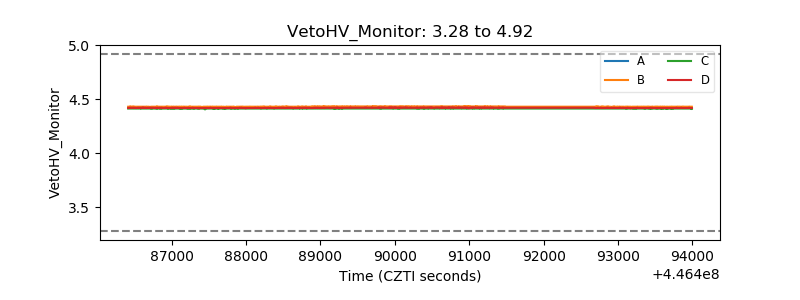 |
| Veto LLD | 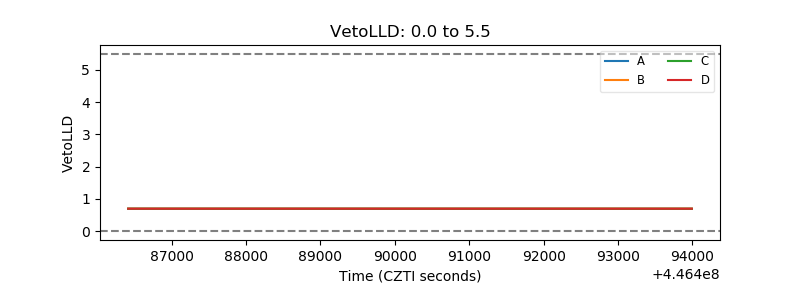 |
| Alpha Counter | 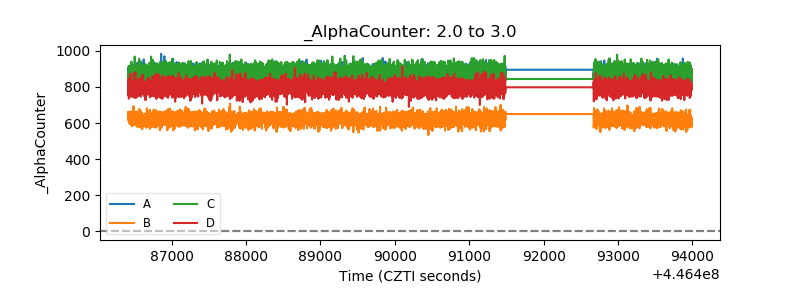 |
| _CPM_Rate |  |
| CZT Counter | 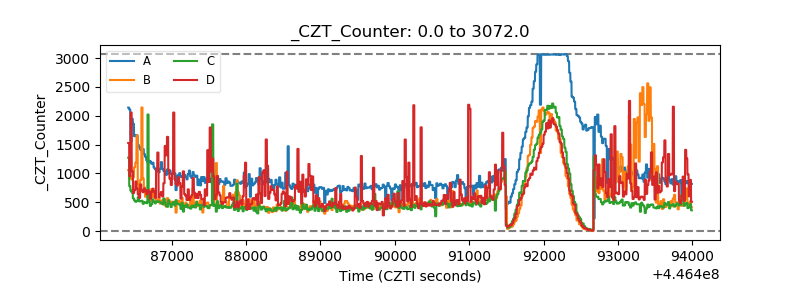 |
| +2.5 Volts monitor | 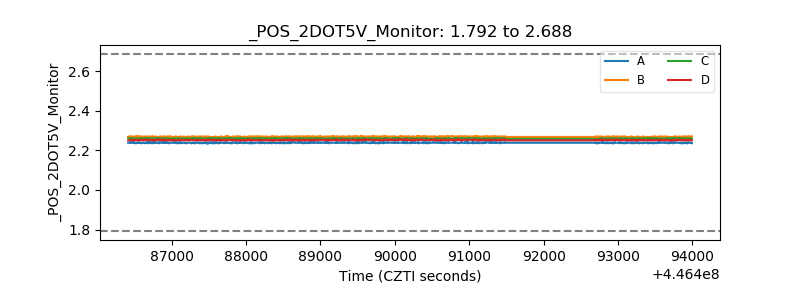 |
| +5 Volts monitor | 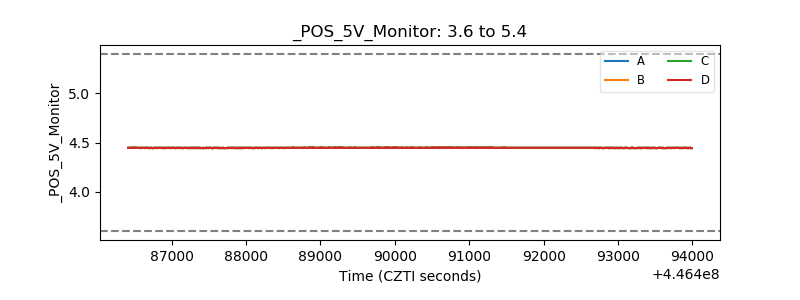 |
| _ROLL_ROT | 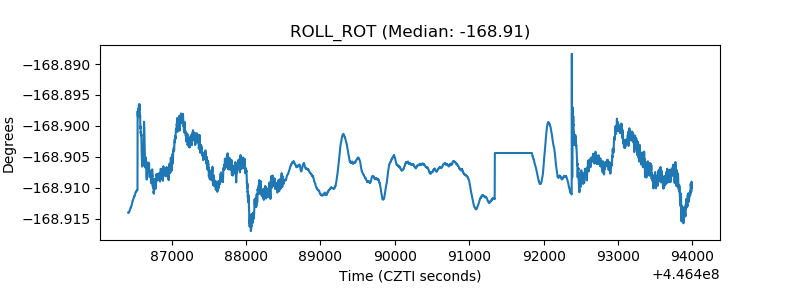 |
| _Roll_DEC | 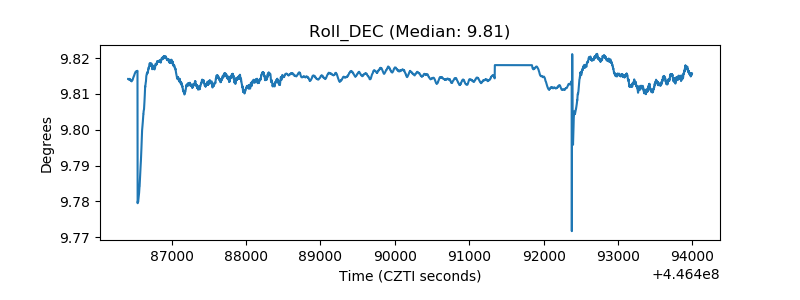 |
| _Roll_RA | 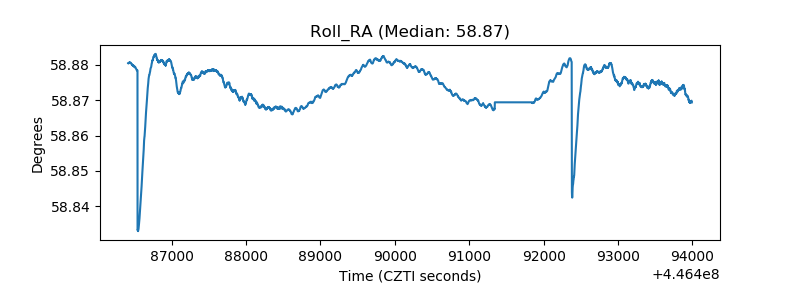 |
| Veto Counter | 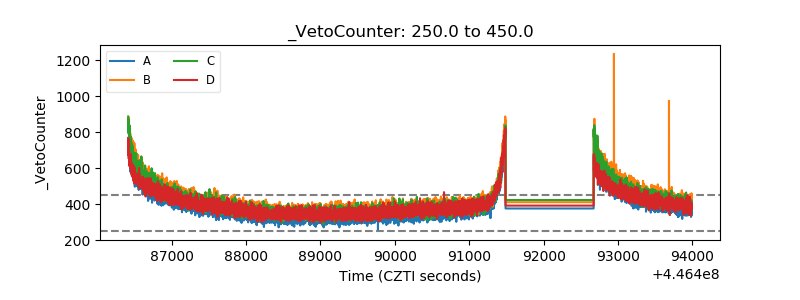 |