| Param | Original file | Final file |
|---|---|---|
| Filename | modeM0/AS1A13_054T01_9000006098_45486cztM0_level2.fits | modeM0/AS1A13_054T01_9000006098_45486cztM0_level2_quad_clean.evt |
| Size (bytes) | 217,169,280 | 49,227,840 |
| Size | 207.1 MB | 46.9 MB |
| Events in quadrant A | 2,606,171 | 323,931 |
| Events in quadrant B | 1,462,386 | 346,248 |
| Events in quadrant C | 1,433,153 | 322,910 |
| Events in quadrant D | 2,313,233 | 293,112 |
| Mode M0 | |||
|---|---|---|---|
| Quadrant | BADHDUFLAG | Total packets | Discarded packets |
| A | 0 | 9745 | 1 |
| B | 0 | 6167 | 1 |
| C | 0 | 6207 | 1 |
| D | 0 | 8885 | 1 |
| Mode SS | |||
|---|---|---|---|
| Quadrant | BADHDUFLAG | Total packets | Discarded packets |
| A | 0 | 60 | 0 |
| B | 0 | 60 | 0 |
| C | 0 | 60 | 0 |
| D | 0 | 60 | 0 |
| Mode M9 | |||
|---|---|---|---|
| Quadrant | BADHDUFLAG | Total packets | Discarded packets |
| A | 0 | 10 | 0 |
| B | 0 | 10 | 0 |
| C | 0 | 10 | 0 |
| D | 0 | 10 | 0 |
| Quadrant | Total seconds | Saturated seconds | Saturation percentage |
|---|---|---|---|
| A | 2861 | 163 | 5.697309% |
| B | 2861 | 78 | 2.726319% |
| C | 2861 | 81 | 2.831178% |
| D | 2861 | 136 | 4.753583% |
Noise dominated data is calculated using 1-second bins in cleaned event files. If a bin has >2000 counts, and if more than 50% of those come from <1% of pixels, then it is considered to be noise-dominated and hence unusable.
| Quadrant | # 1 sec bins | Bins with >0 counts | Bins with >2000 counts | High rate bins dominated by noise | Noise dominated (total time) | Noise dominated (detector-on time) | Marked lightcurve |
|---|---|---|---|---|---|---|---|
| A | 3891 | 2862 | 4 | 4 | 0.10% | 0.14% | 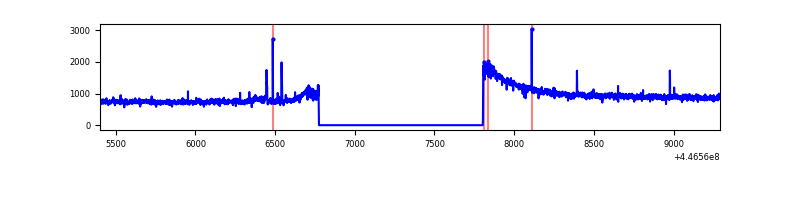 |
| B | 3891 | 2862 | 1 | 1 | 0.03% | 0.03% | 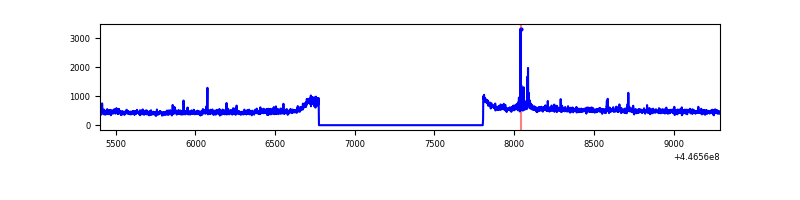 |
| C | 3891 | 2862 | 0 | 0 | 0.00% | 0.00% | 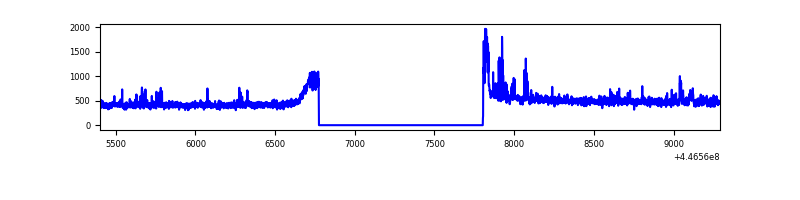 |
| D | 3891 | 2862 | 55 | 55 | 1.41% | 1.92% | 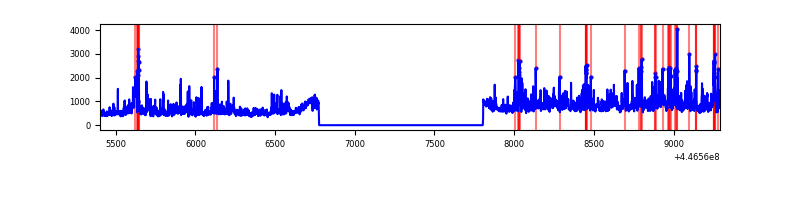 |
Top three noisy pixels from each quadrant. If the there are fewer than three noisy pixels in the level2.evt file, extra rows are filled as -1
| Pixel properties | Quadrant properties | ||||||
|---|---|---|---|---|---|---|---|
| Quadrant | DetID | PixID | Counts | Sigma | Mean | Median | Sigma |
| A | 10 | 83 | 1218983 | 16477.81 | 351 | 343 | 74.0 |
| A | 2 | 79 | 25143 | 335.33 | 351 | 343 | 74.0 |
| A | 7 | 191 | 6202 | 79.22 | 351 | 343 | 74.0 |
| B | 3 | 112 | 27959 | 387.97 | 352 | 342 | 71.2 |
| B | 15 | 201 | 26596 | 368.82 | 352 | 342 | 71.2 |
| B | 12 | 111 | 8866 | 119.75 | 352 | 342 | 71.2 |
| C | 12 | 2 | 48044 | 573.7 | 346 | 348 | 83.1 |
| C | 3 | 233 | 22456 | 265.92 | 346 | 348 | 83.1 |
| C | 14 | 254 | 6070 | 68.83 | 346 | 348 | 83.1 |
| D | 11 | 241 | 512758 | 5760.18 | 345 | 333 | 89.0 |
| D | 1 | 52 | 232550 | 2610.35 | 345 | 333 | 89.0 |
| D | 13 | 249 | 89483 | 1002.14 | 345 | 333 | 89.0 |
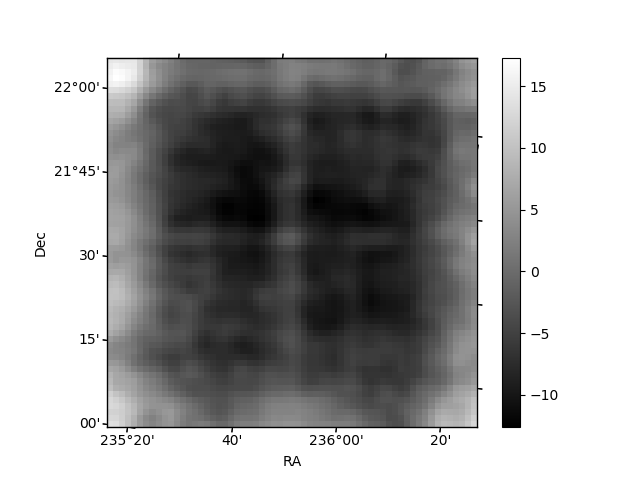
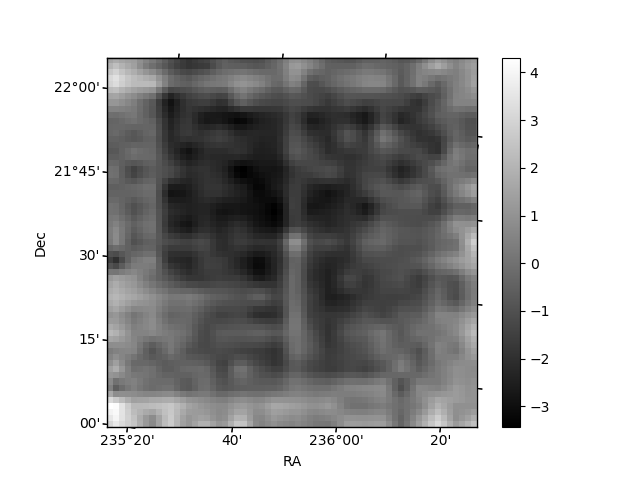
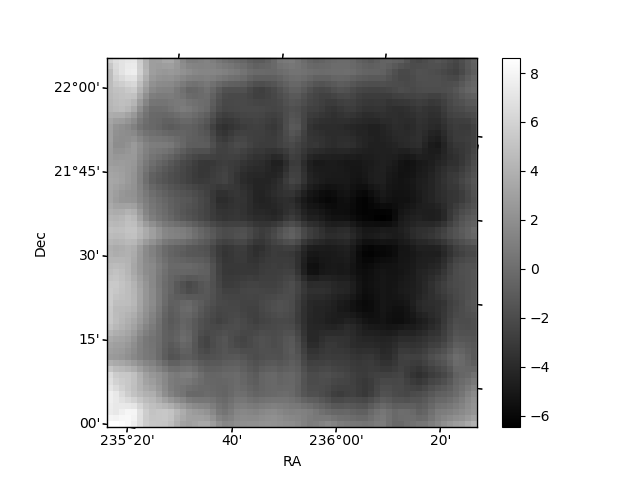
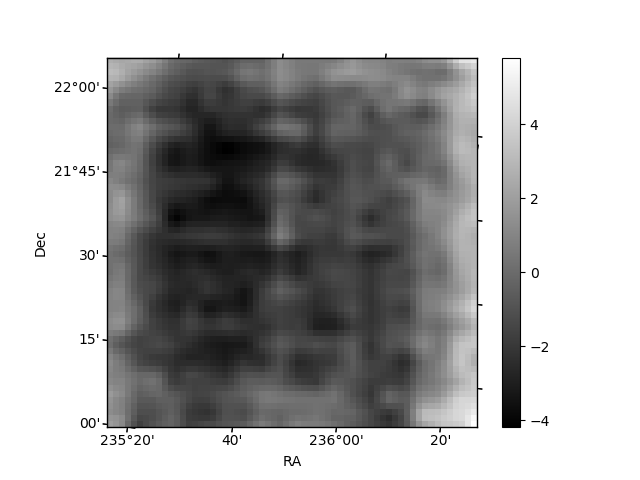
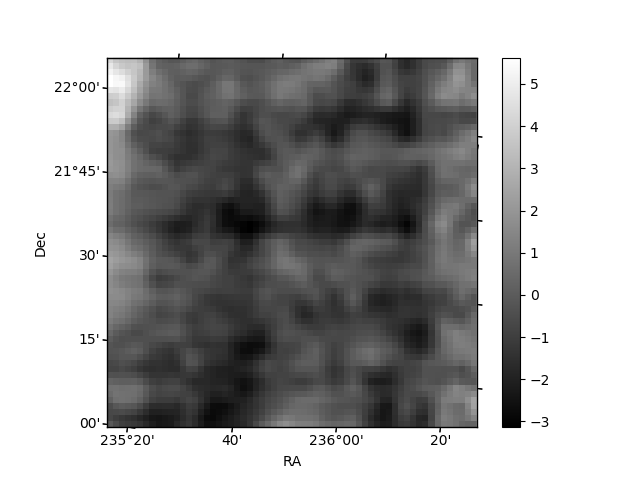
Histogram calculated using DETX and DETY for each event in the final _common_clean file
| Quadrant A | 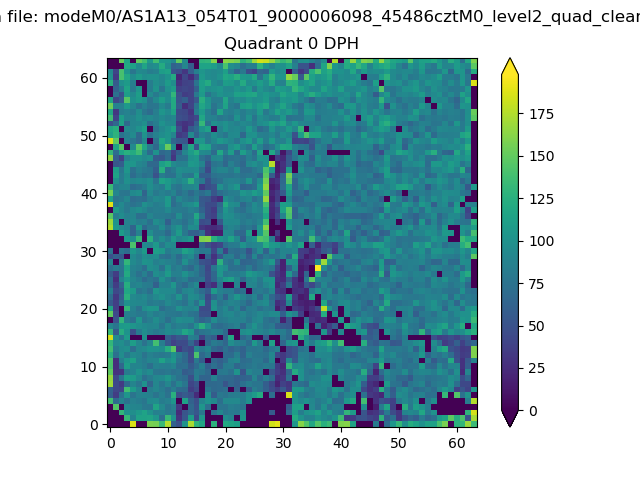 |
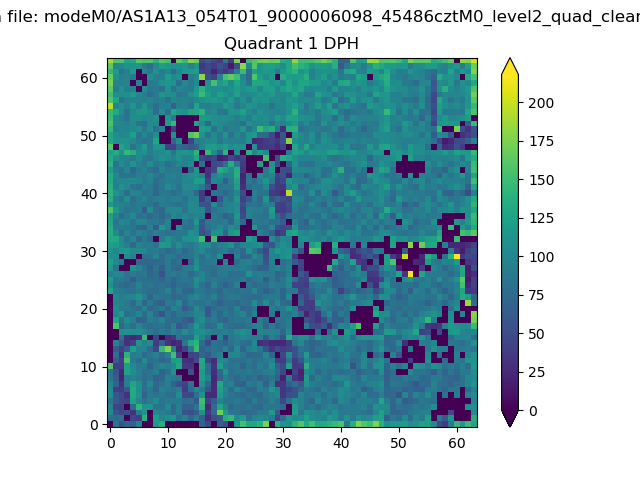 |
Quadrant B |
|---|---|---|---|
| Quadrant D | 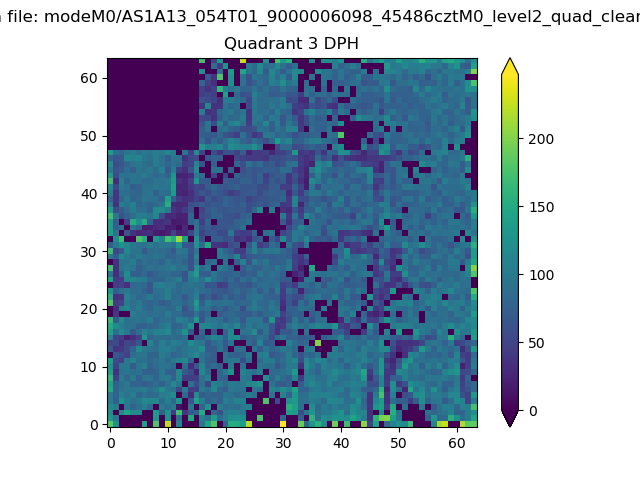 |
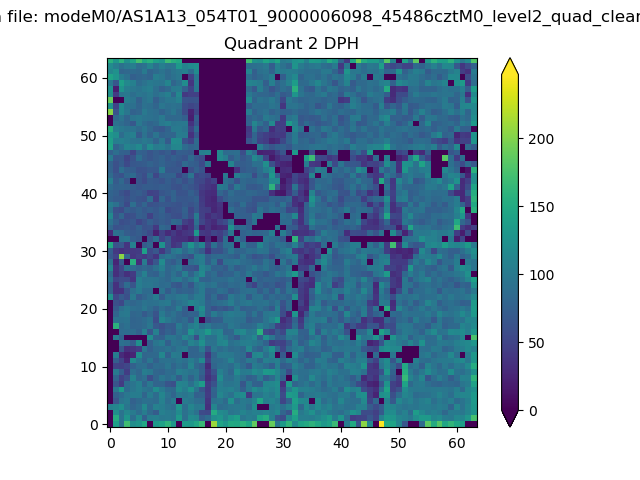 |
Quadrant C |
| Plot type | Count rate plots | Images |
|---|---|---|
| Comparison with Poisson distribution Blue bars denote a histogram of data divided into 1 sec bins. Red curve is a Poisson curve with rate = median count rate of data. |
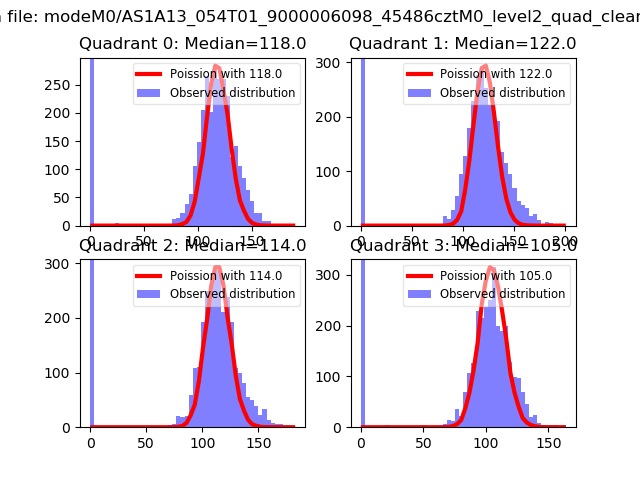 |
 |
| Quadrant-wise count rates Data is divided into 100 sec bins |
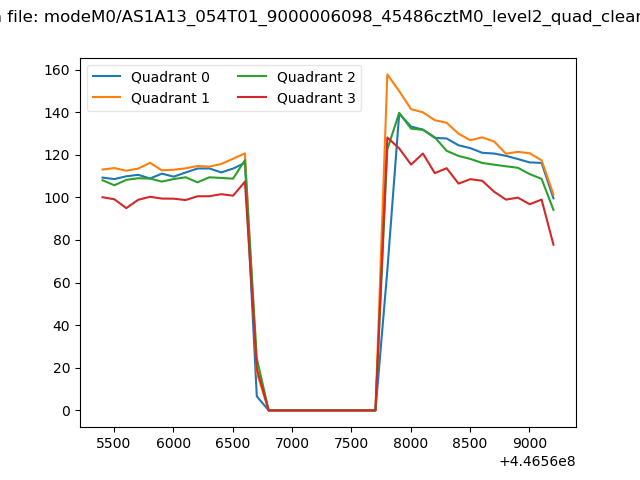 |
|
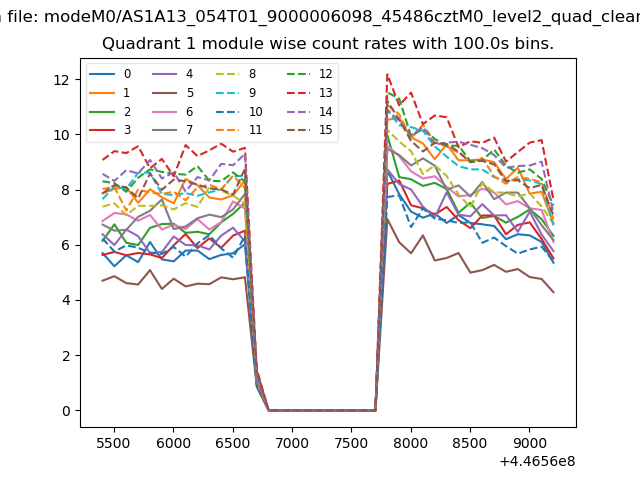
| Module-wise count rates for Quadrant A Data is divided into 100 sec bins |
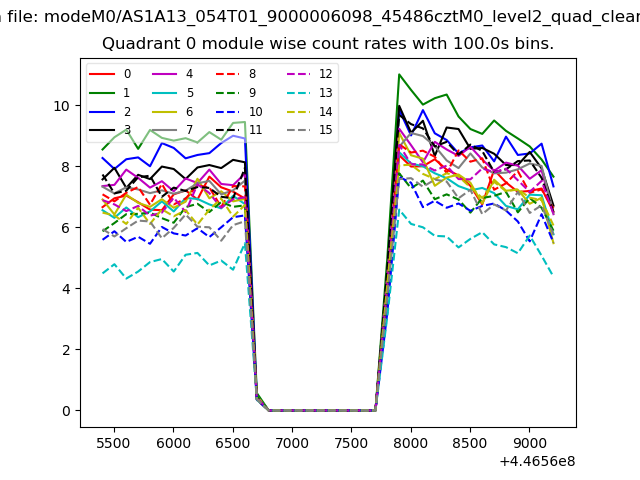 |
 |
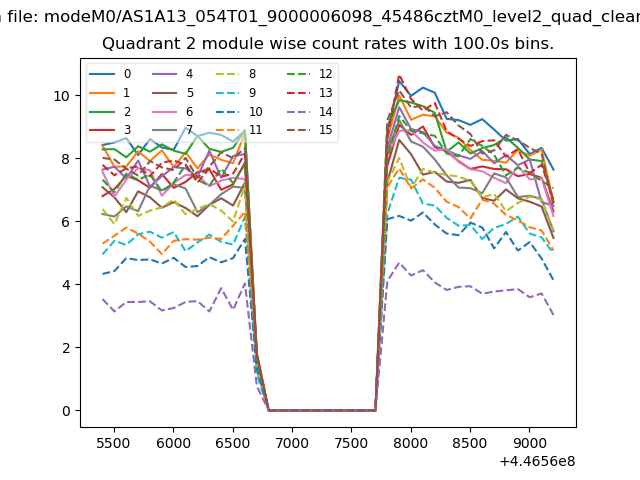
| Module-wise count rates for Quadrant B Data is divided into 100 sec bins |
 |
 |
| Module-wise count rates for Quadrant C Data is divided into 100 sec bins |
 |
 |
| Module-wise count rates for Quadrant D Data is divided into 100 sec bins |
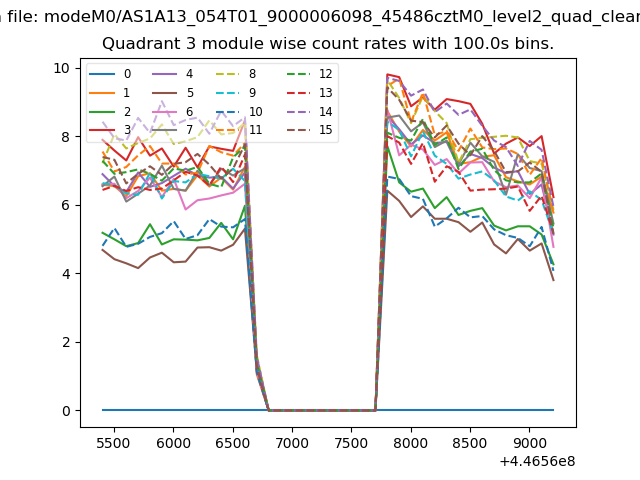 |
 |
| Parameter | Plot |
|---|---|
| CZT HV Monitor | 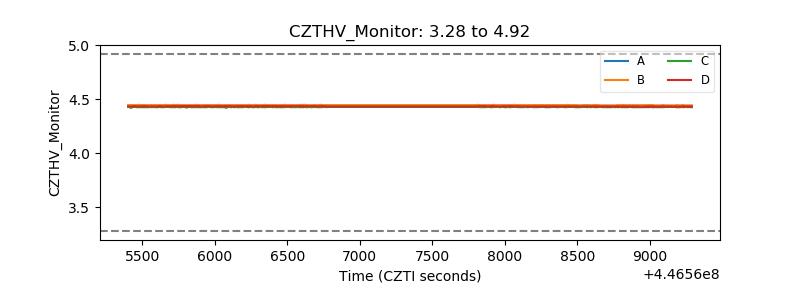 |
| D_VDD | 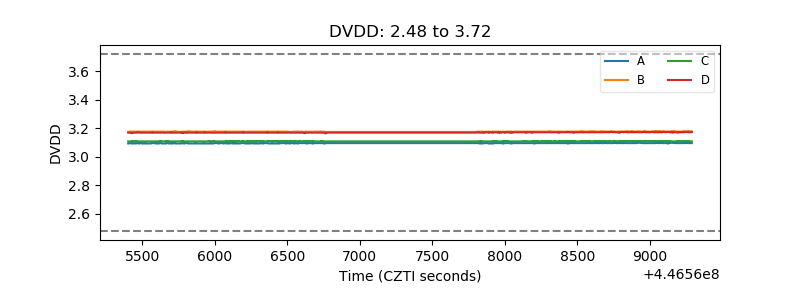 |
| Temperature 1 | 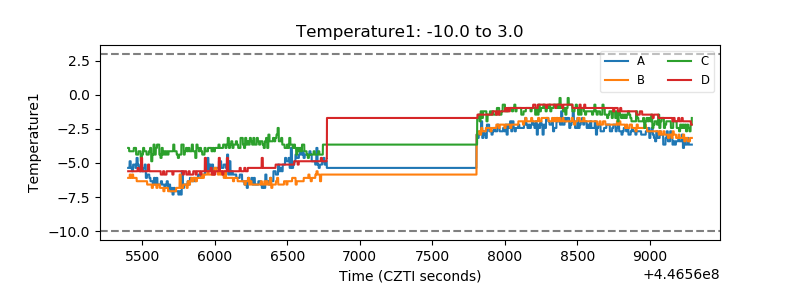 |
| Veto HV Monitor | 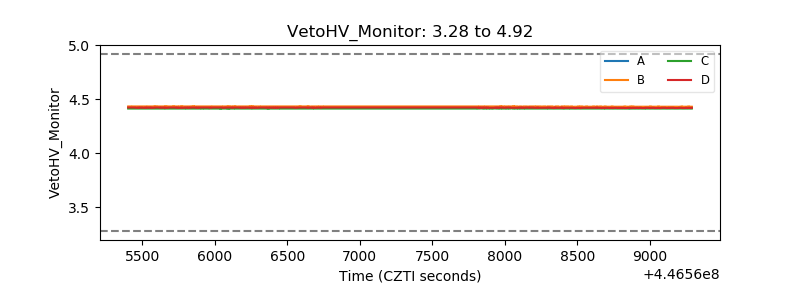 |
| Veto LLD | 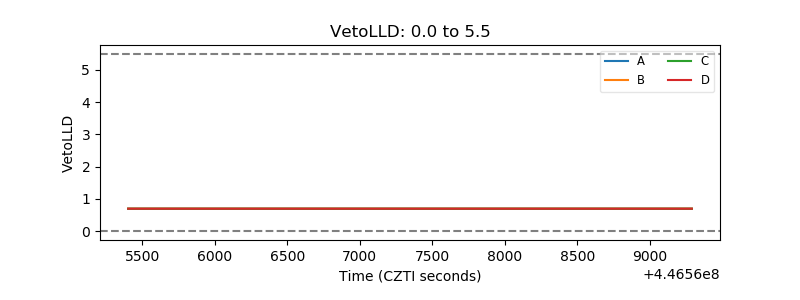 |
| Alpha Counter | 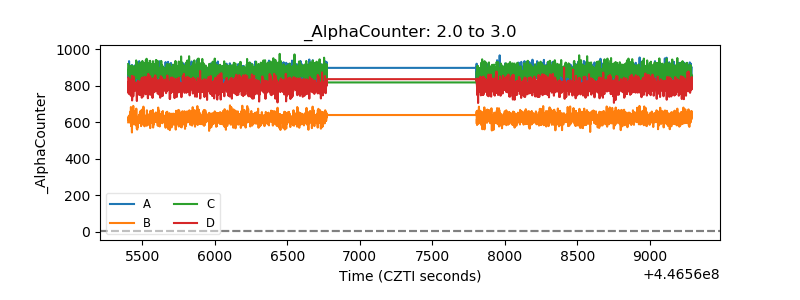 |
| _CPM_Rate | 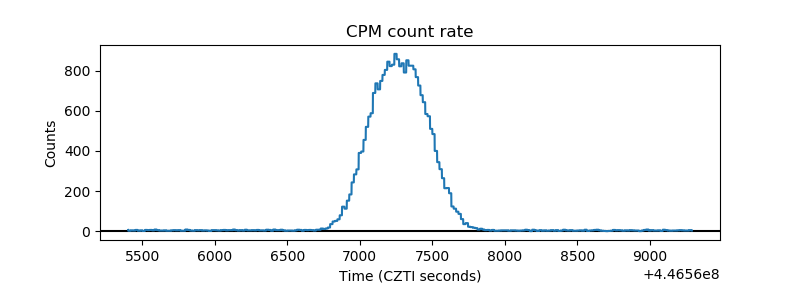 |
| CZT Counter | 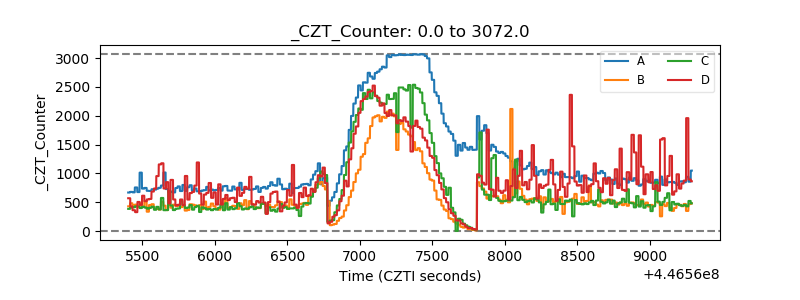 |
| +2.5 Volts monitor | 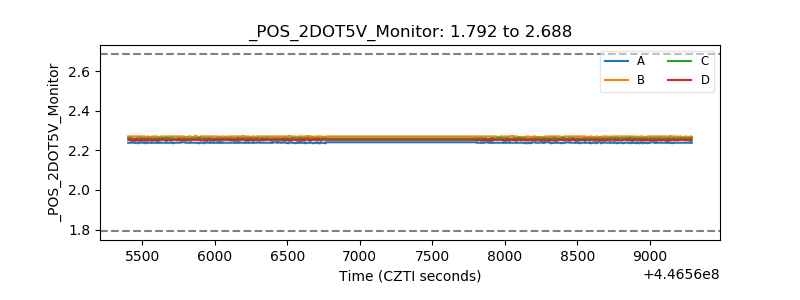 |
| +5 Volts monitor | 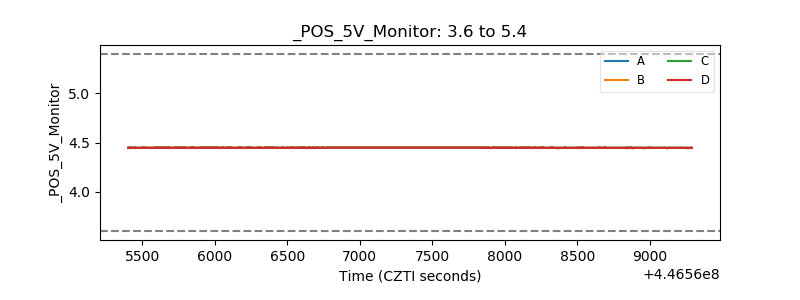 |
| _ROLL_ROT | 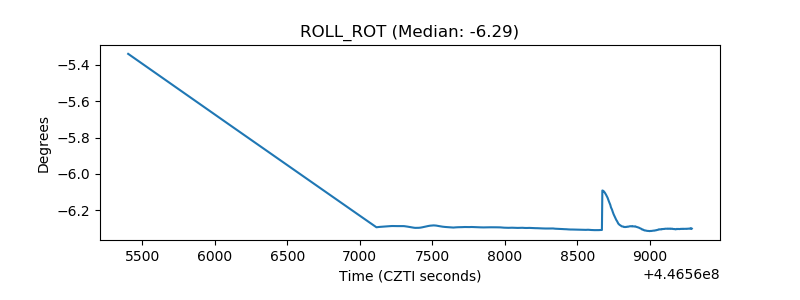 |
| _Roll_DEC | 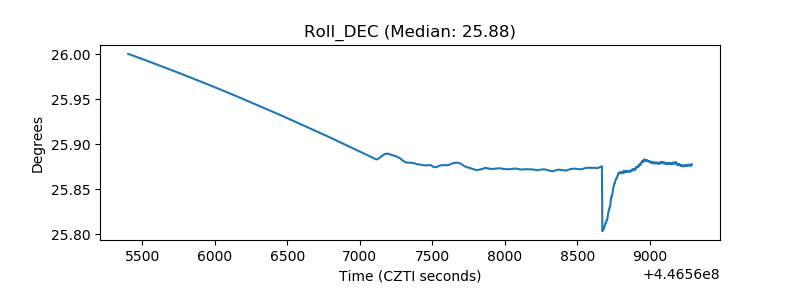 |
| _Roll_RA | 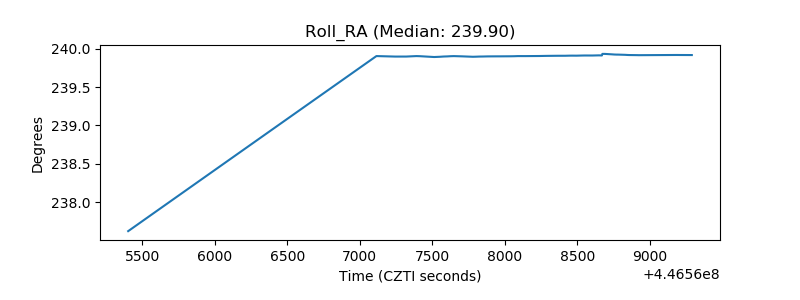 |
| Veto Counter | 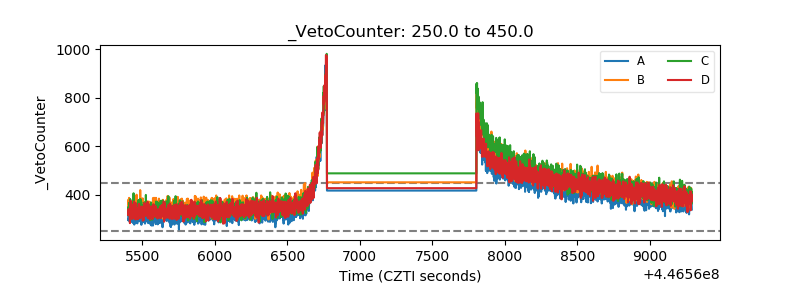 |