| Param | Original file | Final file |
|---|---|---|
| Filename | modeM0/AS1A13_054T01_9000006098_45488cztM0_level2.fits | modeM0/AS1A13_054T01_9000006098_45488cztM0_level2_quad_clean.evt |
| Size (bytes) | 497,090,880 | 108,538,560 |
| Size | 474.1 MB | 103.5 MB |
| Events in quadrant A | 5,397,707 | 730,796 |
| Events in quadrant B | 3,294,860 | 765,022 |
| Events in quadrant C | 3,109,597 | 736,036 |
| Events in quadrant D | 6,124,176 | 627,438 |
| Mode M0 | |||
|---|---|---|---|
| Quadrant | BADHDUFLAG | Total packets | Discarded packets |
| A | 0 | 20470 | 1 |
| B | 0 | 13702 | 1 |
| C | 0 | 13230 | 2 |
| D | 0 | 22493 | 1 |
| Mode SS | |||
|---|---|---|---|
| Quadrant | BADHDUFLAG | Total packets | Discarded packets |
| A | 0 | 126 | 0 |
| B | 0 | 126 | 0 |
| C | 0 | 126 | 0 |
| D | 0 | 126 | 0 |
| Mode M9 | |||
|---|---|---|---|
| Quadrant | BADHDUFLAG | Total packets | Discarded packets |
| A | 0 | 12 | 0 |
| B | 0 | 12 | 0 |
| C | 0 | 12 | 0 |
| D | 0 | 12 | 0 |
| Quadrant | Total seconds | Saturated seconds | Saturation percentage |
|---|---|---|---|
| A | 6118 | 177 | 2.893102% |
| B | 6118 | 130 | 2.124877% |
| C | 6117 | 57 | 0.931829% |
| D | 6118 | 527 | 8.613926% |
Noise dominated data is calculated using 1-second bins in cleaned event files. If a bin has >2000 counts, and if more than 50% of those come from <1% of pixels, then it is considered to be noise-dominated and hence unusable.
| Quadrant | # 1 sec bins | Bins with >0 counts | Bins with >2000 counts | High rate bins dominated by noise | Noise dominated (total time) | Noise dominated (detector-on time) | Marked lightcurve |
|---|---|---|---|---|---|---|---|
| A | 7348 | 6119 | 17 | 17 | 0.23% | 0.28% | 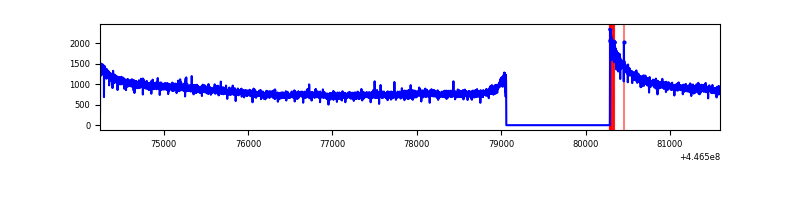 |
| B | 7348 | 6119 | 44 | 44 | 0.60% | 0.72% | 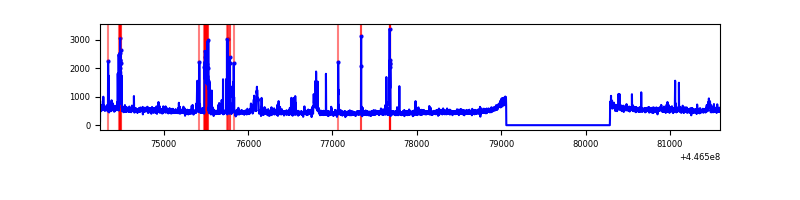 |
| C | 7347 | 6118 | 26 | 26 | 0.35% | 0.42% | 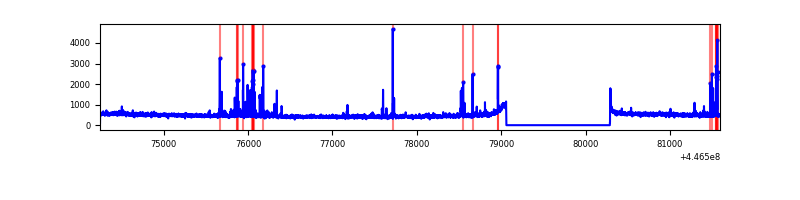 |
| D | 7348 | 6119 | 425 | 425 | 5.78% | 6.95% | 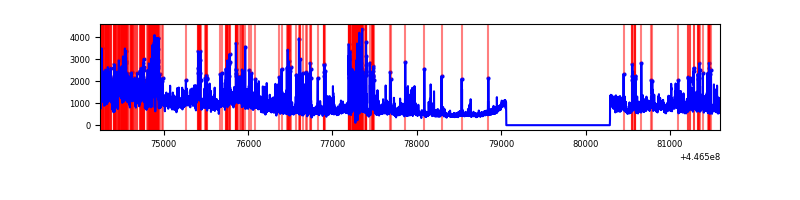 |
Top three noisy pixels from each quadrant. If the there are fewer than three noisy pixels in the level2.evt file, extra rows are filled as -1
| Pixel properties | Quadrant properties | ||||||
|---|---|---|---|---|---|---|---|
| Quadrant | DetID | PixID | Counts | Sigma | Mean | Median | Sigma |
| A | 10 | 83 | 2524854 | 16636.37 | 738 | 724 | 151.7 |
| A | 0 | 243 | 12370 | 76.76 | 738 | 724 | 151.7 |
| A | 3 | 137 | 8144 | 48.9 | 738 | 724 | 151.7 |
| B | 15 | 201 | 263835 | 1806.97 | 742 | 723 | 145.6 |
| B | 5 | 172 | 35511 | 238.91 | 742 | 723 | 145.6 |
| B | 12 | 111 | 17599 | 115.9 | 742 | 723 | 145.6 |
| C | 14 | 254 | 194636 | 1129.02 | 733 | 738 | 171.7 |
| C | 2 | 14 | 33473 | 190.61 | 733 | 738 | 171.7 |
| C | 3 | 233 | 16948 | 94.39 | 733 | 738 | 171.7 |
| D | 11 | 241 | 1572283 | 8801.92 | 708 | 690 | 178.6 |
| D | 1 | 52 | 705142 | 3945.38 | 708 | 690 | 178.6 |
| D | 2 | 249 | 457845 | 2560.36 | 708 | 690 | 178.6 |
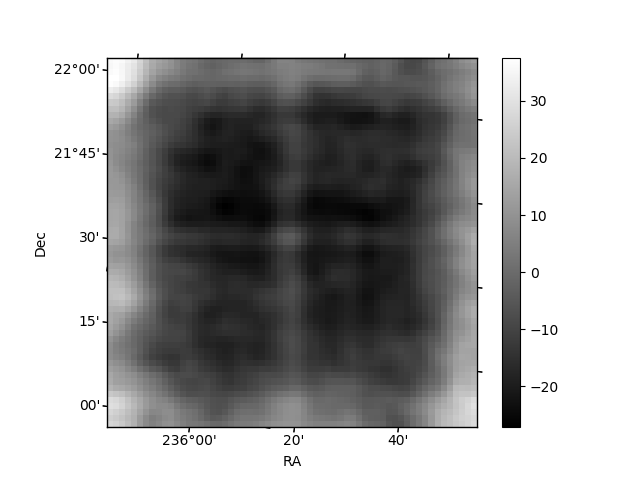
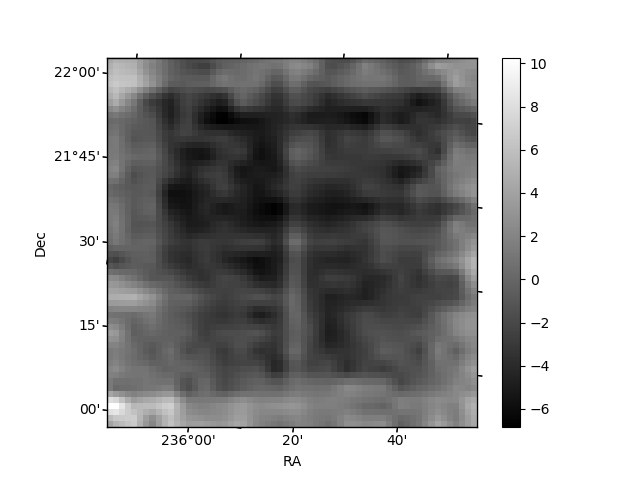
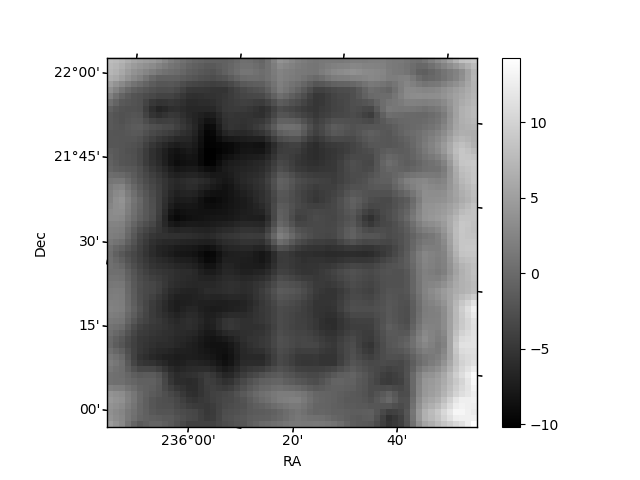
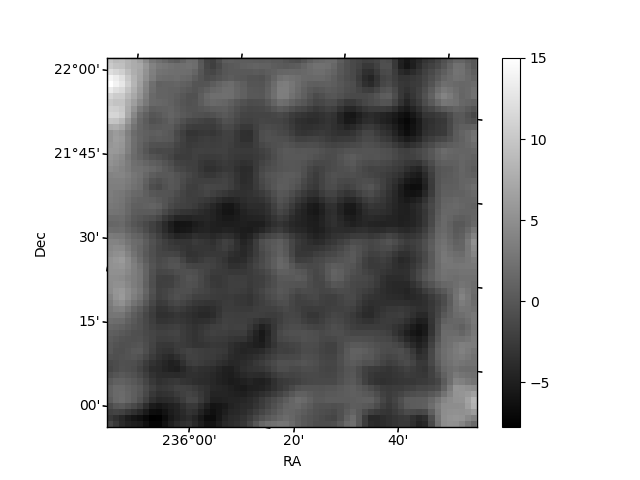
Histogram calculated using DETX and DETY for each event in the final _common_clean file
| Quadrant A | 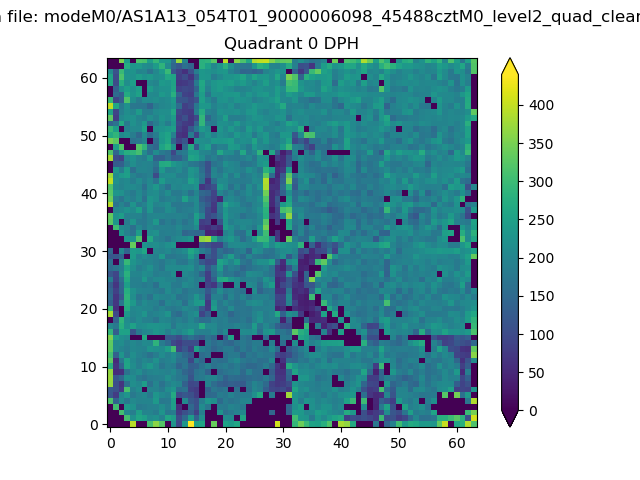 |
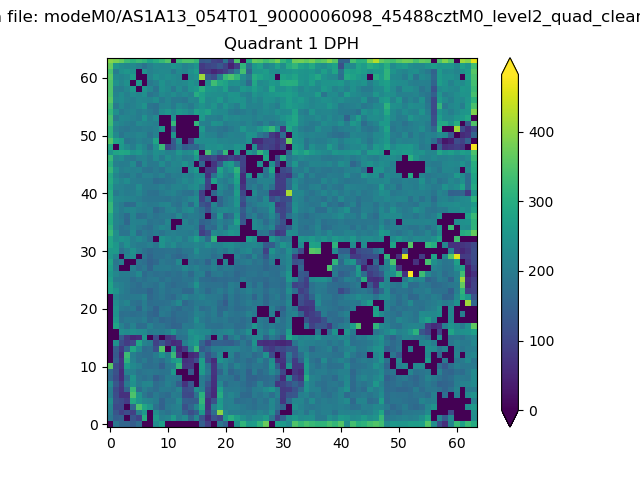 |
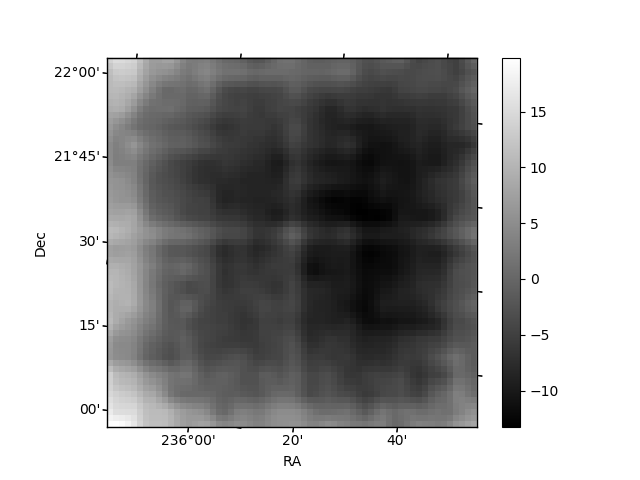
Quadrant B |
|---|---|---|---|
| Quadrant D | 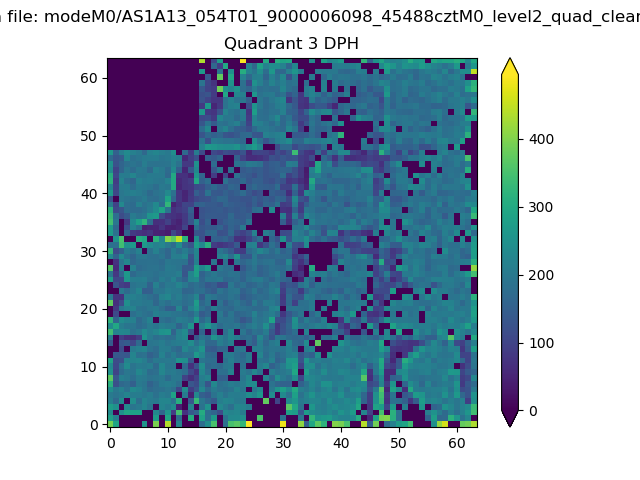 |
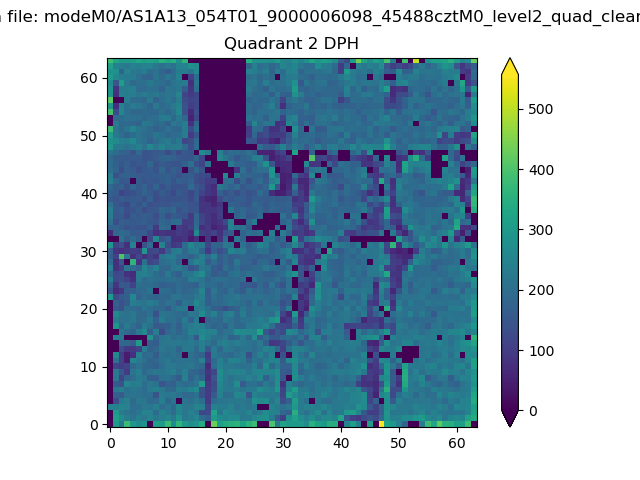 |
Quadrant C |
| Plot type | Count rate plots | Images |
|---|---|---|
| Comparison with Poisson distribution Blue bars denote a histogram of data divided into 1 sec bins. Red curve is a Poisson curve with rate = median count rate of data. |
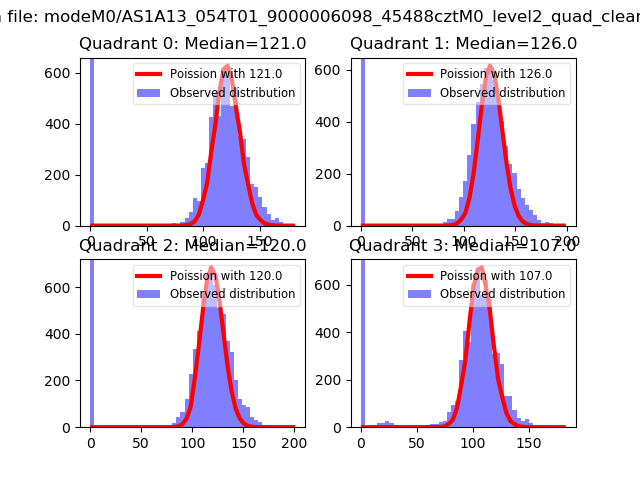 |
 |
| Quadrant-wise count rates Data is divided into 100 sec bins |
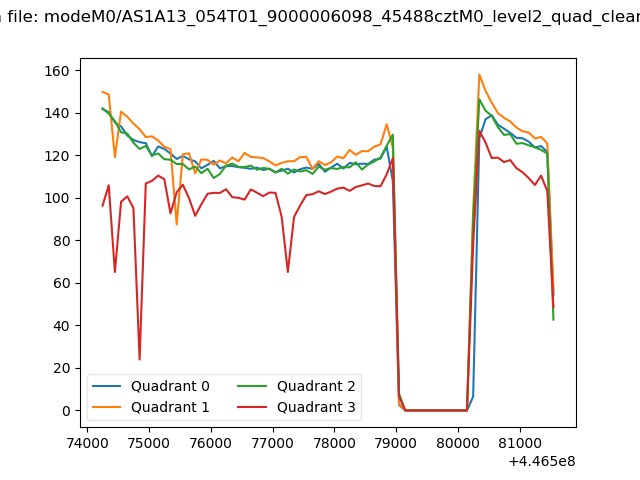 |
|
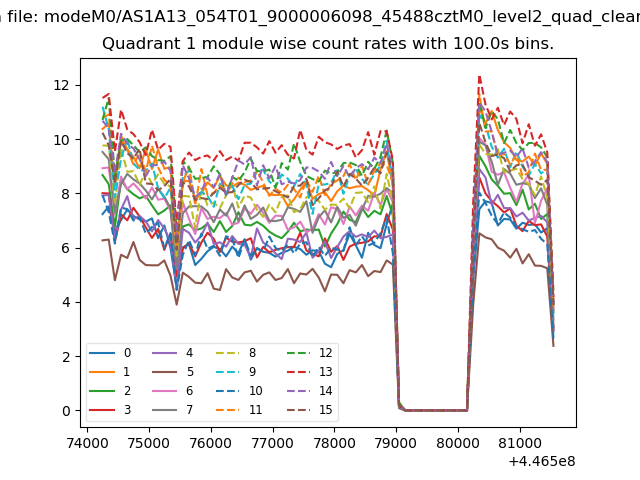
| Module-wise count rates for Quadrant A Data is divided into 100 sec bins |
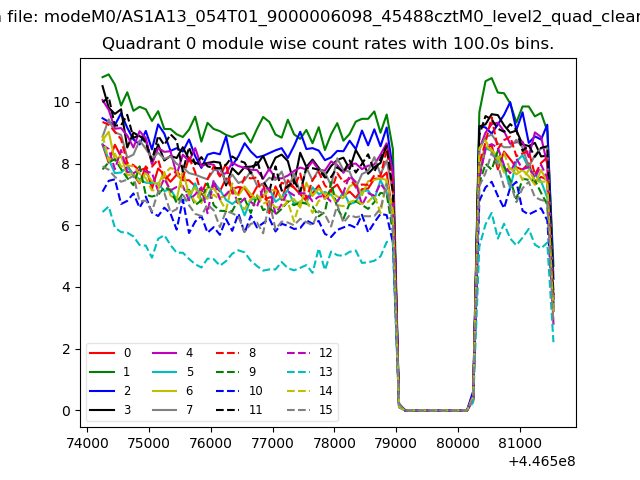 |
 |
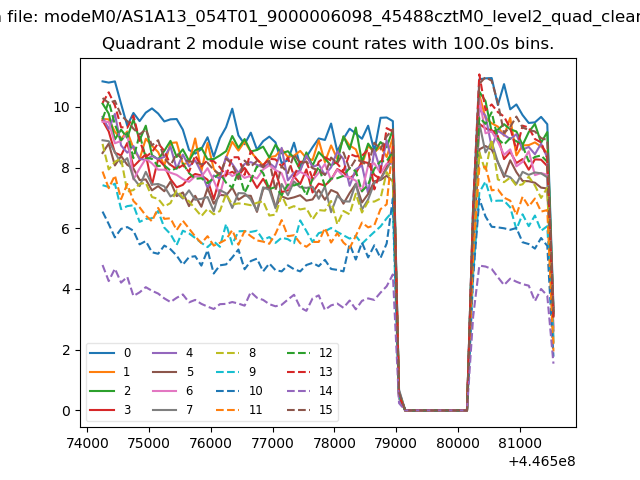
| Module-wise count rates for Quadrant B Data is divided into 100 sec bins |
 |
 |
| Module-wise count rates for Quadrant C Data is divided into 100 sec bins |
 |
 |
| Module-wise count rates for Quadrant D Data is divided into 100 sec bins |
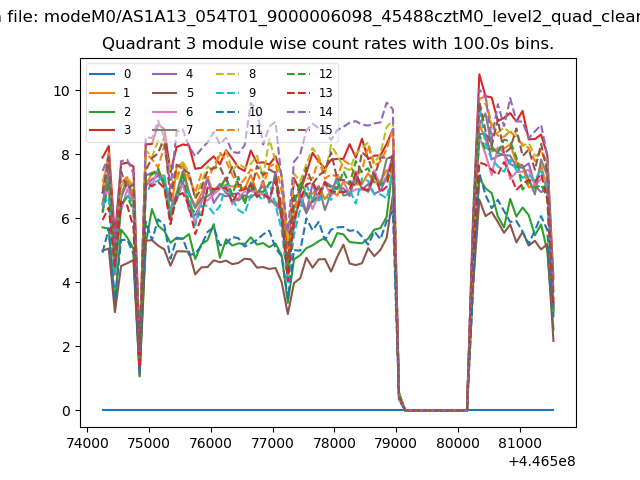 |
 |
| Parameter | Plot |
|---|---|
| CZT HV Monitor | 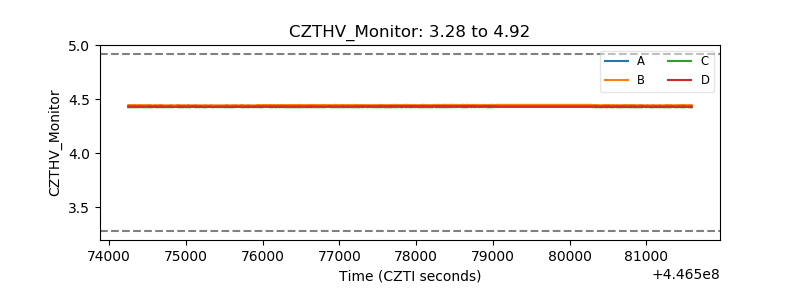 |
| D_VDD | 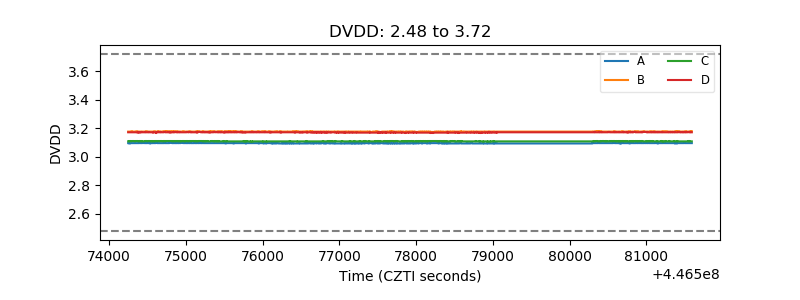 |
| Temperature 1 | 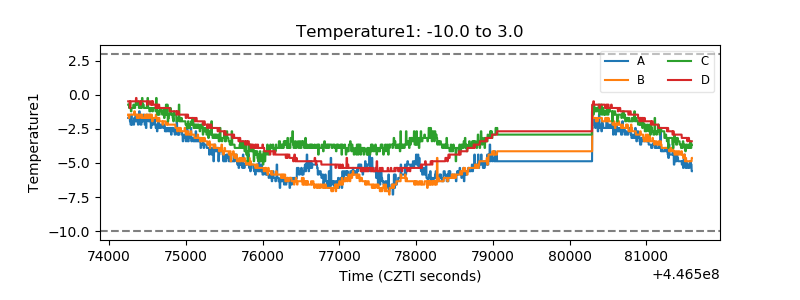 |
| Veto HV Monitor |  |
| Veto LLD | 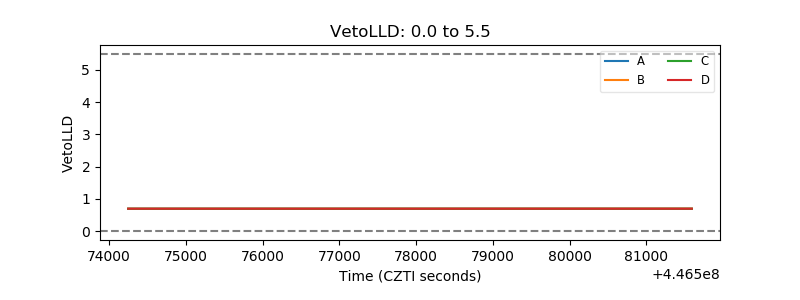 |
| Alpha Counter | 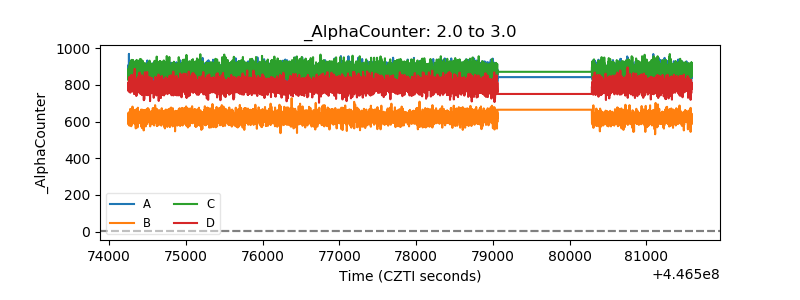 |
| _CPM_Rate | 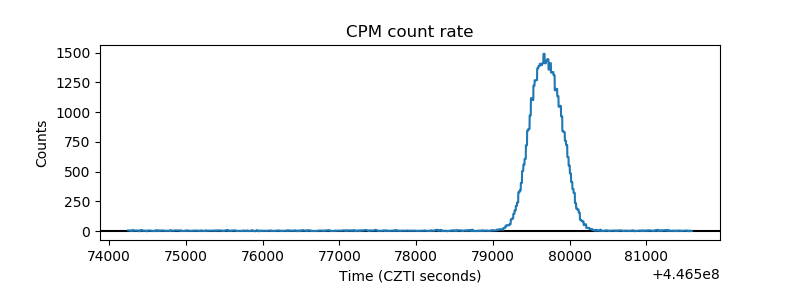 |
| CZT Counter | 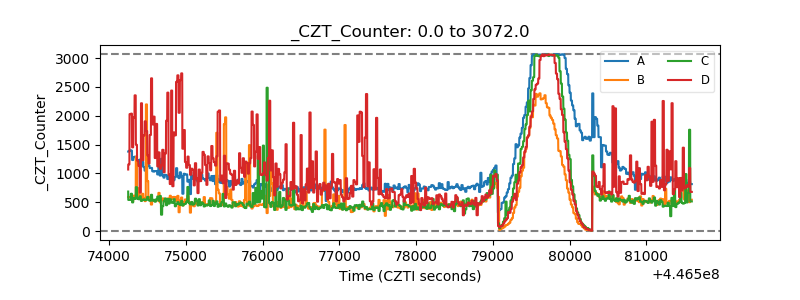 |
| +2.5 Volts monitor |  |
| +5 Volts monitor | 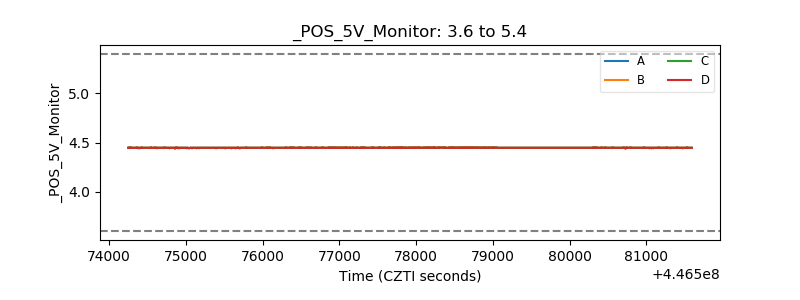 |
| _ROLL_ROT | 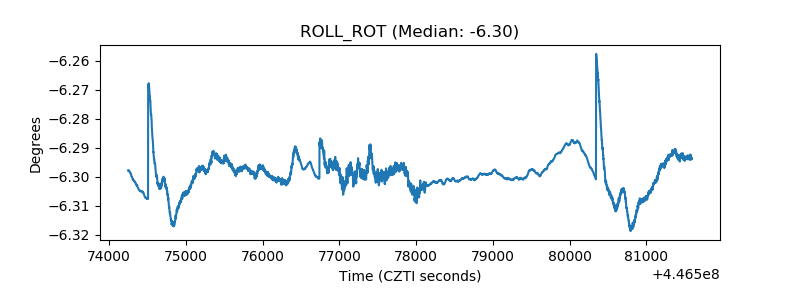 |
| _Roll_DEC | 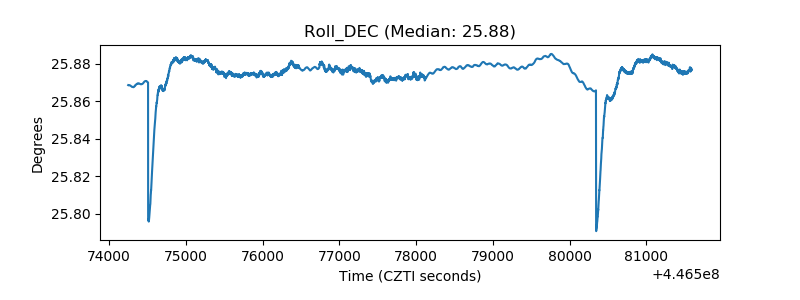 |
| _Roll_RA | 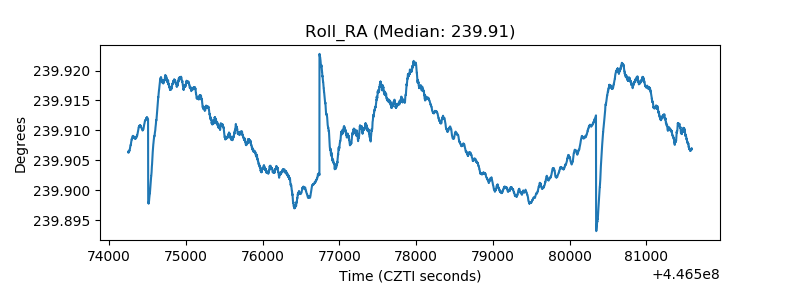 |
| Veto Counter | 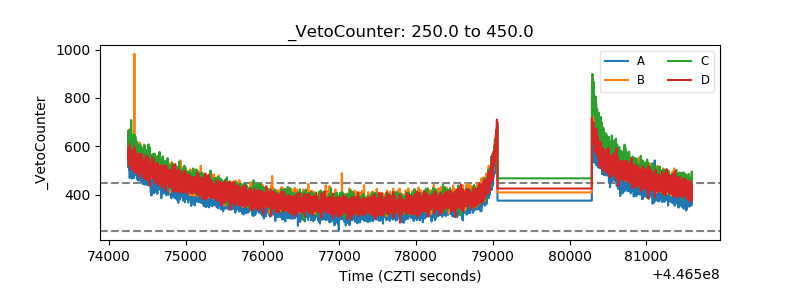 |