| Param | Original file | Final file |
|---|---|---|
| Filename | modeM0/AS1A13_054T01_9000006098_45489cztM0_level2.fits | modeM0/AS1A13_054T01_9000006098_45489cztM0_level2_quad_clean.evt |
| Size (bytes) | 528,166,080 | 108,881,280 |
| Size | 503.7 MB | 103.8 MB |
| Events in quadrant A | 5,720,654 | 733,702 |
| Events in quadrant B | 4,356,968 | 699,336 |
| Events in quadrant C | 3,318,735 | 752,632 |
| Events in quadrant D | 5,665,997 | 671,604 |
| Mode M0 | |||
|---|---|---|---|
| Quadrant | BADHDUFLAG | Total packets | Discarded packets |
| A | 0 | 21640 | 2 |
| B | 0 | 17093 | 2 |
| C | 0 | 14102 | 2 |
| D | 0 | 21407 | 2 |
| Mode SS | |||
|---|---|---|---|
| Quadrant | BADHDUFLAG | Total packets | Discarded packets |
| A | 0 | 128 | 0 |
| B | 0 | 128 | 0 |
| C | 0 | 128 | 0 |
| D | 0 | 128 | 0 |
| Mode M9 | |||
|---|---|---|---|
| Quadrant | BADHDUFLAG | Total packets | Discarded packets |
| A | 0 | 20 | 0 |
| B | 0 | 21 | 0 |
| C | 0 | 21 | 0 |
| D | 0 | 21 | 0 |
| Quadrant | Total seconds | Saturated seconds | Saturation percentage |
|---|---|---|---|
| A | 6303 | 302 | 4.791369% |
| B | 6302 | 760 | 12.059664% |
| C | 6302 | 110 | 1.745478% |
| D | 6302 | 274 | 4.347826% |
Noise dominated data is calculated using 1-second bins in cleaned event files. If a bin has >2000 counts, and if more than 50% of those come from <1% of pixels, then it is considered to be noise-dominated and hence unusable.
| Quadrant | # 1 sec bins | Bins with >0 counts | Bins with >2000 counts | High rate bins dominated by noise | Noise dominated (total time) | Noise dominated (detector-on time) | Marked lightcurve |
|---|---|---|---|---|---|---|---|
| A | 7523 | 6304 | 53 | 53 | 0.70% | 0.84% | 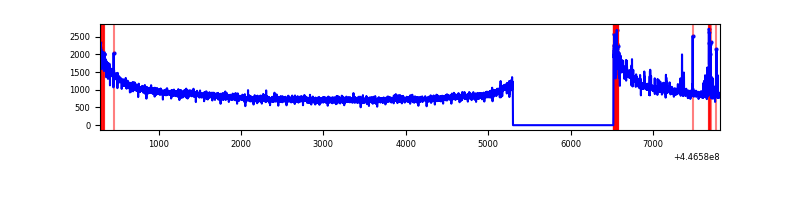 |
| B | 7522 | 6303 | 355 | 355 | 4.72% | 5.63% | 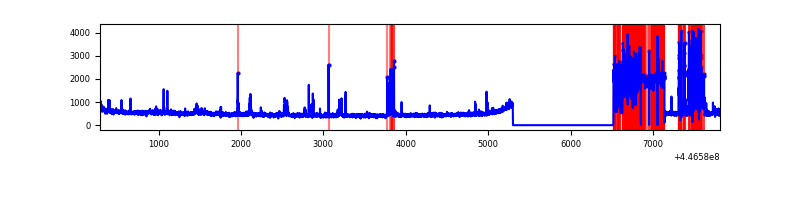 |
| C | 7522 | 6303 | 56 | 56 | 0.74% | 0.89% | 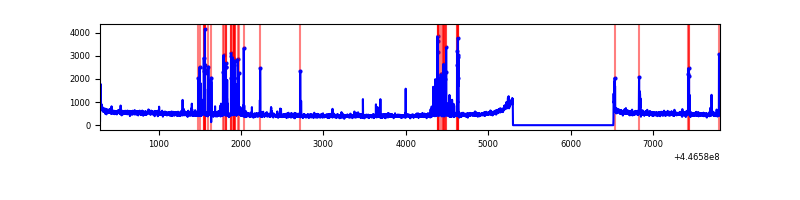 |
| D | 7522 | 6303 | 185 | 185 | 2.46% | 2.94% | 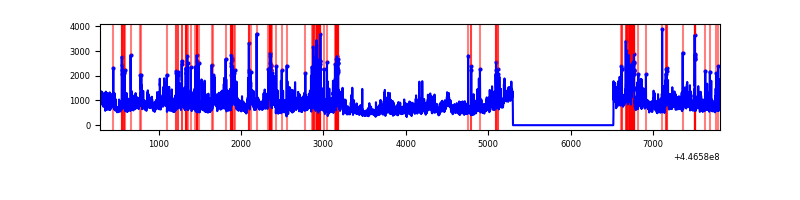 |
Top three noisy pixels from each quadrant. If the there are fewer than three noisy pixels in the level2.evt file, extra rows are filled as -1
| Pixel properties | Quadrant properties | ||||||
|---|---|---|---|---|---|---|---|
| Quadrant | DetID | PixID | Counts | Sigma | Mean | Median | Sigma |
| A | 10 | 83 | 2672476 | 17154.69 | 754 | 740 | 155.7 |
| A | 13 | 248 | 53726 | 340.21 | 754 | 740 | 155.7 |
| A | 9 | 191 | 33676 | 211.48 | 754 | 740 | 155.7 |
| B | 15 | 201 | 1453662 | 10674.49 | 699 | 681 | 136.1 |
| B | 5 | 172 | 60872 | 442.2 | 699 | 681 | 136.1 |
| B | 0 | 199 | 27417 | 196.42 | 699 | 681 | 136.1 |
| C | 14 | 254 | 328836 | 1842.42 | 754 | 758 | 178.1 |
| C | 2 | 14 | 31944 | 175.13 | 754 | 758 | 178.1 |
| C | 3 | 233 | 17149 | 92.05 | 754 | 758 | 178.1 |
| D | 11 | 241 | 1784884 | 9498.14 | 744 | 723 | 187.8 |
| D | 1 | 52 | 432488 | 2298.54 | 744 | 723 | 187.8 |
| D | 5 | 222 | 134289 | 711.05 | 744 | 723 | 187.8 |
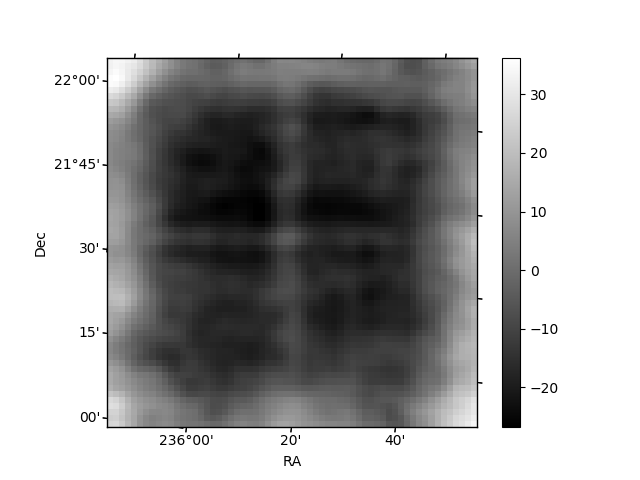
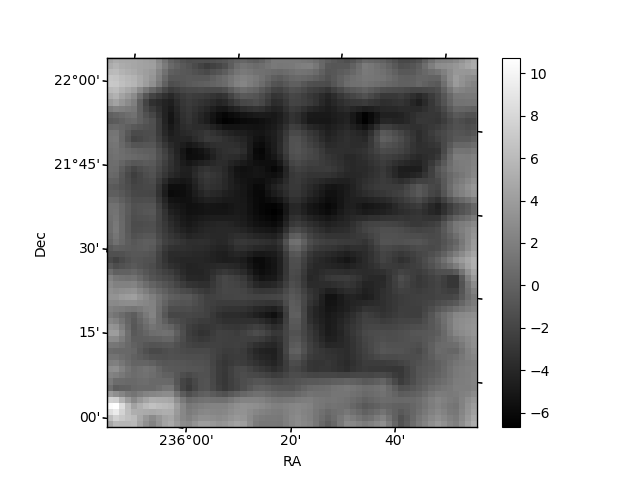
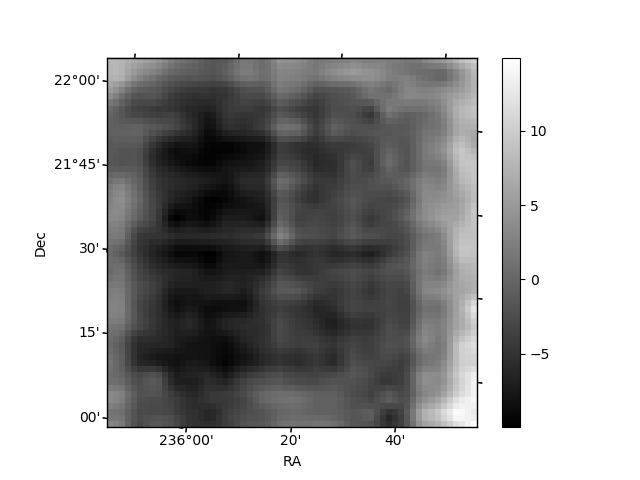
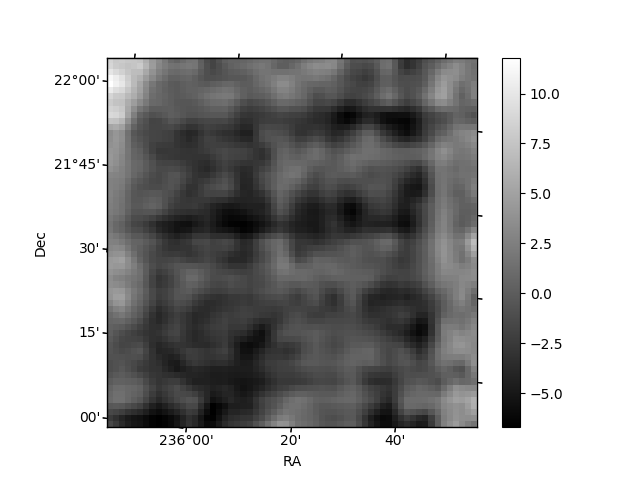
Histogram calculated using DETX and DETY for each event in the final _common_clean file
| Quadrant A | 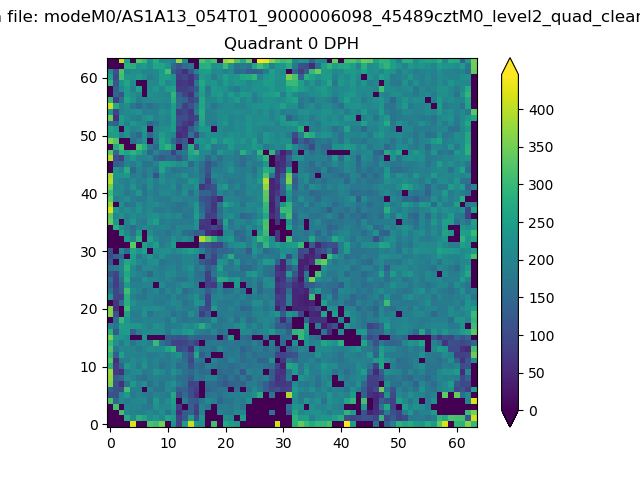 |
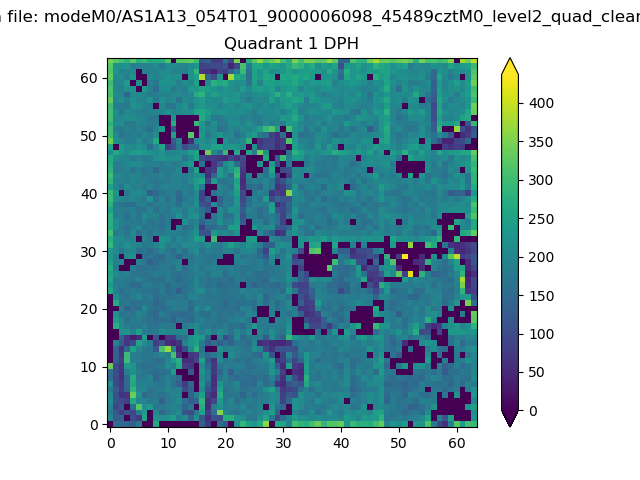 |
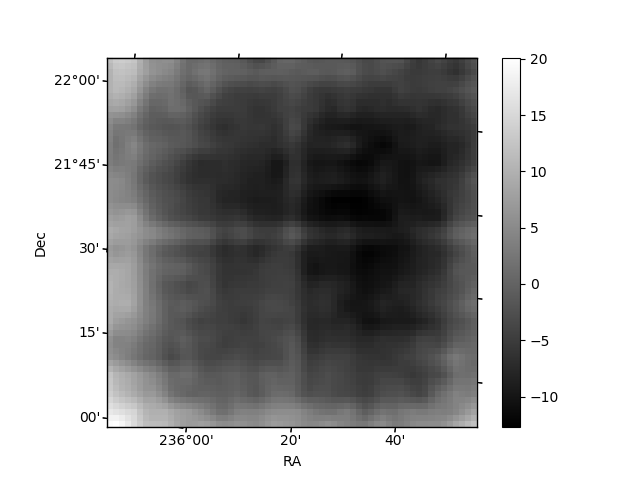
Quadrant B |
|---|---|---|---|
| Quadrant D | 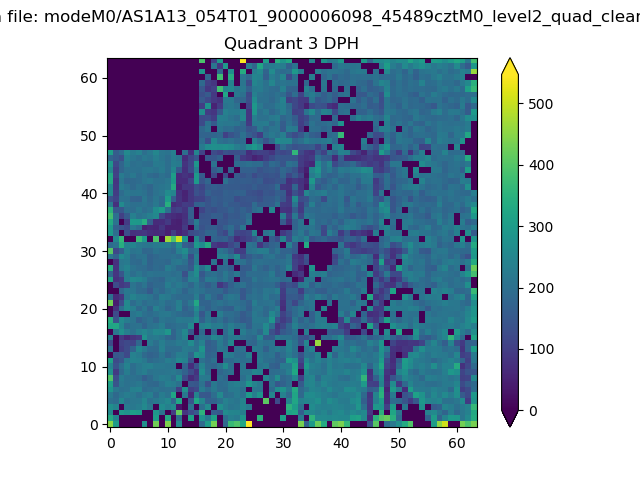 |
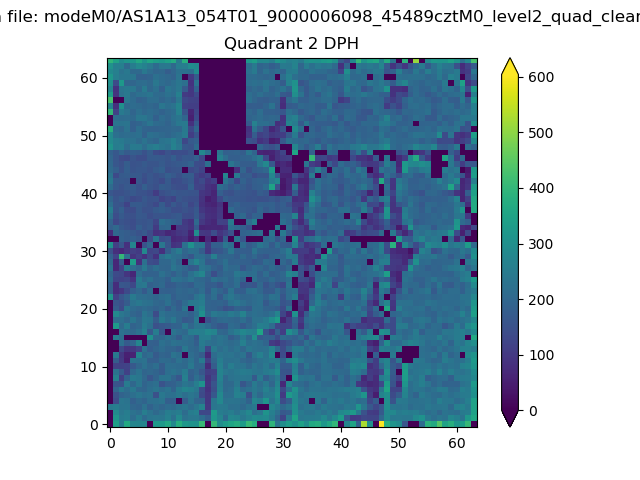 |
Quadrant C |
| Plot type | Count rate plots | Images |
|---|---|---|
| Comparison with Poisson distribution Blue bars denote a histogram of data divided into 1 sec bins. Red curve is a Poisson curve with rate = median count rate of data. |
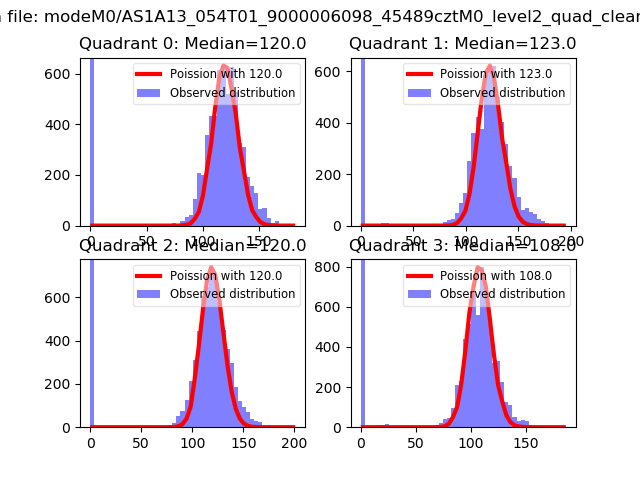 |
 |
| Quadrant-wise count rates Data is divided into 100 sec bins |
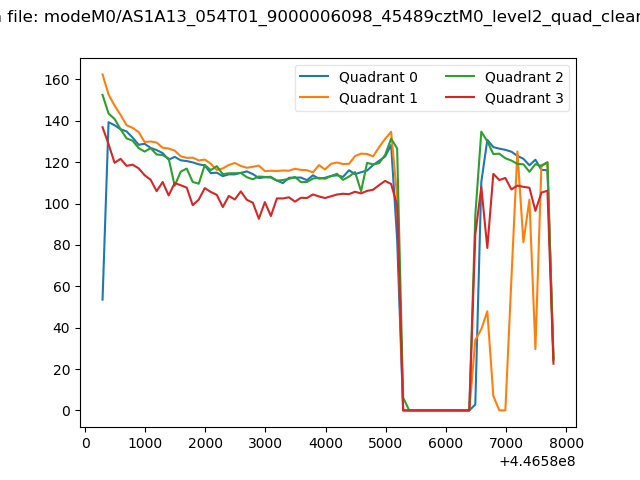 |
|
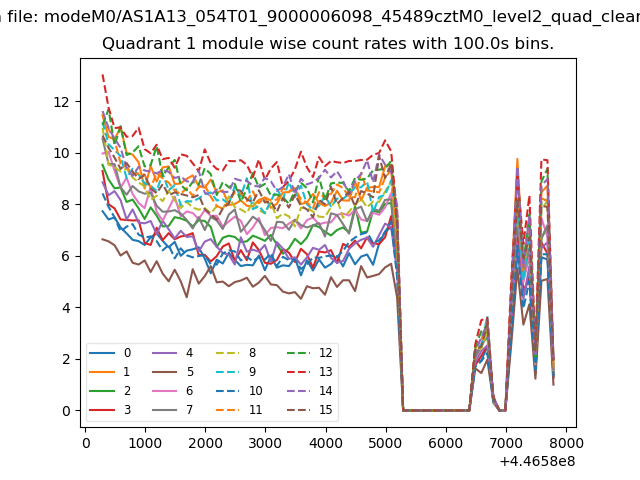
| Module-wise count rates for Quadrant A Data is divided into 100 sec bins |
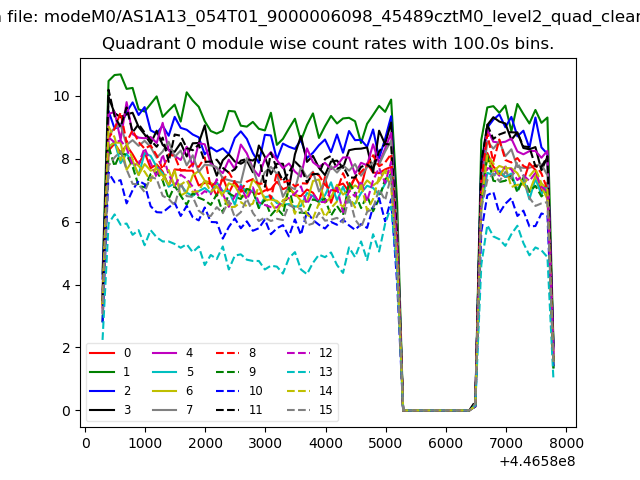 |
 |
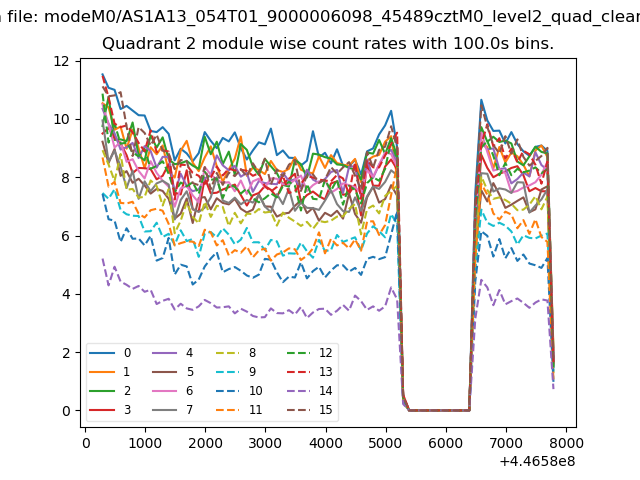
| Module-wise count rates for Quadrant B Data is divided into 100 sec bins |
 |
 |
| Module-wise count rates for Quadrant C Data is divided into 100 sec bins |
 |
 |
| Module-wise count rates for Quadrant D Data is divided into 100 sec bins |
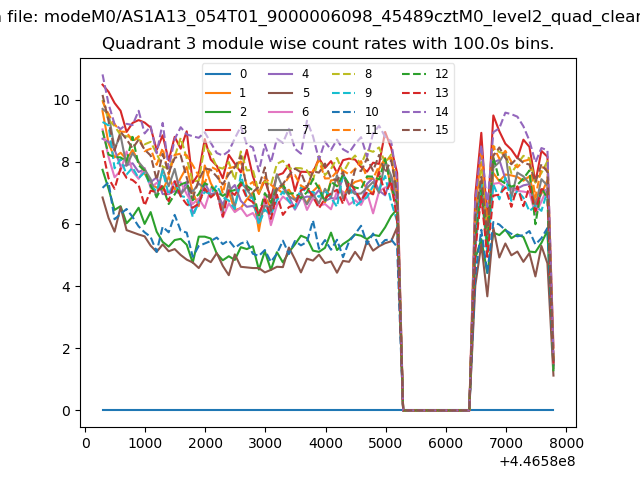 |
 |
| Parameter | Plot |
|---|---|
| CZT HV Monitor | 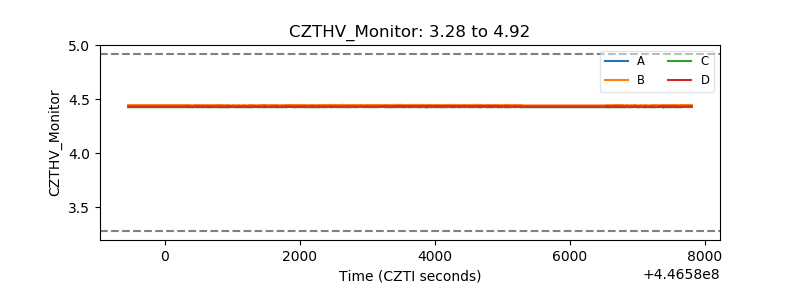 |
| D_VDD | 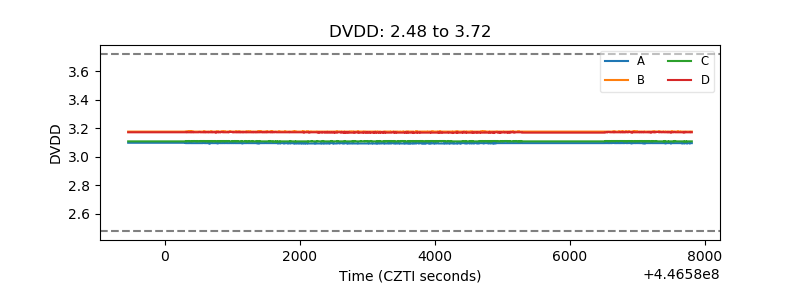 |
| Temperature 1 | 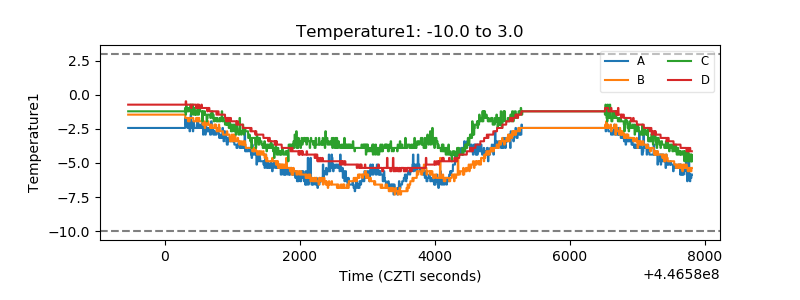 |
| Veto HV Monitor | 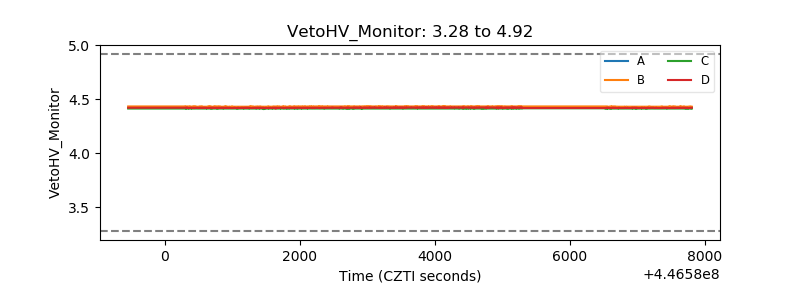 |
| Veto LLD | 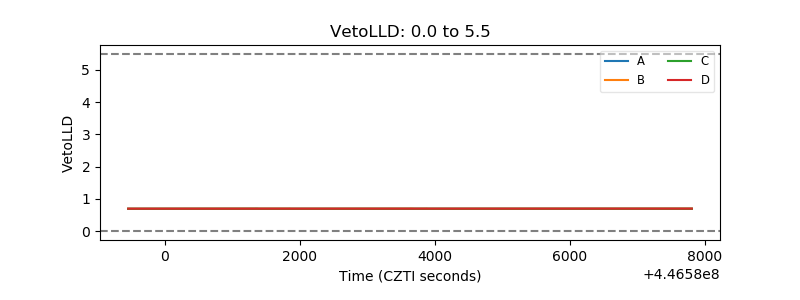 |
| Alpha Counter | 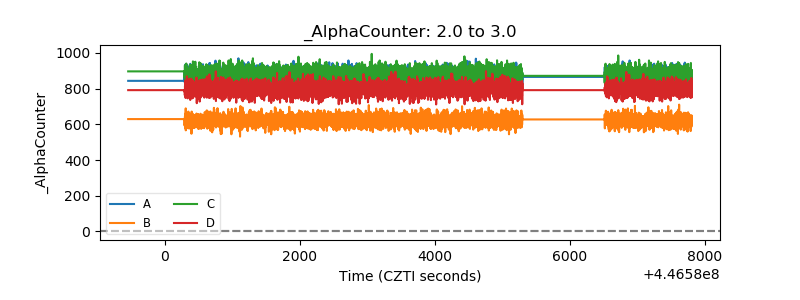 |
| _CPM_Rate | 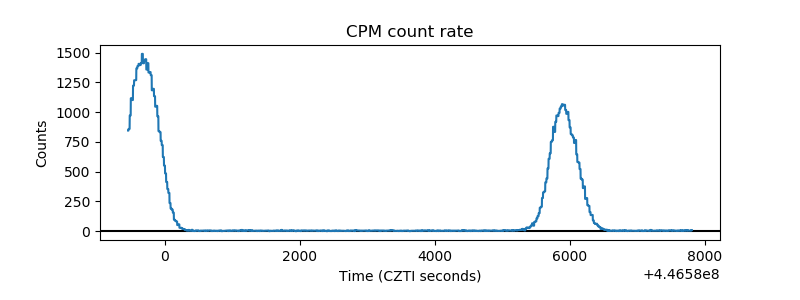 |
| CZT Counter | 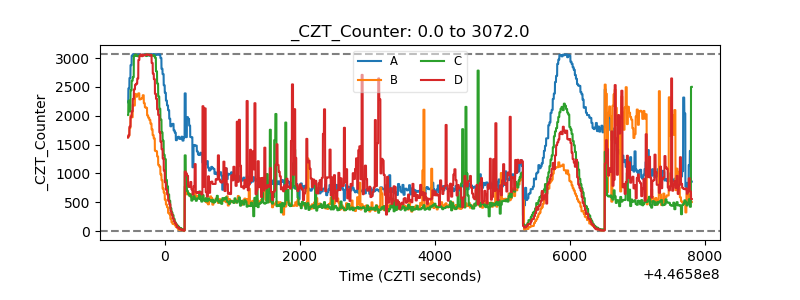 |
| +2.5 Volts monitor | 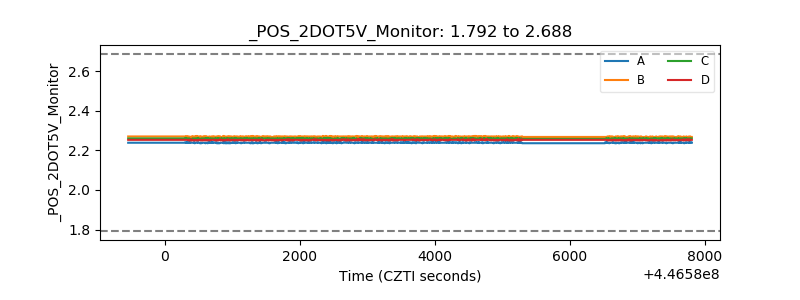 |
| +5 Volts monitor | 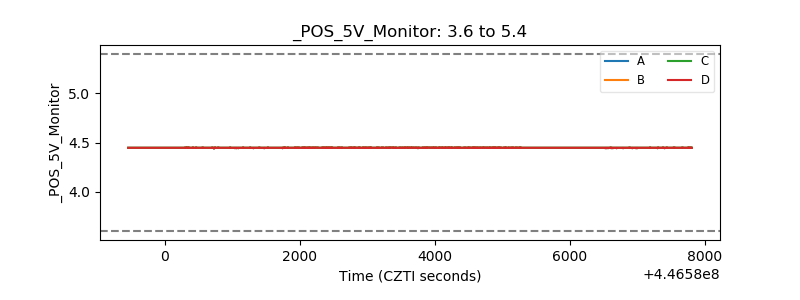 |
| _ROLL_ROT | 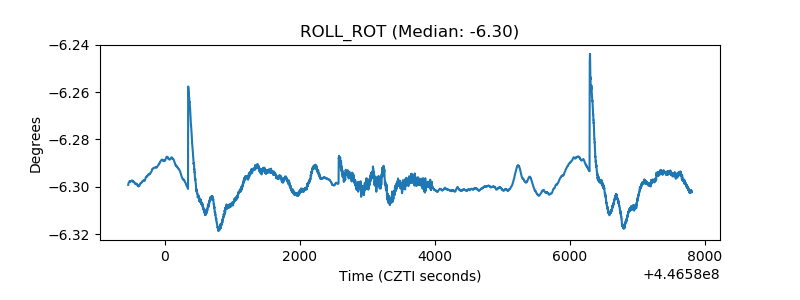 |
| _Roll_DEC | 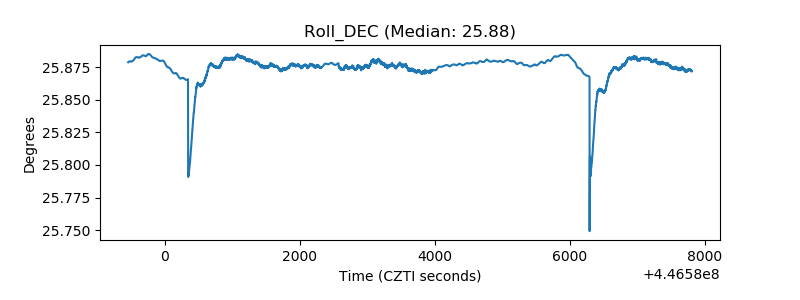 |
| _Roll_RA | 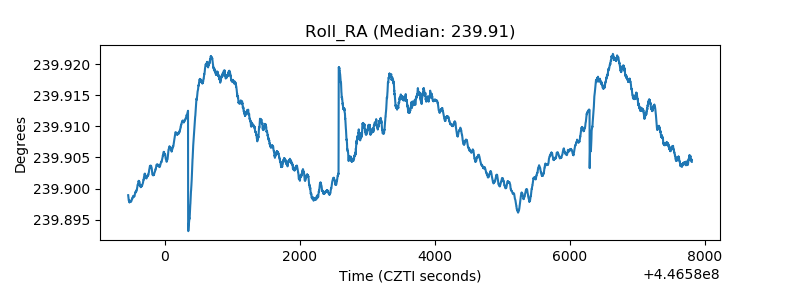 |
| Veto Counter | 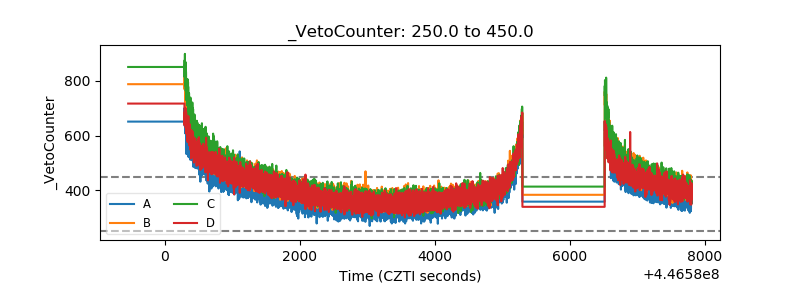 |