| Param | Original file | Final file |
|---|---|---|
| Filename | modeM0/AS1A13_054T01_9000006098_45490cztM0_level2.fits | modeM0/AS1A13_054T01_9000006098_45490cztM0_level2_quad_clean.evt |
| Size (bytes) | 535,426,560 | 106,632,000 |
| Size | 510.6 MB | 101.7 MB |
| Events in quadrant A | 5,569,588 | 724,967 |
| Events in quadrant B | 4,199,378 | 694,169 |
| Events in quadrant C | 3,614,857 | 724,345 |
| Events in quadrant D | 5,938,368 | 637,824 |
| Mode M0 | |||
|---|---|---|---|
| Quadrant | BADHDUFLAG | Total packets | Discarded packets |
| A | 0 | 21394 | 1 |
| B | 0 | 16934 | 1 |
| C | 0 | 15151 | 1 |
| D | 0 | 22175 | 1 |
| Mode SS | |||
|---|---|---|---|
| Quadrant | BADHDUFLAG | Total packets | Discarded packets |
| A | 0 | 130 | 0 |
| B | 0 | 130 | 0 |
| C | 0 | 130 | 0 |
| D | 0 | 130 | 0 |
| Mode M9 | |||
|---|---|---|---|
| Quadrant | BADHDUFLAG | Total packets | Discarded packets |
| A | 0 | 11 | 0 |
| B | 0 | 11 | 0 |
| C | 0 | 11 | 0 |
| D | 0 | 11 | 0 |
| Quadrant | Total seconds | Saturated seconds | Saturation percentage |
|---|---|---|---|
| A | 6415 | 218 | 3.398285% |
| B | 6415 | 693 | 10.802806% |
| C | 6415 | 216 | 3.367108% |
| D | 6416 | 463 | 7.216334% |
Noise dominated data is calculated using 1-second bins in cleaned event files. If a bin has >2000 counts, and if more than 50% of those come from <1% of pixels, then it is considered to be noise-dominated and hence unusable.
| Quadrant | # 1 sec bins | Bins with >0 counts | Bins with >2000 counts | High rate bins dominated by noise | Noise dominated (total time) | Noise dominated (detector-on time) | Marked lightcurve |
|---|---|---|---|---|---|---|---|
| A | 7515 | 6416 | 23 | 23 | 0.31% | 0.36% | 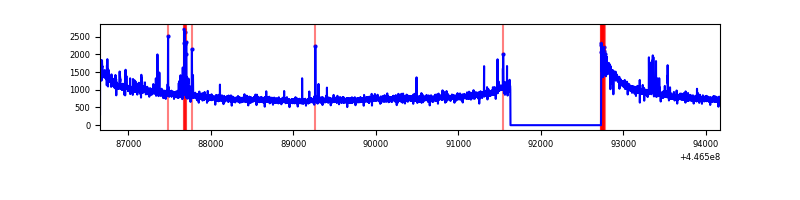 |
| B | 7515 | 6416 | 317 | 317 | 4.22% | 4.94% | 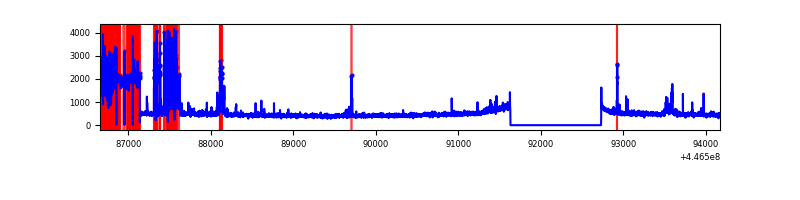 |
| C | 7515 | 6416 | 155 | 155 | 2.06% | 2.42% | 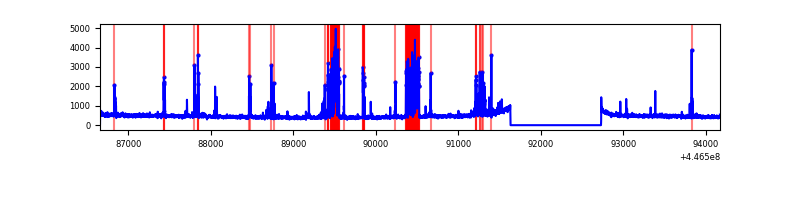 |
| D | 7516 | 6417 | 294 | 294 | 3.91% | 4.58% | 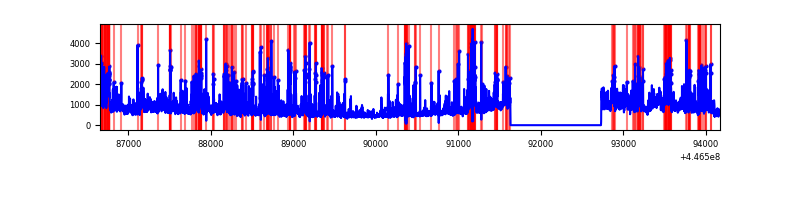 |
Top three noisy pixels from each quadrant. If the there are fewer than three noisy pixels in the level2.evt file, extra rows are filled as -1
| Pixel properties | Quadrant properties | ||||||
|---|---|---|---|---|---|---|---|
| Quadrant | DetID | PixID | Counts | Sigma | Mean | Median | Sigma |
| A | 10 | 83 | 2542868 | 16527.64 | 740 | 724 | 153.8 |
| A | 13 | 248 | 92687 | 597.89 | 740 | 724 | 153.8 |
| A | 9 | 191 | 23341 | 147.04 | 740 | 724 | 153.8 |
| B | 15 | 201 | 1308520 | 9597.77 | 697 | 677 | 136.3 |
| B | 12 | 18 | 37252 | 268.41 | 697 | 677 | 136.3 |
| B | 15 | 85 | 34084 | 245.16 | 697 | 677 | 136.3 |
| C | 14 | 254 | 663413 | 3816.66 | 738 | 743 | 173.6 |
| C | 2 | 14 | 57812 | 328.69 | 738 | 743 | 173.6 |
| C | 13 | 61 | 4791 | 23.31 | 738 | 743 | 173.6 |
| D | 11 | 241 | 1407952 | 7799.16 | 716 | 696 | 180.4 |
| D | 1 | 52 | 891903 | 4939.16 | 716 | 696 | 180.4 |
| D | 5 | 222 | 368296 | 2037.27 | 716 | 696 | 180.4 |
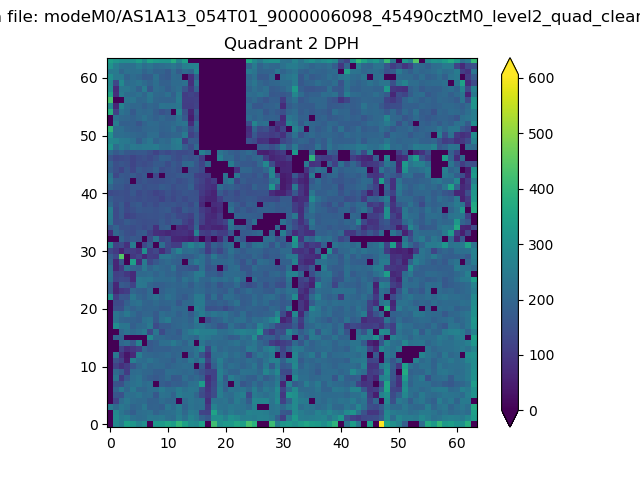
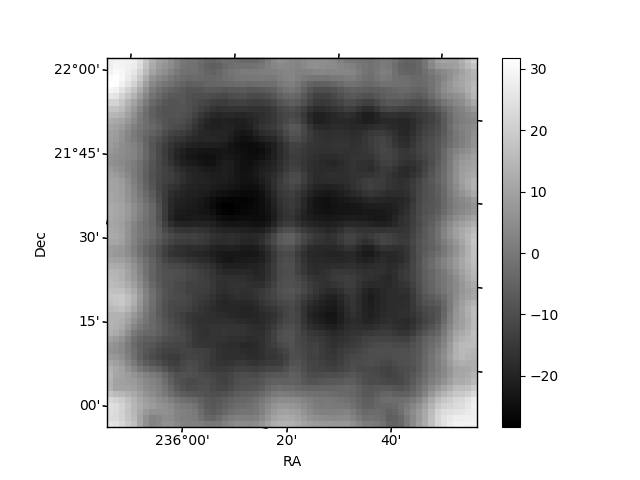
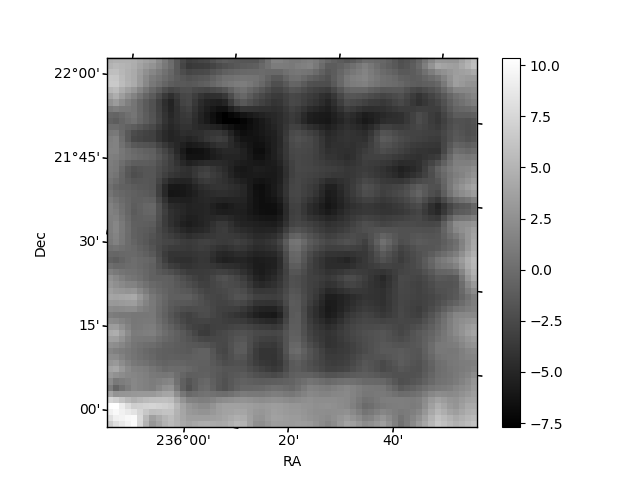
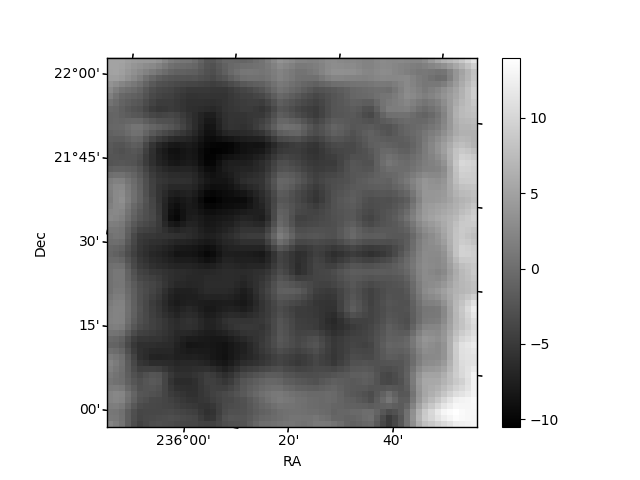
Histogram calculated using DETX and DETY for each event in the final _common_clean file
| Quadrant A | 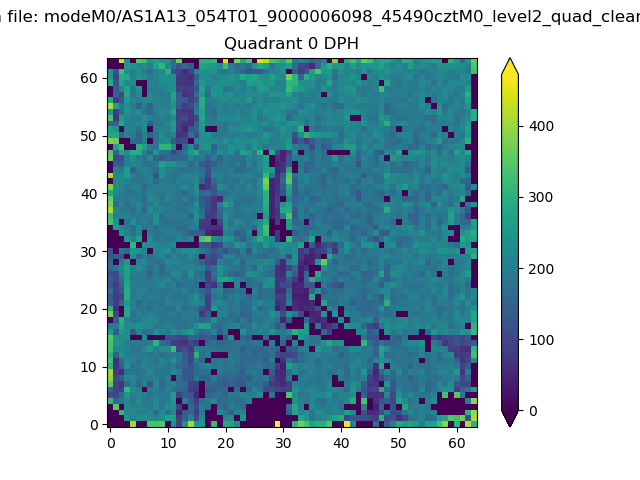 |
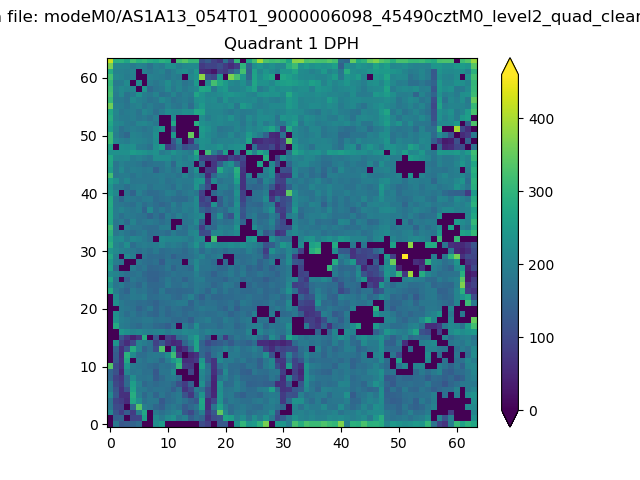 |
Quadrant B |
|---|---|---|---|
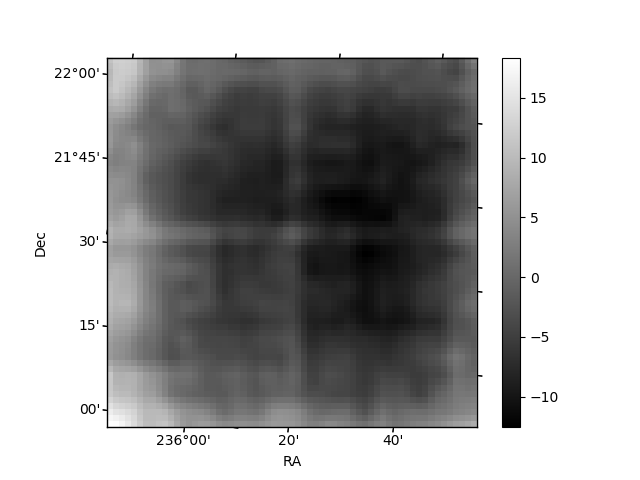
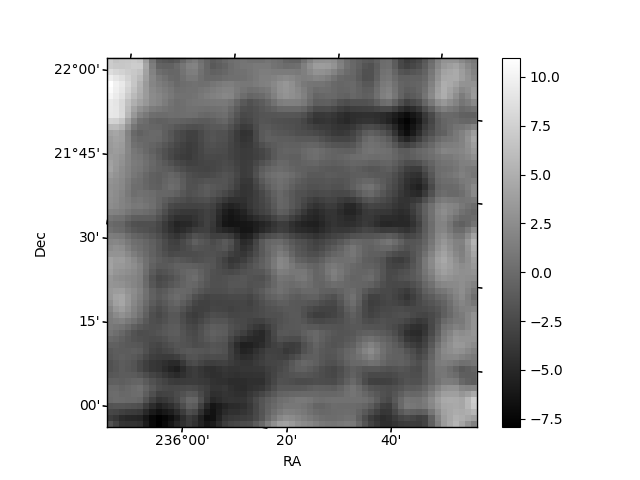
| Quadrant D | 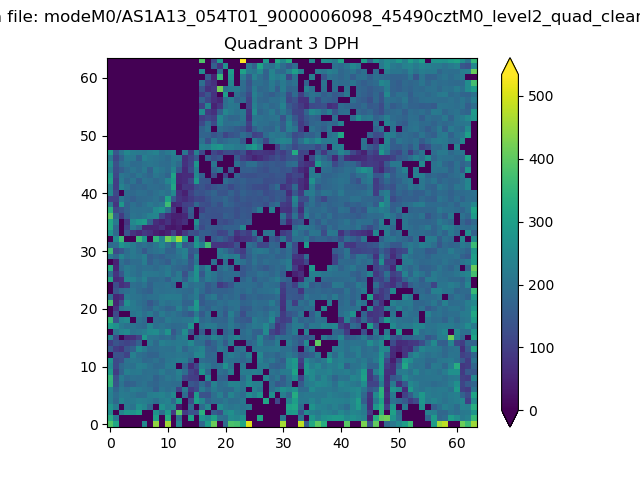 |
 |
Quadrant C |
| Plot type | Count rate plots | Images |
|---|---|---|
| Comparison with Poisson distribution Blue bars denote a histogram of data divided into 1 sec bins. Red curve is a Poisson curve with rate = median count rate of data. |
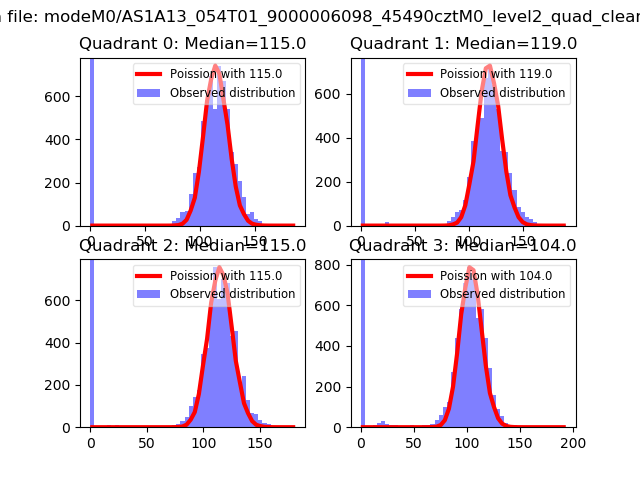 |
 |
| Quadrant-wise count rates Data is divided into 100 sec bins |
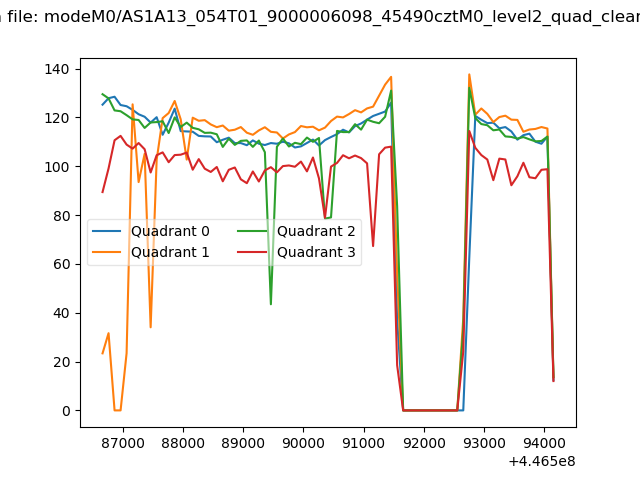 |
|
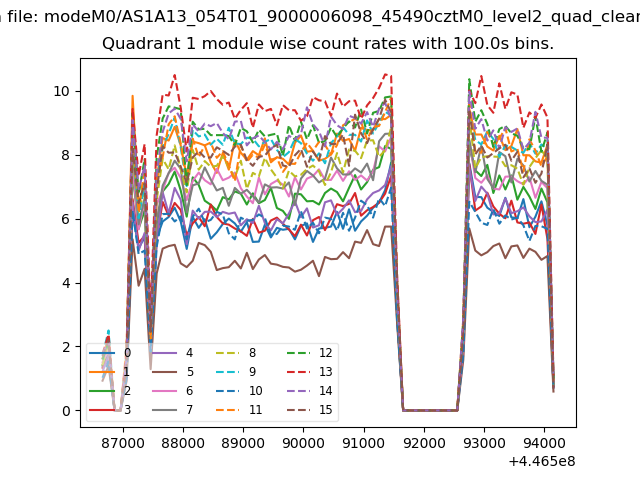
| Module-wise count rates for Quadrant A Data is divided into 100 sec bins |
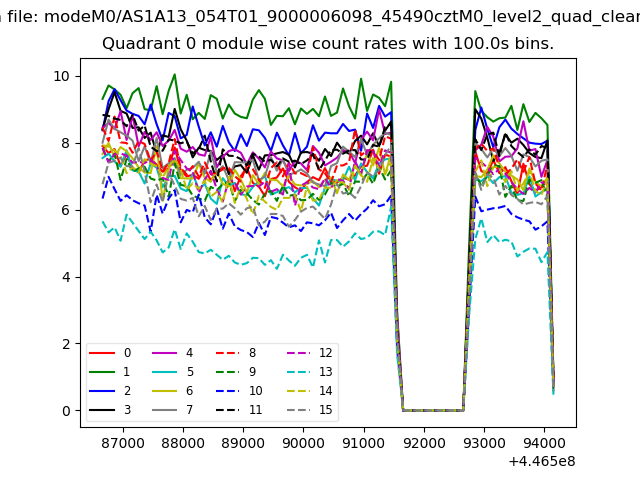 |
 |
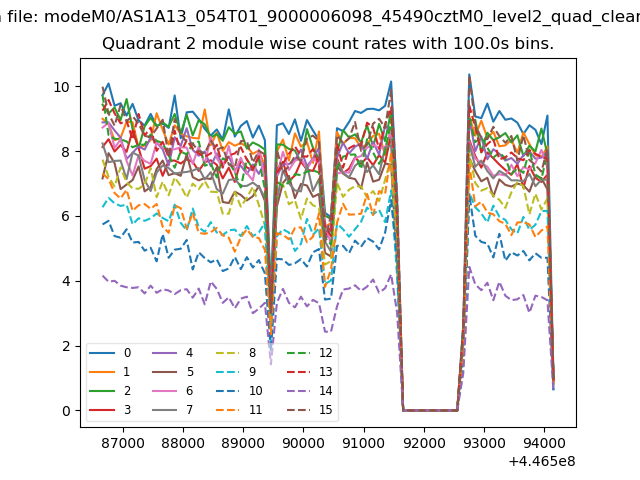
| Module-wise count rates for Quadrant B Data is divided into 100 sec bins |
 |
 |
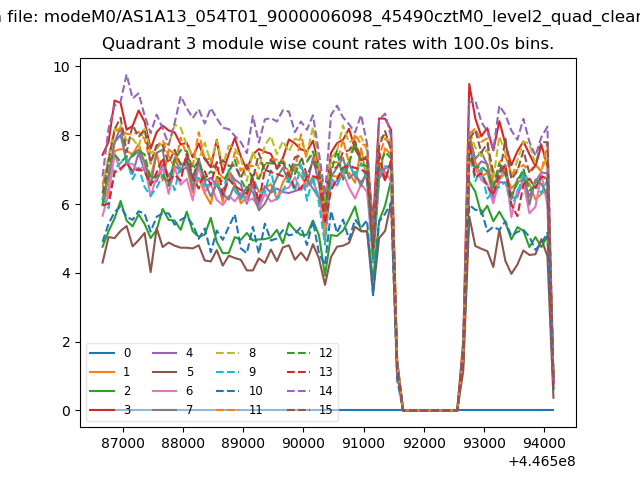
| Module-wise count rates for Quadrant C Data is divided into 100 sec bins |
 |
 |
| Module-wise count rates for Quadrant D Data is divided into 100 sec bins |
 |
 |
| Parameter | Plot |
|---|---|
| CZT HV Monitor | 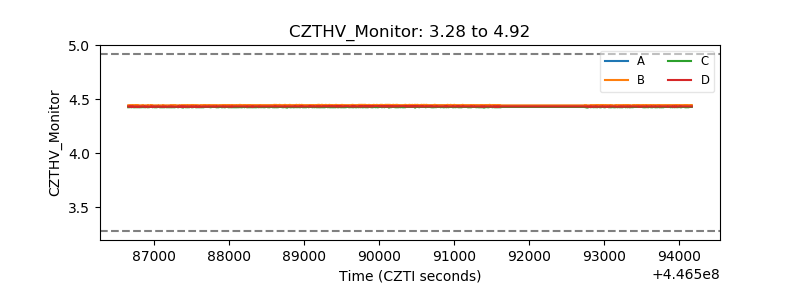 |
| D_VDD | 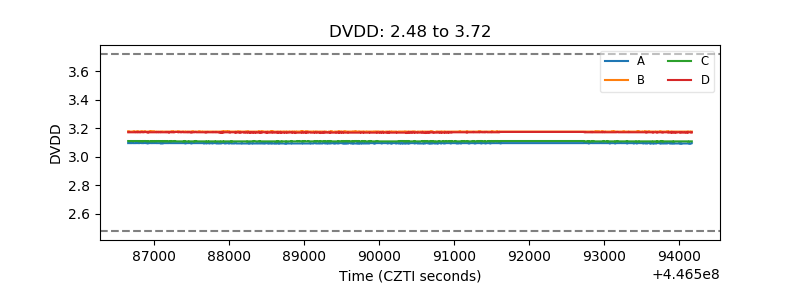 |
| Temperature 1 | 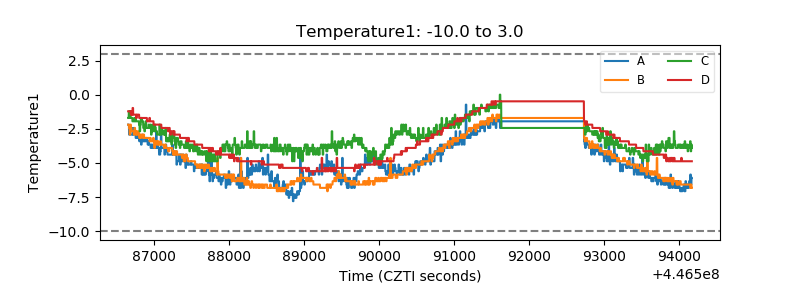 |
| Veto HV Monitor |  |
| Veto LLD | 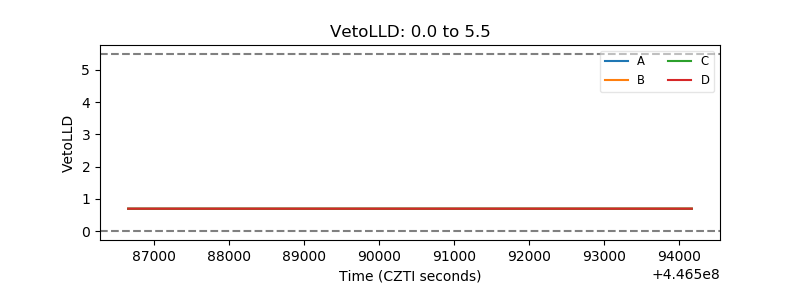 |
| Alpha Counter | 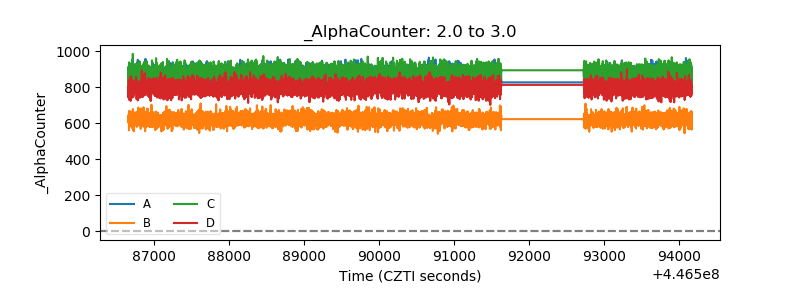 |
| _CPM_Rate |  |
| CZT Counter | 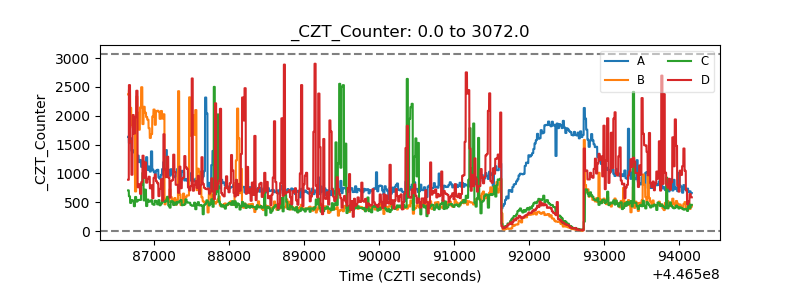 |
| +2.5 Volts monitor | 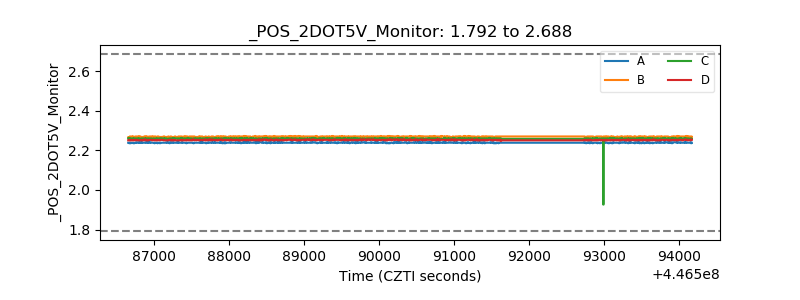 |
| +5 Volts monitor | 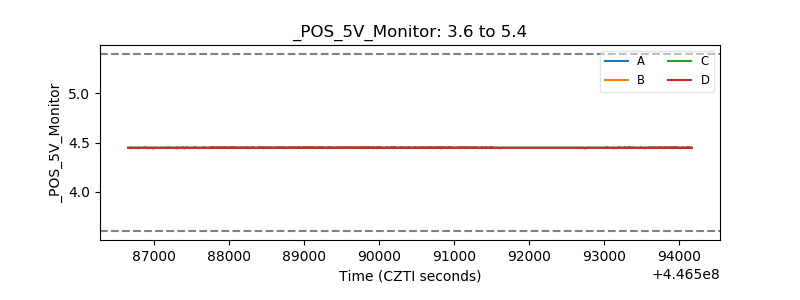 |
| _ROLL_ROT | 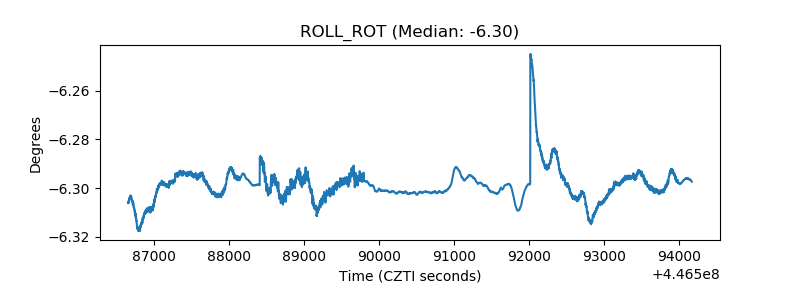 |
| _Roll_DEC | 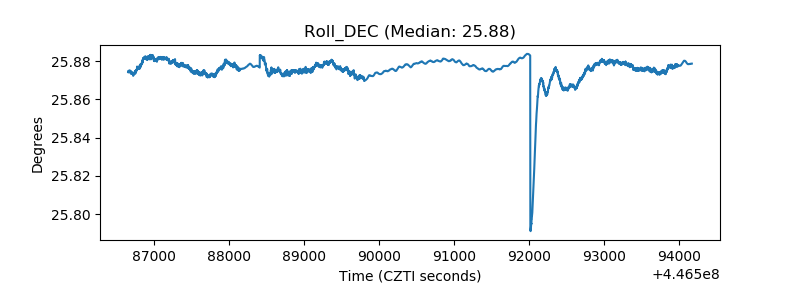 |
| _Roll_RA | 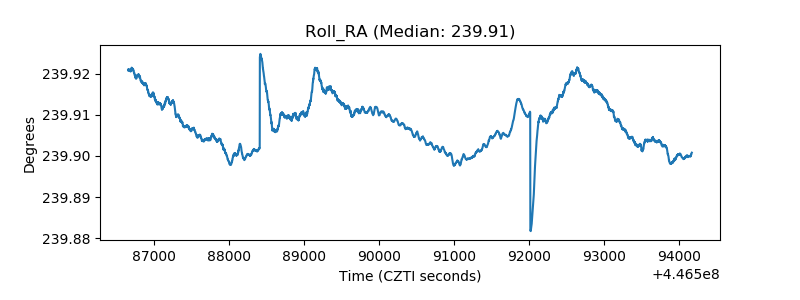 |
| Veto Counter | 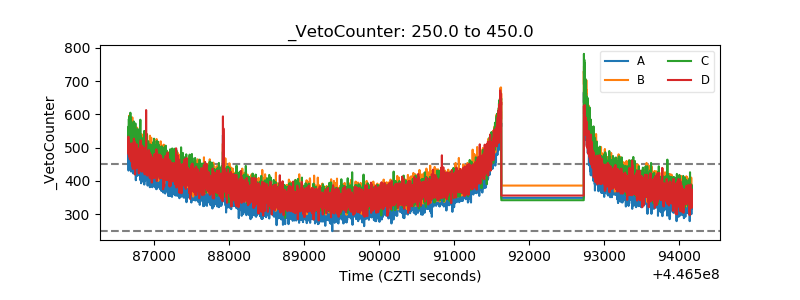 |