| Param | Original file | Final file |
|---|---|---|
| Filename | modeM0/AS1A13_054T01_9000006098_45491cztM0_level2.fits | modeM0/AS1A13_054T01_9000006098_45491cztM0_level2_quad_clean.evt |
| Size (bytes) | 509,290,560 | 109,422,720 |
| Size | 485.7 MB | 104.4 MB |
| Events in quadrant A | 5,726,027 | 724,316 |
| Events in quadrant B | 3,881,868 | 749,441 |
| Events in quadrant C | 3,113,380 | 735,381 |
| Events in quadrant D | 5,610,328 | 635,945 |
| Mode M0 | |||
|---|---|---|---|
| Quadrant | BADHDUFLAG | Total packets | Discarded packets |
| A | 0 | 22125 | 2 |
| B | 0 | 16280 | 2 |
| C | 0 | 14160 | 2 |
| D | 0 | 21392 | 2 |
| Mode SS | |||
|---|---|---|---|
| Quadrant | BADHDUFLAG | Total packets | Discarded packets |
| A | 0 | 138 | 0 |
| B | 0 | 138 | 0 |
| C | 0 | 138 | 0 |
| D | 0 | 138 | 0 |
| Mode M9 | |||
|---|---|---|---|
| Quadrant | BADHDUFLAG | Total packets | Discarded packets |
| A | 0 | 16 | 0 |
| B | 0 | 17 | 0 |
| C | 0 | 17 | 0 |
| D | 0 | 17 | 0 |
| Quadrant | Total seconds | Saturated seconds | Saturation percentage |
|---|---|---|---|
| A | 6711 | 228 | 3.397407% |
| B | 6711 | 304 | 4.529876% |
| C | 6711 | 72 | 1.072865% |
| D | 6711 | 488 | 7.271644% |
Noise dominated data is calculated using 1-second bins in cleaned event files. If a bin has >2000 counts, and if more than 50% of those come from <1% of pixels, then it is considered to be noise-dominated and hence unusable.
| Quadrant | # 1 sec bins | Bins with >0 counts | Bins with >2000 counts | High rate bins dominated by noise | Noise dominated (total time) | Noise dominated (detector-on time) | Marked lightcurve |
|---|---|---|---|---|---|---|---|
| A | 7642 | 6713 | 26 | 26 | 0.34% | 0.39% | 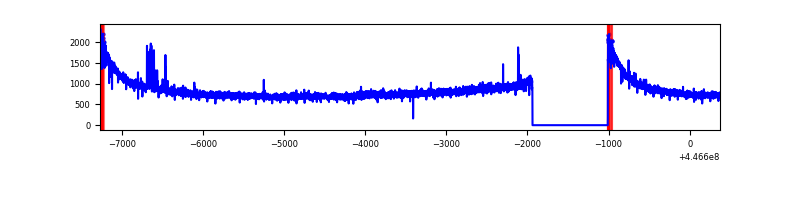 |
| B | 7642 | 6713 | 144 | 144 | 1.88% | 2.15% | 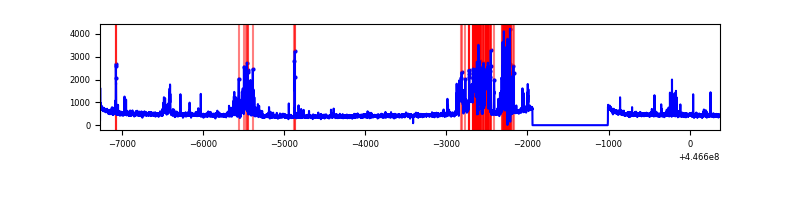 |
| C | 7642 | 6713 | 36 | 36 | 0.47% | 0.54% | 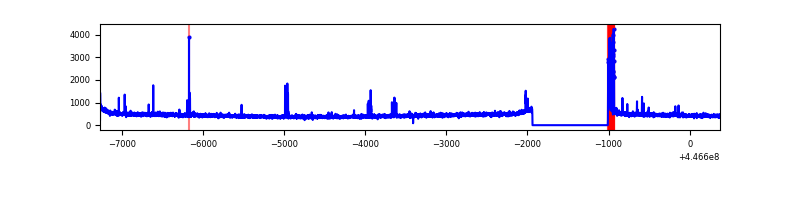 |
| D | 7642 | 6713 | 423 | 423 | 5.54% | 6.30% | 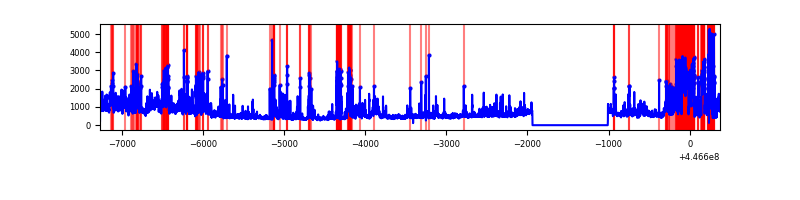 |
Top three noisy pixels from each quadrant. If the there are fewer than three noisy pixels in the level2.evt file, extra rows are filled as -1
| Pixel properties | Quadrant properties | ||||||
|---|---|---|---|---|---|---|---|
| Quadrant | DetID | PixID | Counts | Sigma | Mean | Median | Sigma |
| A | 10 | 83 | 2752650 | 17719.23 | 751 | 735 | 155.3 |
| A | 13 | 248 | 57299 | 364.21 | 751 | 735 | 155.3 |
| A | 0 | 243 | 8774 | 51.76 | 751 | 735 | 155.3 |
| B | 15 | 201 | 579352 | 3922.37 | 752 | 730 | 147.5 |
| B | 12 | 18 | 178221 | 1203.17 | 752 | 730 | 147.5 |
| B | 5 | 172 | 49546 | 330.91 | 752 | 730 | 147.5 |
| C | 14 | 254 | 163790 | 922.98 | 748 | 753 | 176.6 |
| C | 1 | 3 | 14222 | 76.25 | 748 | 753 | 176.6 |
| C | 2 | 14 | 7781 | 39.79 | 748 | 753 | 176.6 |
| D | 1 | 52 | 1632878 | 8910.87 | 724 | 702 | 183.2 |
| D | 11 | 241 | 682384 | 3721.64 | 724 | 702 | 183.2 |
| D | 2 | 249 | 112532 | 610.54 | 724 | 702 | 183.2 |
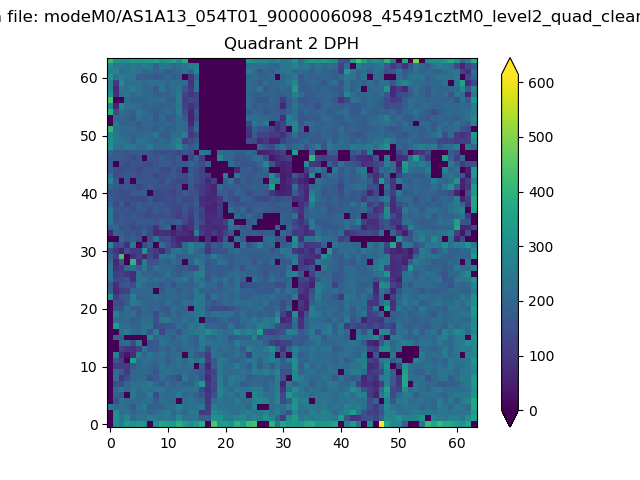
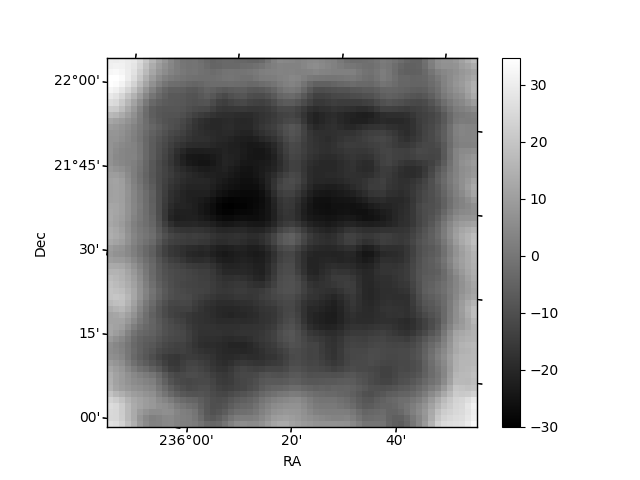
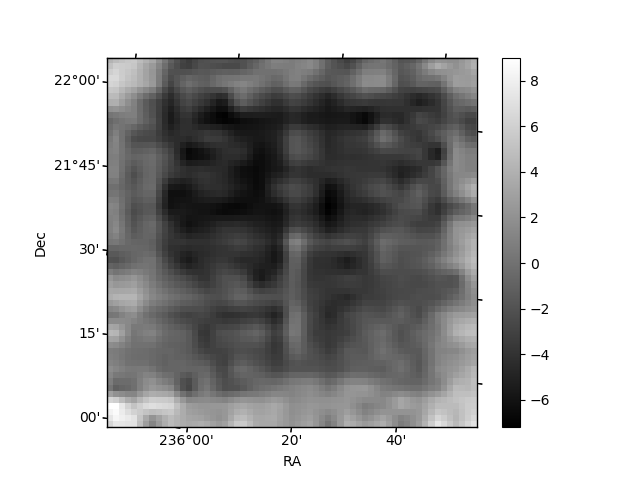
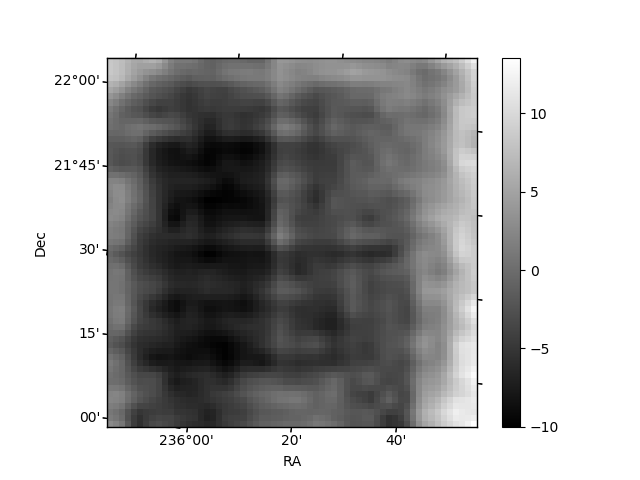
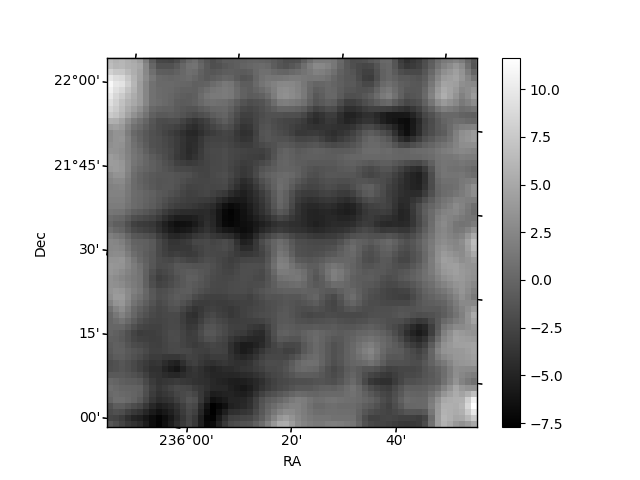
Histogram calculated using DETX and DETY for each event in the final _common_clean file
| Quadrant A | 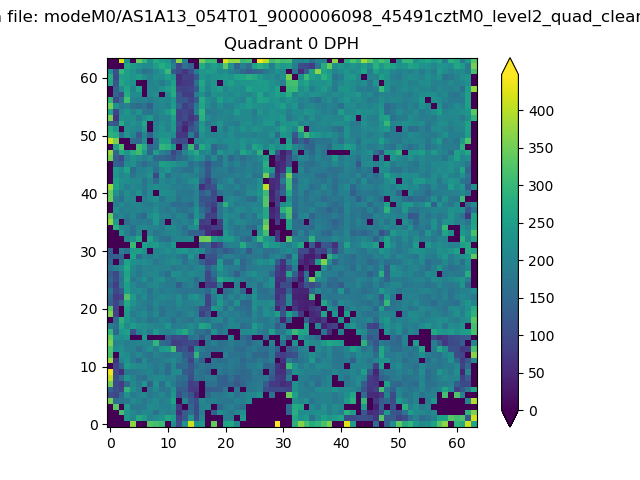 |
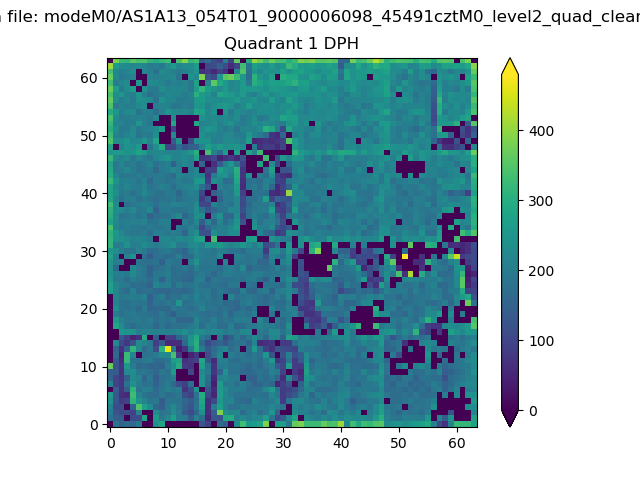 |
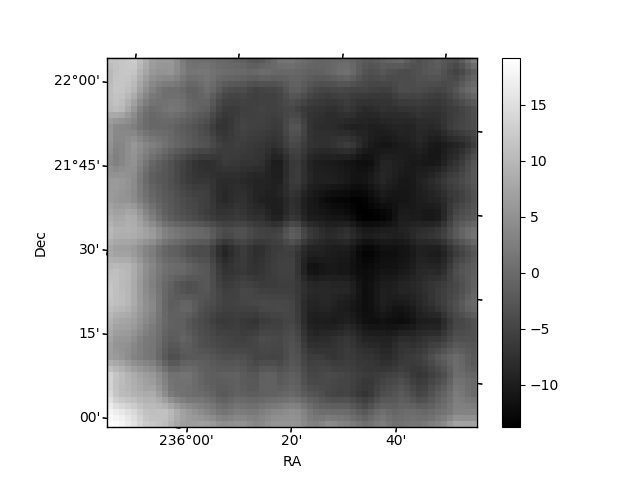
Quadrant B |
|---|---|---|---|
| Quadrant D | 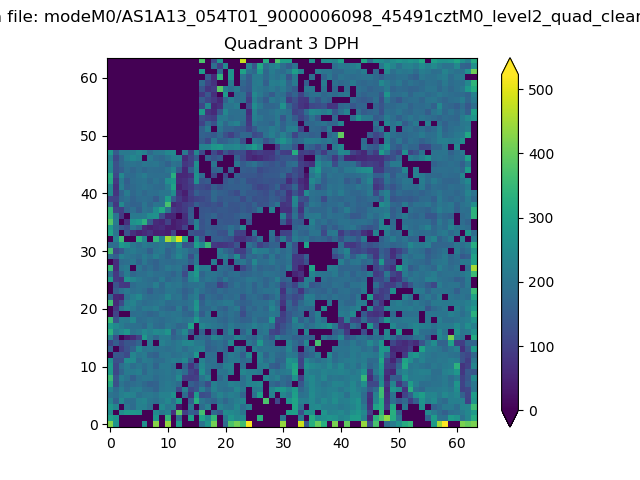 |
 |
Quadrant C |
| Plot type | Count rate plots | Images |
|---|---|---|
| Comparison with Poisson distribution Blue bars denote a histogram of data divided into 1 sec bins. Red curve is a Poisson curve with rate = median count rate of data. |
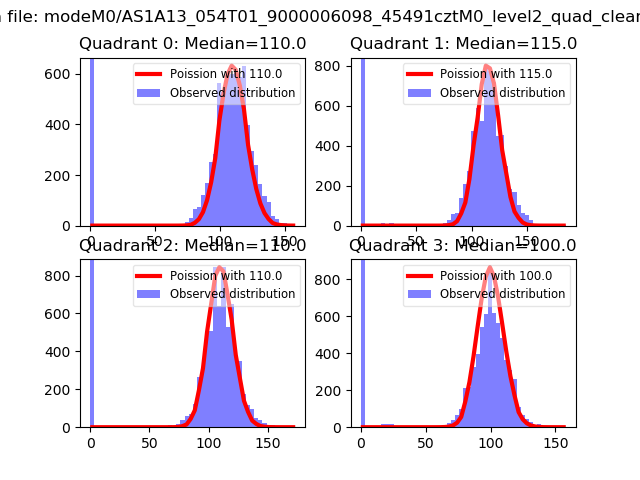 |
 |
| Quadrant-wise count rates Data is divided into 100 sec bins |
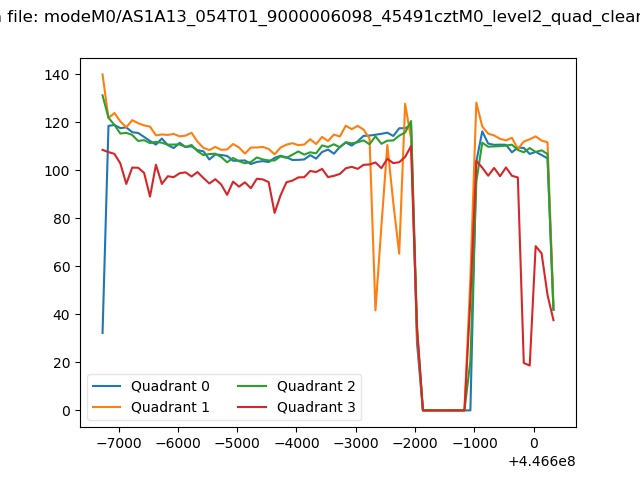 |
|
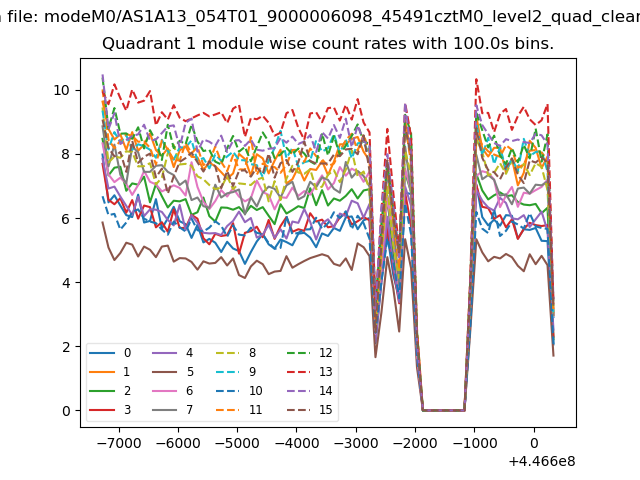
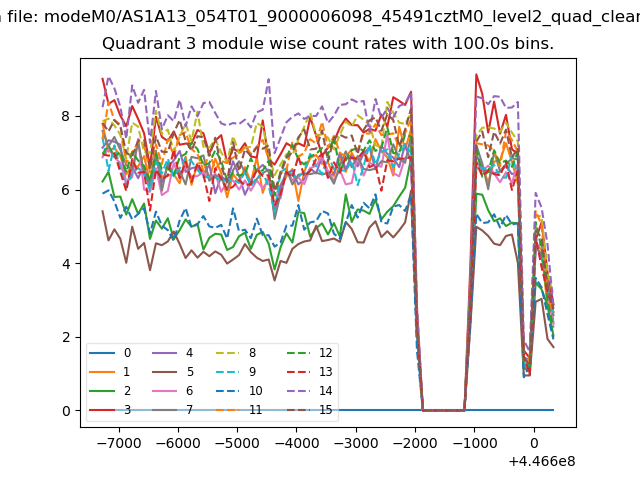
| Module-wise count rates for Quadrant A Data is divided into 100 sec bins |
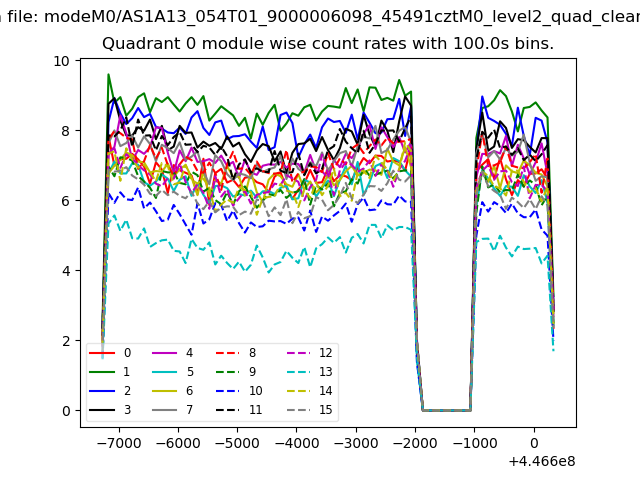 |
 |
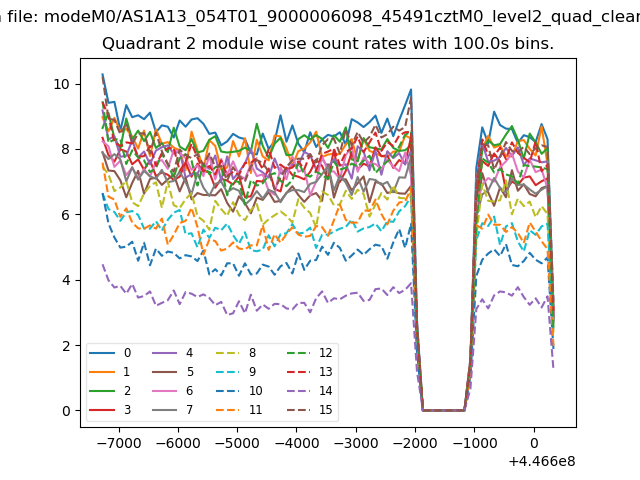
| Module-wise count rates for Quadrant B Data is divided into 100 sec bins |
 |
 |
| Module-wise count rates for Quadrant C Data is divided into 100 sec bins |
 |
 |
| Module-wise count rates for Quadrant D Data is divided into 100 sec bins |
 |
 |
| Parameter | Plot |
|---|---|
| CZT HV Monitor | 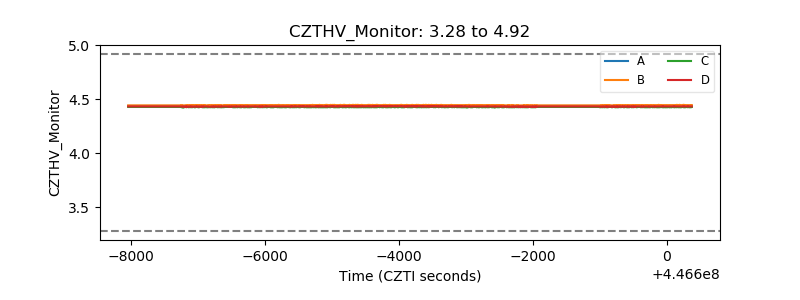 |
| D_VDD | 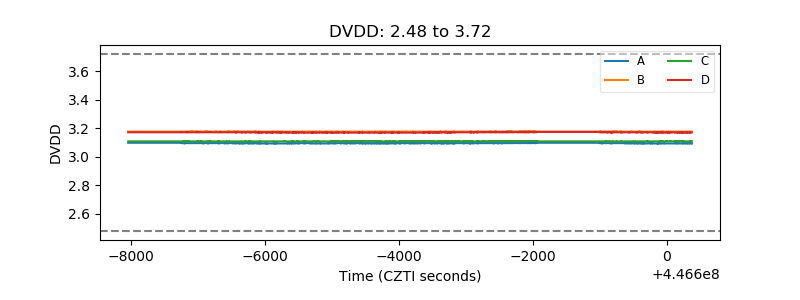 |
| Temperature 1 | 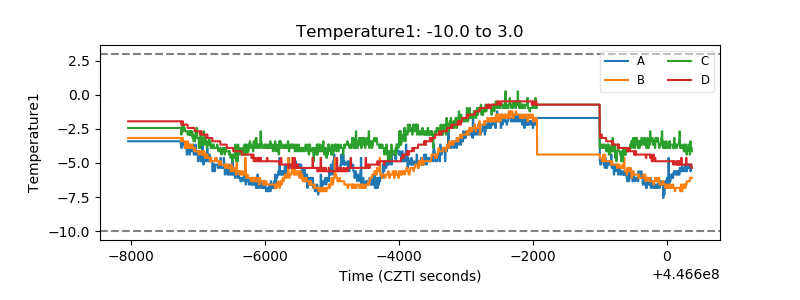 |
| Veto HV Monitor | 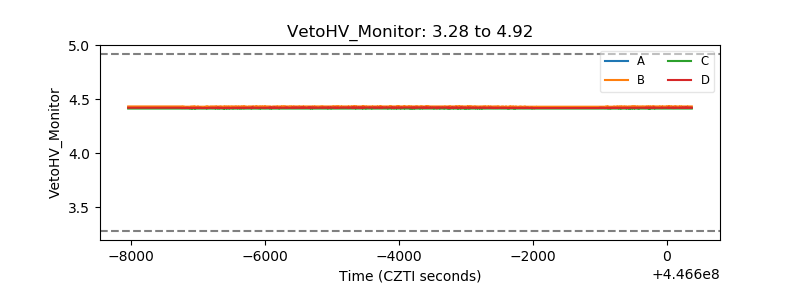 |
| Veto LLD | 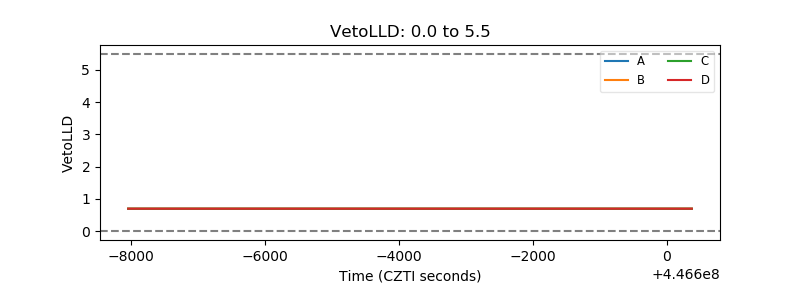 |
| Alpha Counter | 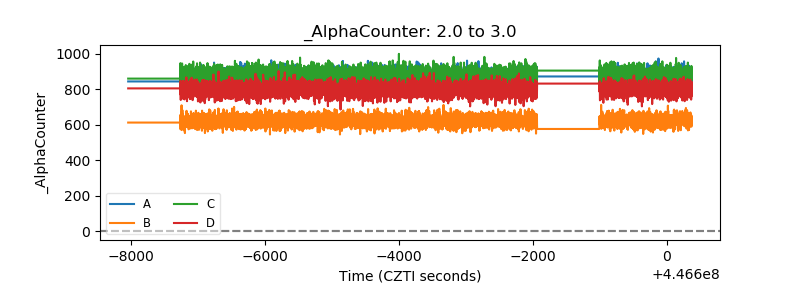 |
| _CPM_Rate | 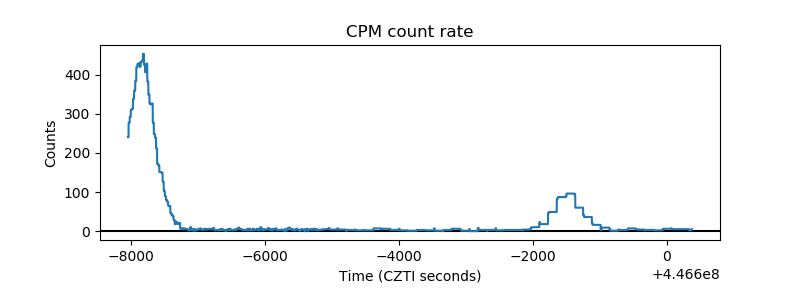 |
| CZT Counter | 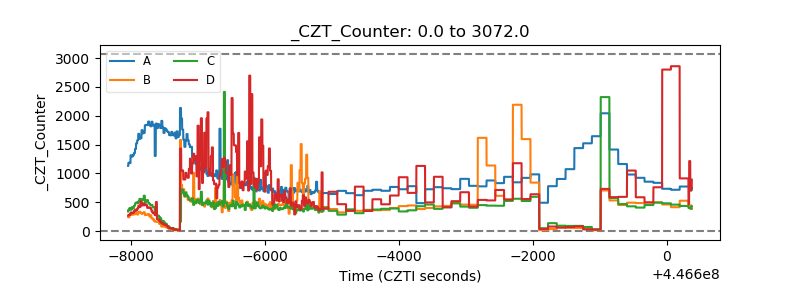 |
| +2.5 Volts monitor | 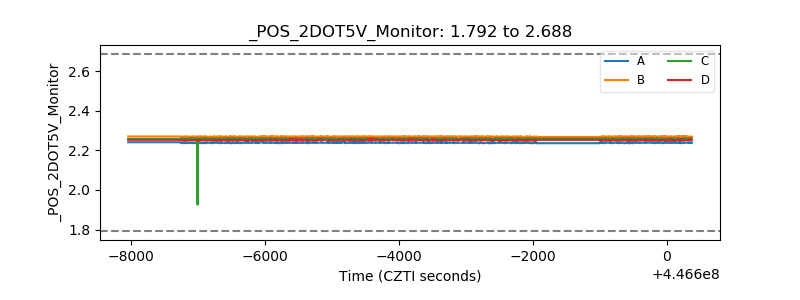 |
| +5 Volts monitor |  |
| _ROLL_ROT | 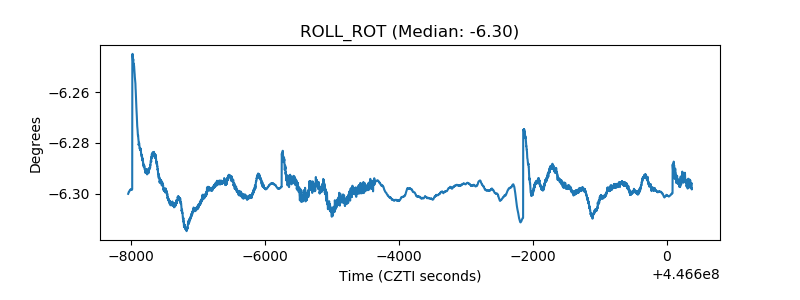 |
| _Roll_DEC | 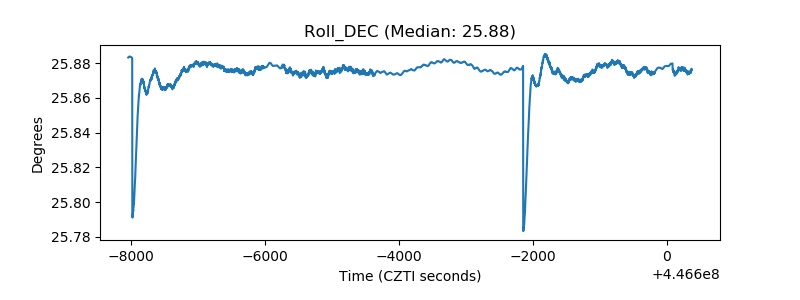 |
| _Roll_RA | 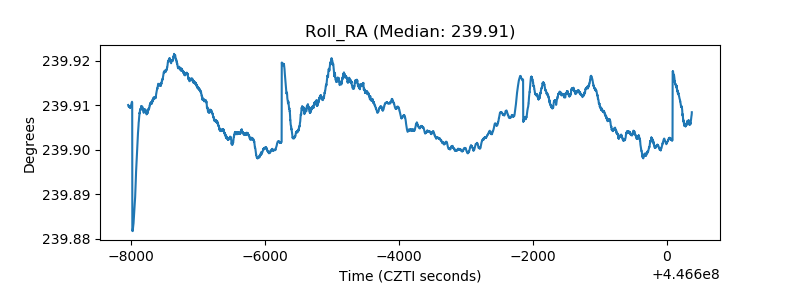 |
| Veto Counter | 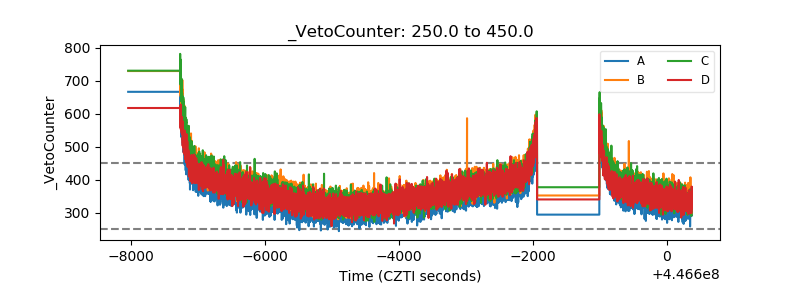 |