| Param | Original file | Final file |
|---|---|---|
| Filename | modeM0/AS1A13_054T01_9000006098_45492cztM0_level2.fits | modeM0/AS1A13_054T01_9000006098_45492cztM0_level2_quad_clean.evt |
| Size (bytes) | 563,857,920 | 117,446,400 |
| Size | 537.7 MB | 112.0 MB |
| Events in quadrant A | 6,145,236 | 778,242 |
| Events in quadrant B | 3,810,330 | 821,084 |
| Events in quadrant C | 3,655,780 | 782,781 |
| Events in quadrant D | 6,690,182 | 661,974 |
| Mode M0 | |||
|---|---|---|---|
| Quadrant | BADHDUFLAG | Total packets | Discarded packets |
| A | 0 | 23716 | 2 |
| B | 0 | 16482 | 2 |
| C | 0 | 16253 | 2 |
| D | 0 | 24979 | 2 |
| Mode SS | |||
|---|---|---|---|
| Quadrant | BADHDUFLAG | Total packets | Discarded packets |
| A | 0 | 148 | 0 |
| B | 0 | 148 | 0 |
| C | 0 | 148 | 0 |
| D | 0 | 148 | 0 |
| Mode M9 | |||
|---|---|---|---|
| Quadrant | BADHDUFLAG | Total packets | Discarded packets |
| A | 0 | 5 | 0 |
| B | 0 | 6 | 0 |
| C | 0 | 6 | 0 |
| D | 0 | 6 | 0 |
| Quadrant | Total seconds | Saturated seconds | Saturation percentage |
|---|---|---|---|
| A | 7358 | 266 | 3.615113% |
| B | 7358 | 227 | 3.085077% |
| C | 7358 | 156 | 2.120141% |
| D | 7358 | 782 | 10.627888% |
Noise dominated data is calculated using 1-second bins in cleaned event files. If a bin has >2000 counts, and if more than 50% of those come from <1% of pixels, then it is considered to be noise-dominated and hence unusable.
| Quadrant | # 1 sec bins | Bins with >0 counts | Bins with >2000 counts | High rate bins dominated by noise | Noise dominated (total time) | Noise dominated (detector-on time) | Marked lightcurve |
|---|---|---|---|---|---|---|---|
| A | 7708 | 7359 | 15 | 15 | 0.19% | 0.20% | 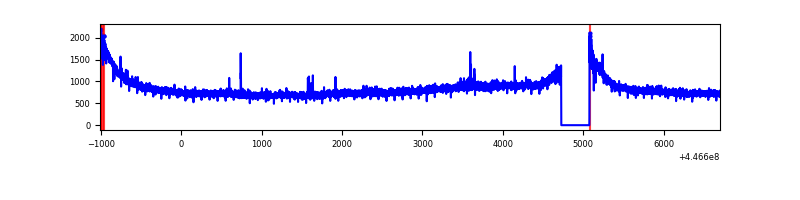 |
| B | 7708 | 7359 | 87 | 87 | 1.13% | 1.18% | 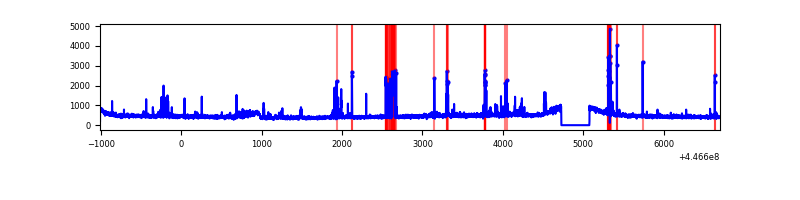 |
| C | 7708 | 7359 | 84 | 84 | 1.09% | 1.14% | 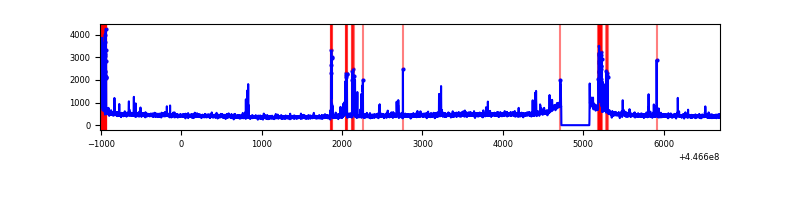 |
| D | 7708 | 7359 | 608 | 608 | 7.89% | 8.26% | 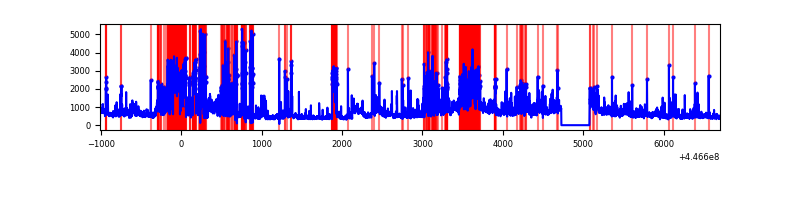 |
Top three noisy pixels from each quadrant. If the there are fewer than three noisy pixels in the level2.evt file, extra rows are filled as -1
| Pixel properties | Quadrant properties | ||||||
|---|---|---|---|---|---|---|---|
| Quadrant | DetID | PixID | Counts | Sigma | Mean | Median | Sigma |
| A | 10 | 83 | 2878614 | 16613.84 | 834 | 815 | 173.2 |
| A | 13 | 248 | 22752 | 126.64 | 834 | 815 | 173.2 |
| A | 3 | 137 | 9789 | 51.81 | 834 | 815 | 173.2 |
| B | 15 | 201 | 316510 | 1861.55 | 843 | 816 | 169.6 |
| B | 5 | 172 | 46015 | 266.52 | 843 | 816 | 169.6 |
| B | 0 | 186 | 39194 | 226.3 | 843 | 816 | 169.6 |
| C | 14 | 254 | 431623 | 2208.73 | 821 | 828 | 195.0 |
| C | 3 | 233 | 10208 | 48.09 | 821 | 828 | 195.0 |
| C | 12 | 2 | 7677 | 35.12 | 821 | 828 | 195.0 |
| D | 1 | 52 | 2038747 | 10103.43 | 790 | 764 | 201.7 |
| D | 5 | 222 | 820254 | 4062.67 | 790 | 764 | 201.7 |
| D | 11 | 241 | 386180 | 1910.72 | 790 | 764 | 201.7 |
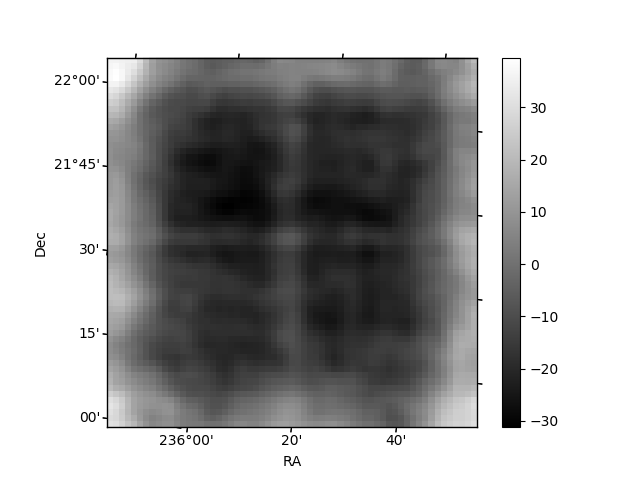
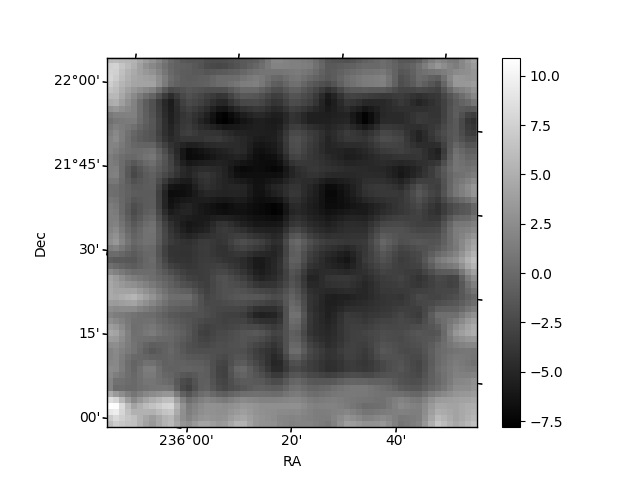
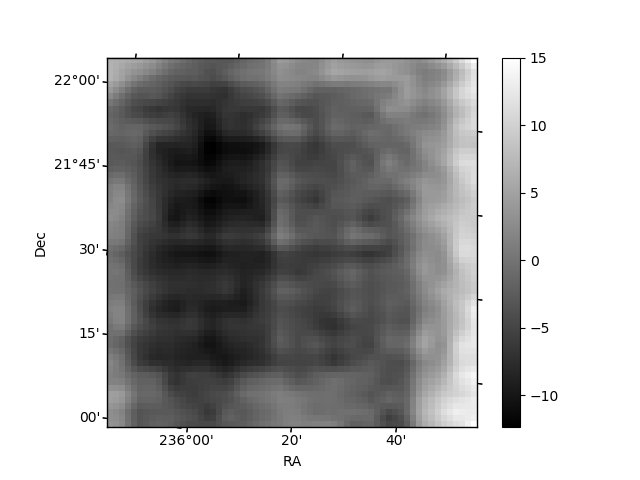
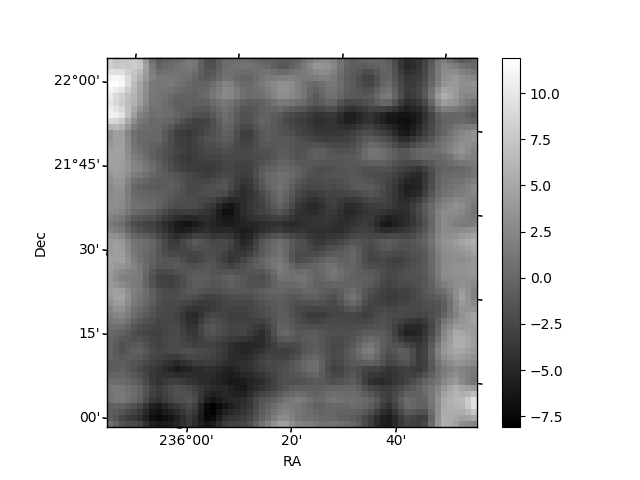
Histogram calculated using DETX and DETY for each event in the final _common_clean file
| Quadrant A | 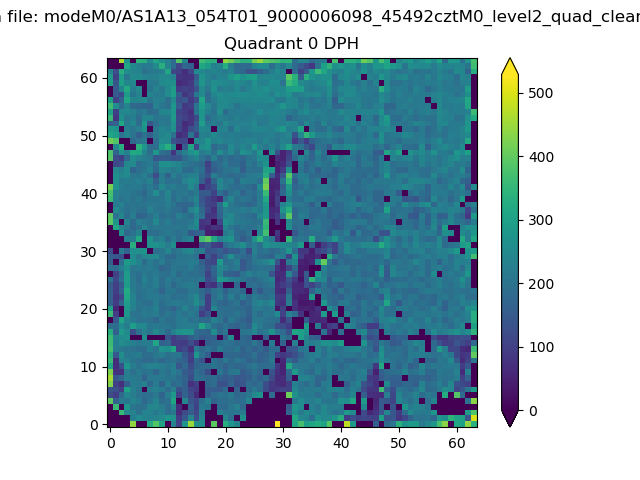 |
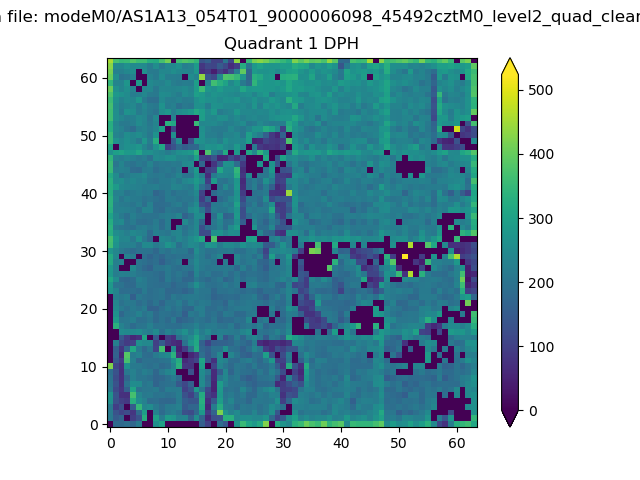 |
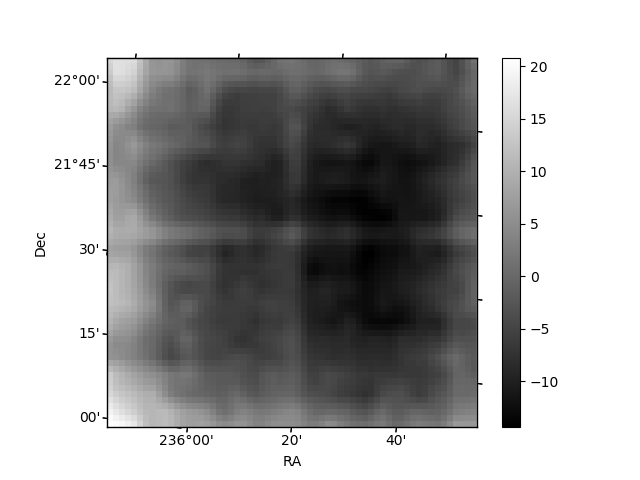
Quadrant B |
|---|---|---|---|
| Quadrant D | 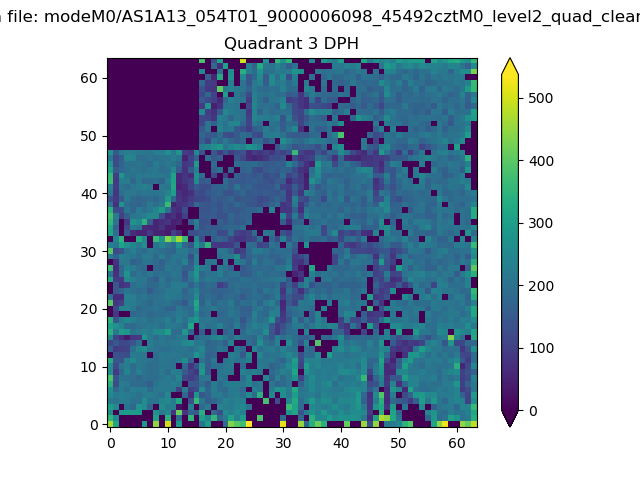 |
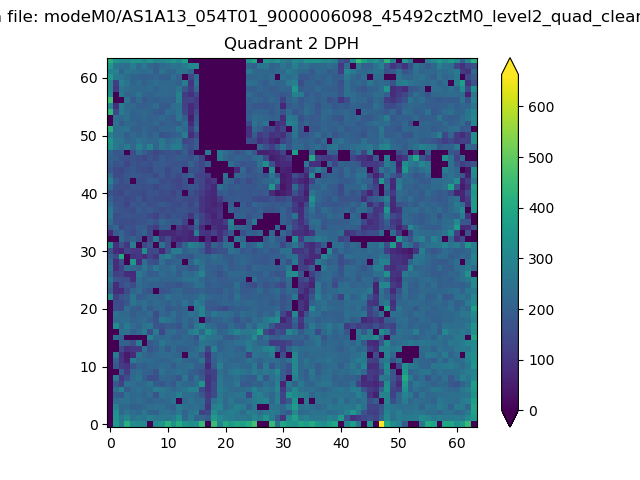 |
Quadrant C |
| Plot type | Count rate plots | Images |
|---|---|---|
| Comparison with Poisson distribution Blue bars denote a histogram of data divided into 1 sec bins. Red curve is a Poisson curve with rate = median count rate of data. |
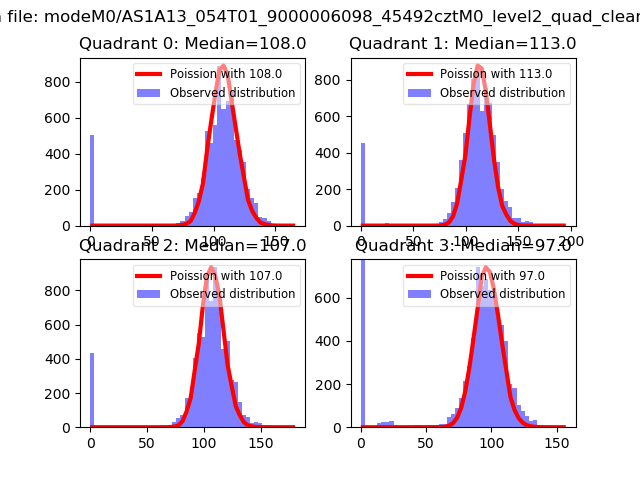 |
 |
| Quadrant-wise count rates Data is divided into 100 sec bins |
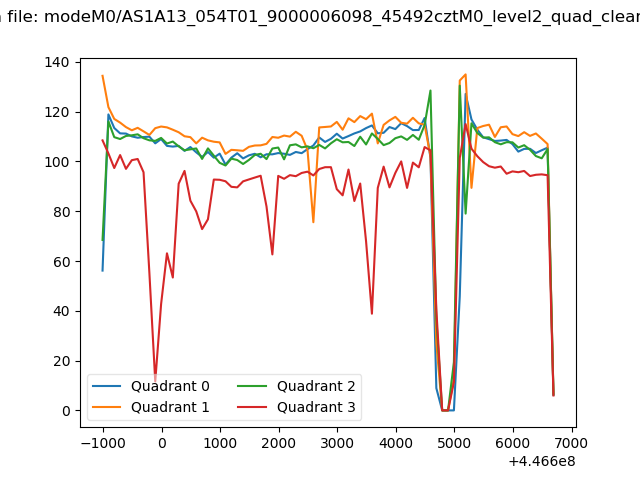 |
|
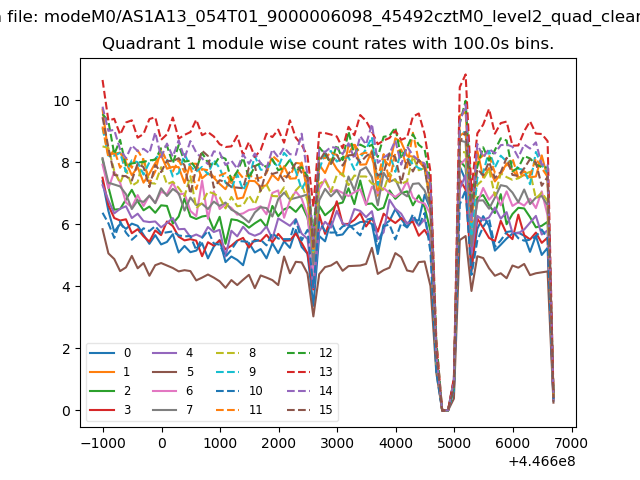
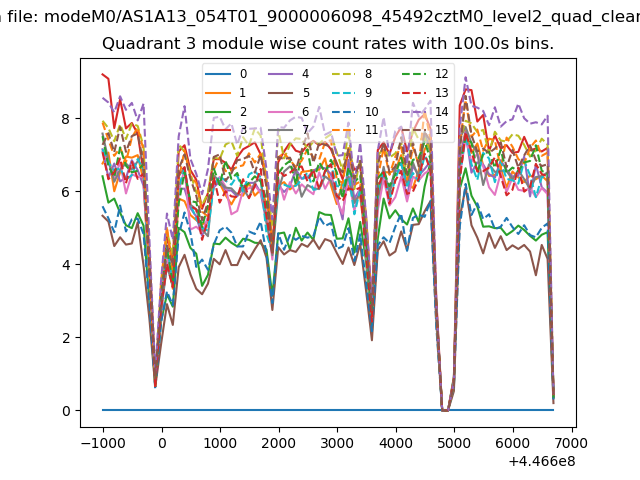
| Module-wise count rates for Quadrant A Data is divided into 100 sec bins |
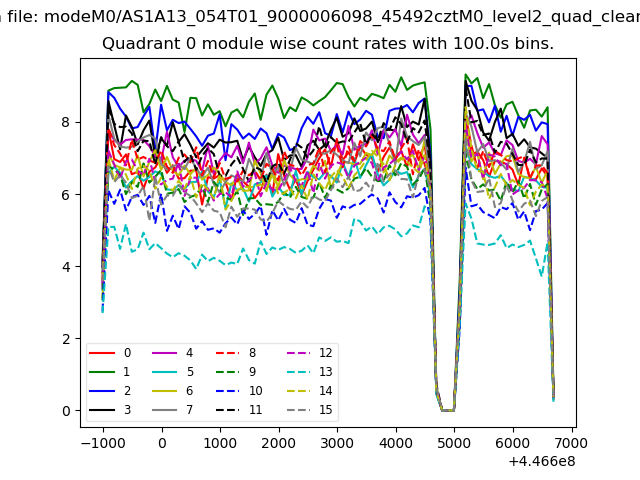 |
 |
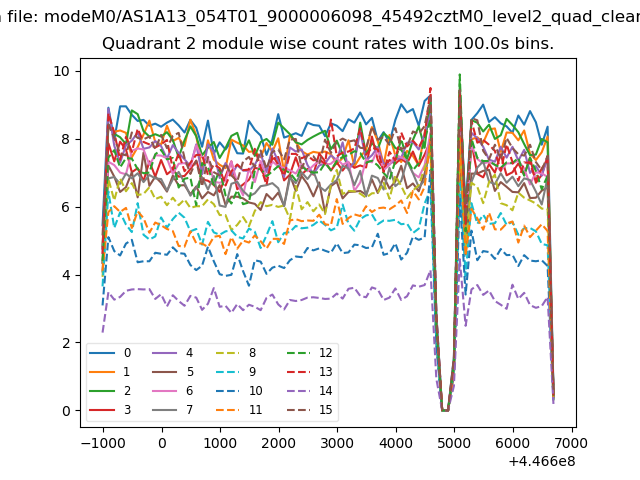
| Module-wise count rates for Quadrant B Data is divided into 100 sec bins |
 |
 |
| Module-wise count rates for Quadrant C Data is divided into 100 sec bins |
 |
 |
| Module-wise count rates for Quadrant D Data is divided into 100 sec bins |
 |
 |
| Parameter | Plot |
|---|---|
| CZT HV Monitor | 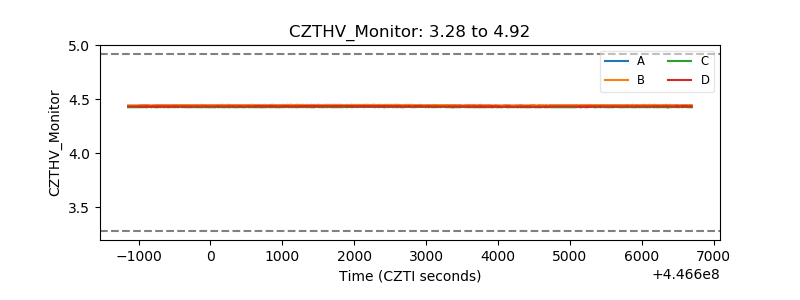 |
| D_VDD | 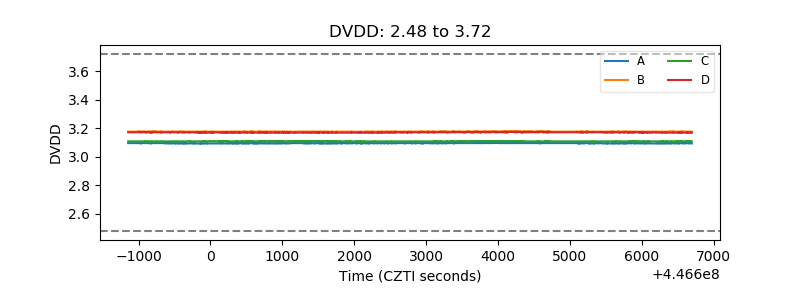 |
| Temperature 1 | 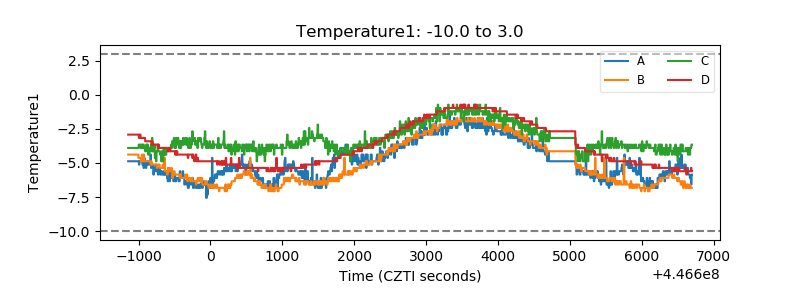 |
| Veto HV Monitor | 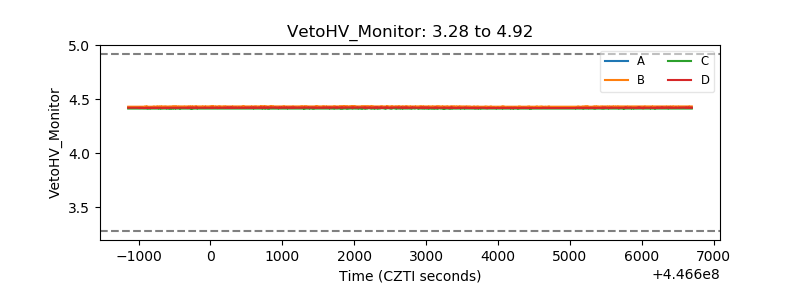 |
| Veto LLD | 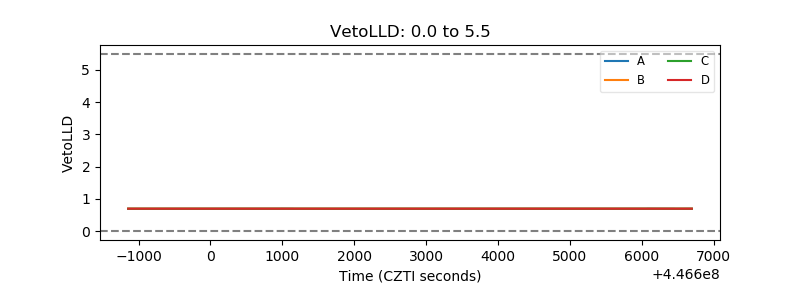 |
| Alpha Counter | 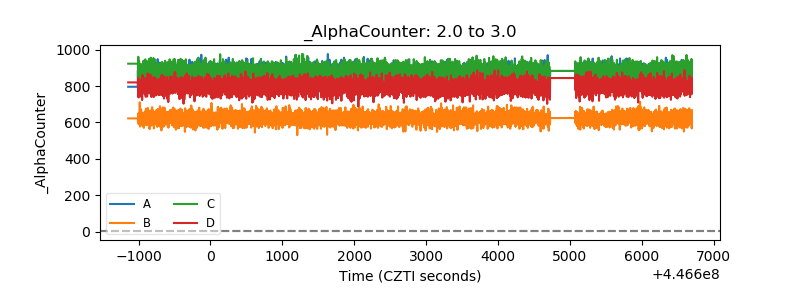 |
| _CPM_Rate | 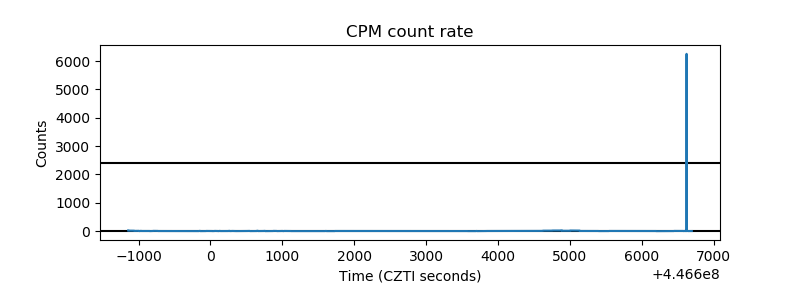 |
| CZT Counter | 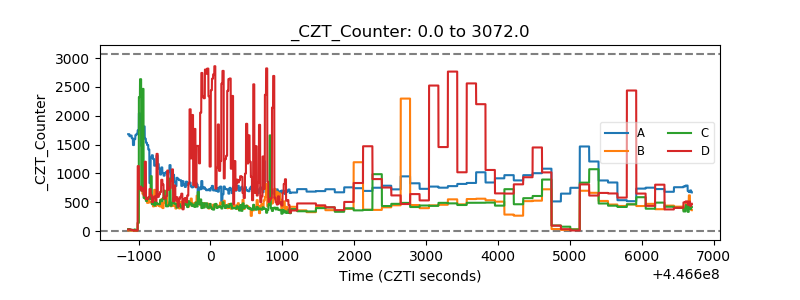 |
| +2.5 Volts monitor | 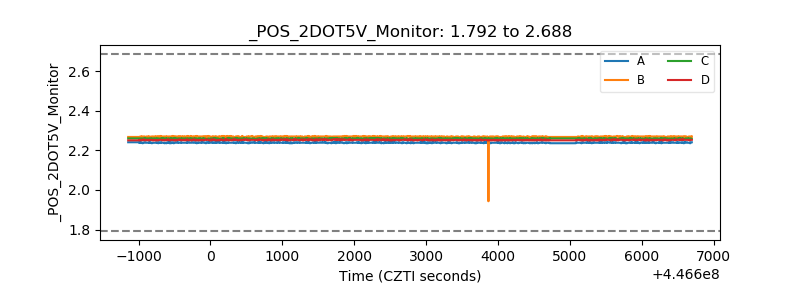 |
| +5 Volts monitor | 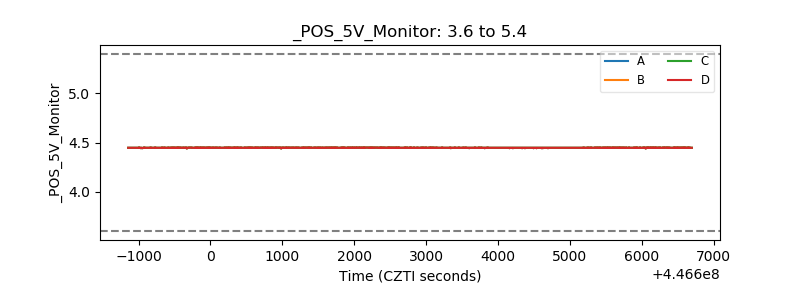 |
| _ROLL_ROT | 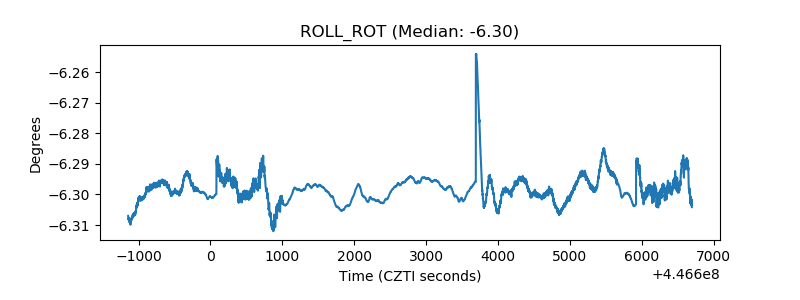 |
| _Roll_DEC | 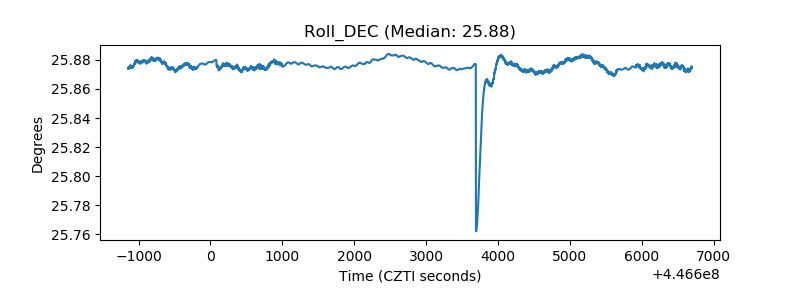 |
| _Roll_RA | 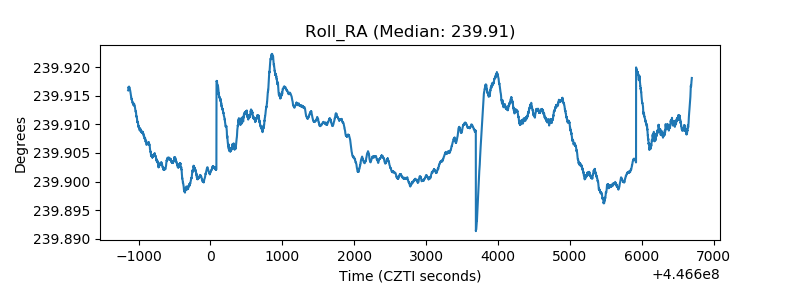 |
| Veto Counter | 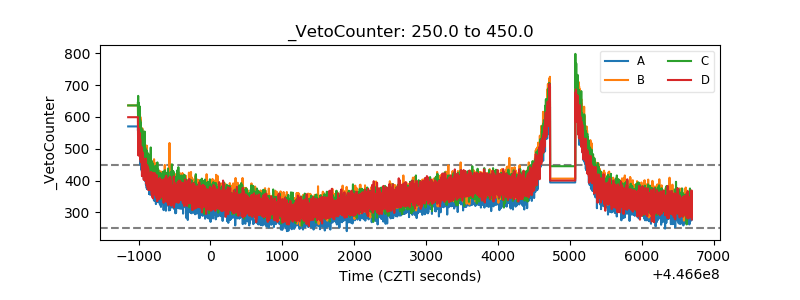 |