| Param | Original file | Final file |
|---|---|---|
| Filename | modeM0/AS1A13_054T01_9000006098_45493cztM0_level2.fits | modeM0/AS1A13_054T01_9000006098_45493cztM0_level2_quad_clean.evt |
| Size (bytes) | 527,244,480 | 128,793,600 |
| Size | 502.8 MB | 122.8 MB |
| Events in quadrant A | 6,324,471 | 848,686 |
| Events in quadrant B | 3,837,968 | 887,565 |
| Events in quadrant C | 3,705,788 | 846,333 |
| Events in quadrant D | 5,033,400 | 766,005 |
| Mode M0 | |||
|---|---|---|---|
| Quadrant | BADHDUFLAG | Total packets | Discarded packets |
| A | 0 | 24743 | 1 |
| B | 0 | 17159 | 1 |
| C | 0 | 17007 | 1 |
| D | 0 | 20558 | 2 |
| Mode SS | |||
|---|---|---|---|
| Quadrant | BADHDUFLAG | Total packets | Discarded packets |
| A | 0 | 158 | 0 |
| B | 0 | 158 | 0 |
| C | 0 | 158 | 0 |
| D | 0 | 158 | 0 |
| Mode M9 | |||
|---|---|---|---|
| Quadrant | BADHDUFLAG | Total packets | Discarded packets |
| A | 1 | 139625966020648 | 139625091825710 |
| B | 1 | -1 | -1 |
| C | 1 | -1 | -1 |
| D | 1 | -1 | -1 |
| Quadrant | Total seconds | Saturated seconds | Saturation percentage |
|---|---|---|---|
| A | 7930 | 146 | 1.841110% |
| B | 7930 | 128 | 1.614124% |
| C | 7930 | 80 | 1.008827% |
| D | 7929 | 164 | 2.068357% |
Noise dominated data is calculated using 1-second bins in cleaned event files. If a bin has >2000 counts, and if more than 50% of those come from <1% of pixels, then it is considered to be noise-dominated and hence unusable.
| Quadrant | # 1 sec bins | Bins with >0 counts | Bins with >2000 counts | High rate bins dominated by noise | Noise dominated (total time) | Noise dominated (detector-on time) | Marked lightcurve |
|---|---|---|---|---|---|---|---|
| A | 7930 | 7930 | 2 | 2 | 0.03% | 0.03% |  |
| B | 7930 | 7930 | 32 | 32 | 0.40% | 0.40% |  |
| C | 7930 | 7930 | 37 | 37 | 0.47% | 0.47% |  |
| D | 7929 | 7929 | 88 | 88 | 1.11% | 1.11% |  |
Top three noisy pixels from each quadrant. If the there are fewer than three noisy pixels in the level2.evt file, extra rows are filled as -1
| Pixel properties | Quadrant properties | ||||||
|---|---|---|---|---|---|---|---|
| Quadrant | DetID | PixID | Counts | Sigma | Mean | Median | Sigma |
| A | 10 | 83 | 2803938 | 14784.91 | 904 | 883 | 189.6 |
| A | 13 | 248 | 13109 | 64.49 | 904 | 883 | 189.6 |
| A | 3 | 137 | 10708 | 51.82 | 904 | 883 | 189.6 |
| B | 15 | 201 | 94056 | 509.24 | 912 | 885 | 183.0 |
| B | 5 | 172 | 42405 | 226.93 | 912 | 885 | 183.0 |
| B | 12 | 18 | 26159 | 138.14 | 912 | 885 | 183.0 |
| C | 14 | 254 | 191426 | 895.58 | 892 | 896 | 212.7 |
| C | 2 | 14 | 13624 | 59.83 | 892 | 896 | 212.7 |
| C | 1 | 3 | 9478 | 40.34 | 892 | 896 | 212.7 |
| D | 1 | 52 | 552386 | 2453.44 | 880 | 850 | 224.8 |
| D | 11 | 241 | 551259 | 2448.43 | 880 | 850 | 224.8 |
| D | 13 | 249 | 167936 | 743.26 | 880 | 850 | 224.8 |
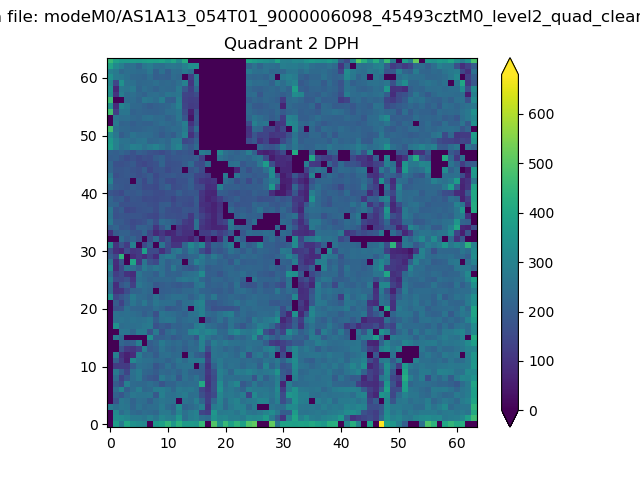
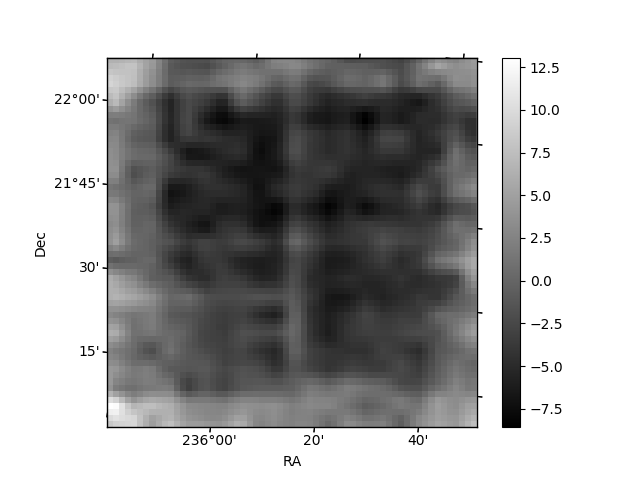
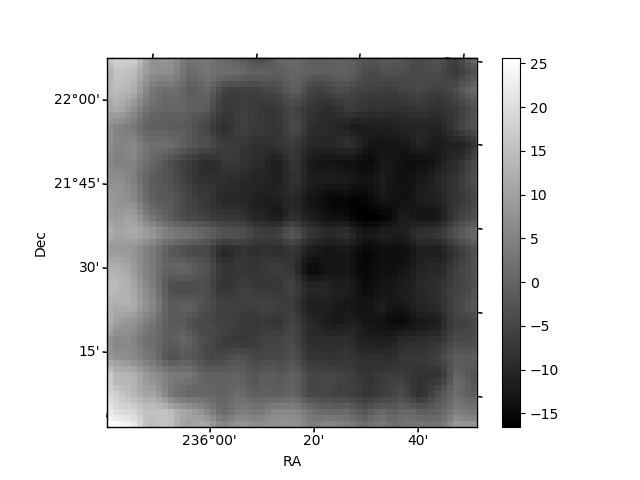
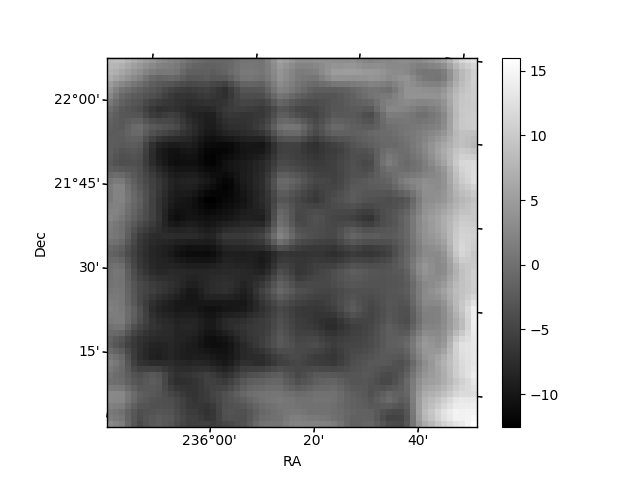
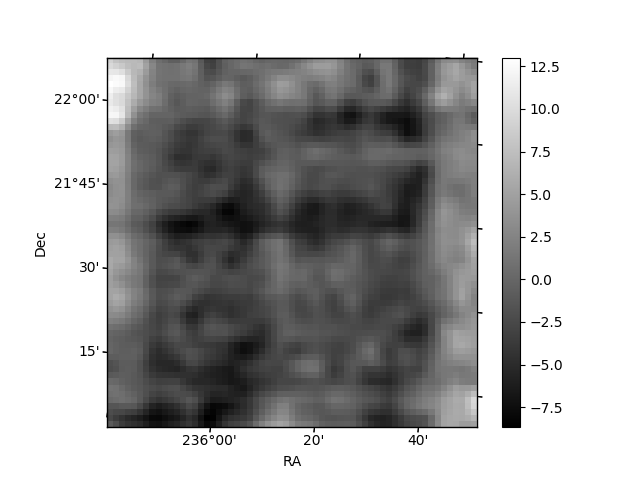
Histogram calculated using DETX and DETY for each event in the final _common_clean file
| Quadrant A | 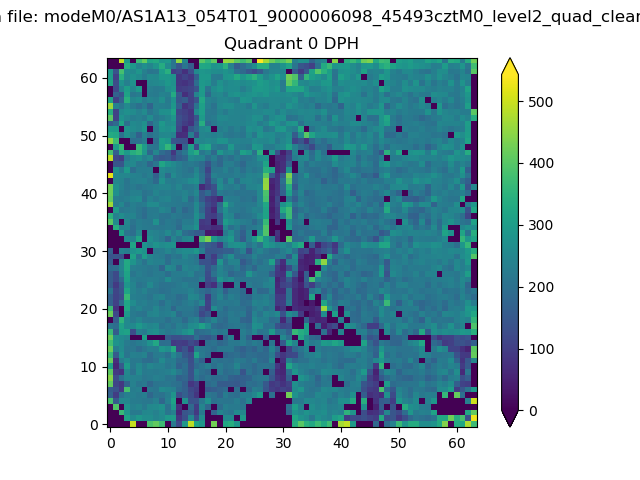 |
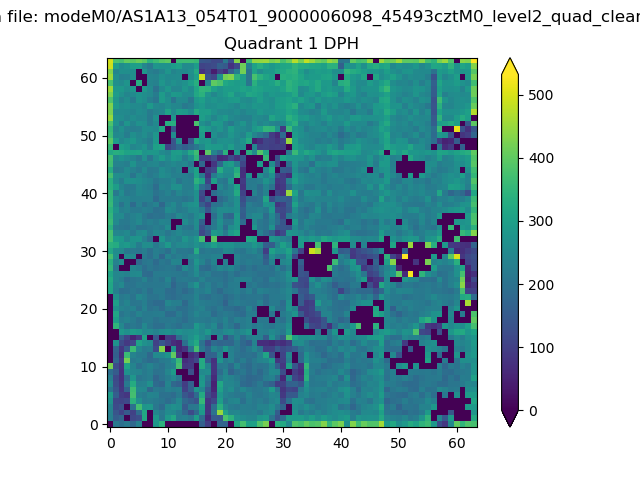 |
Quadrant B |
|---|---|---|---|
| Quadrant D | 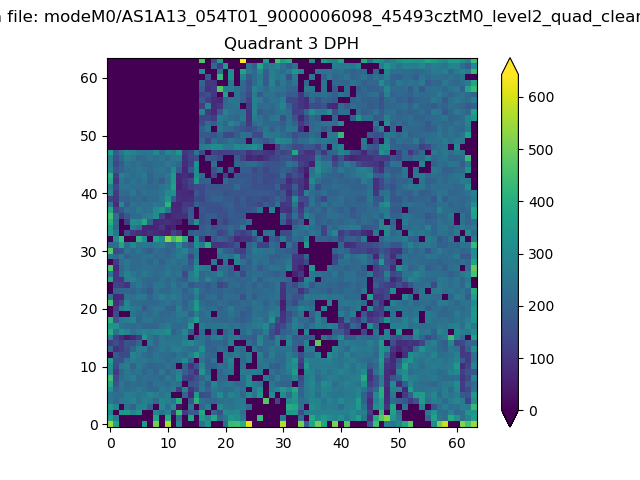 |
 |
Quadrant C |
| Plot type | Count rate plots | Images |
|---|---|---|
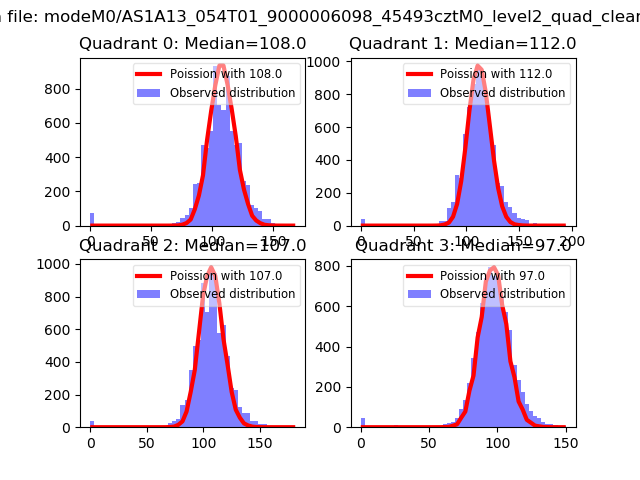
| Comparison with Poisson distribution Blue bars denote a histogram of data divided into 1 sec bins. Red curve is a Poisson curve with rate = median count rate of data. |
 |
 |
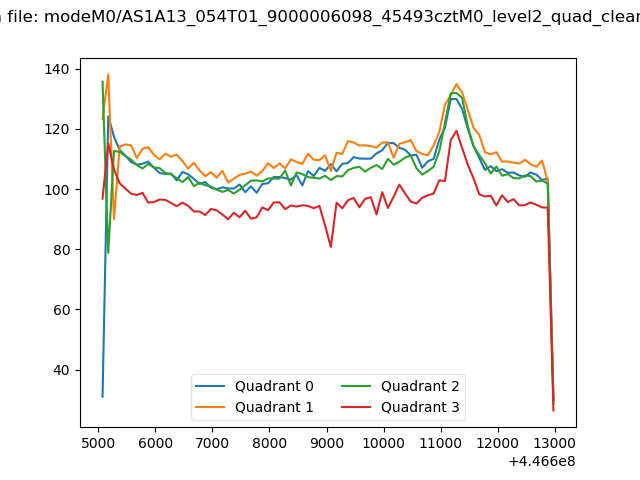
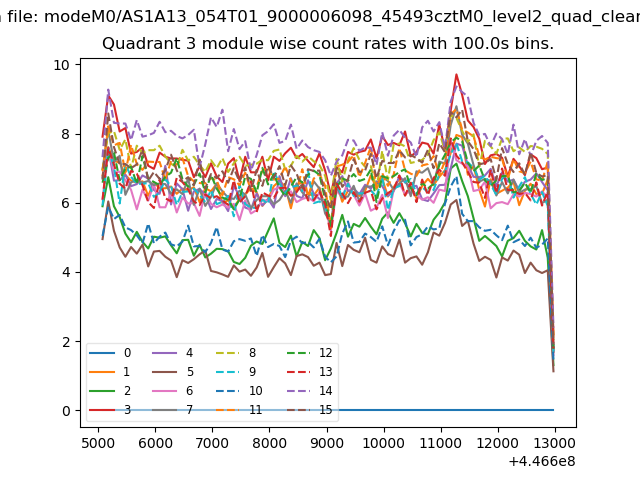
| Quadrant-wise count rates Data is divided into 100 sec bins |
 |
|
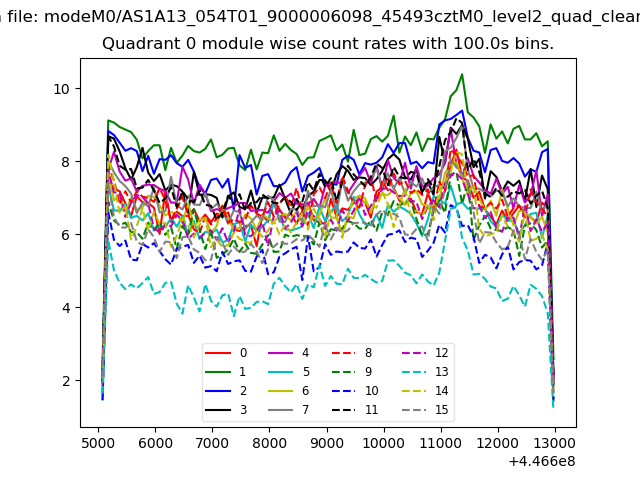
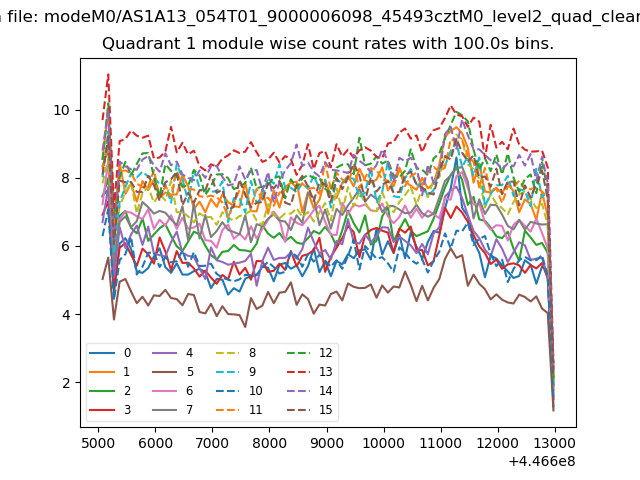
| Module-wise count rates for Quadrant A Data is divided into 100 sec bins |
 |
 |
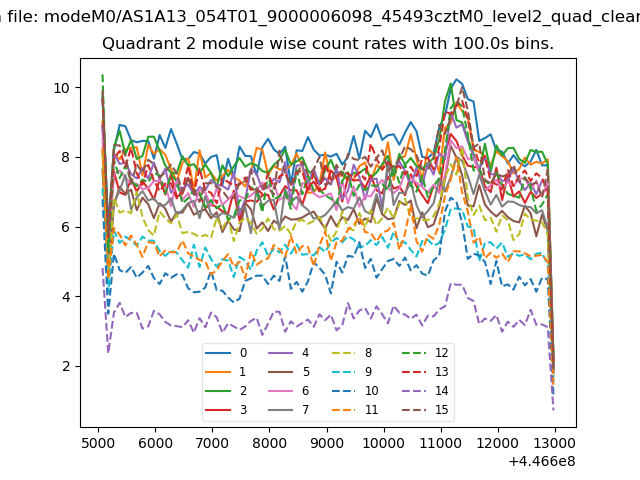
| Module-wise count rates for Quadrant B Data is divided into 100 sec bins |
 |
 |
| Module-wise count rates for Quadrant C Data is divided into 100 sec bins |
 |
 |
| Module-wise count rates for Quadrant D Data is divided into 100 sec bins |
 |
 |
| Parameter | Plot |
|---|---|
| CZT HV Monitor | 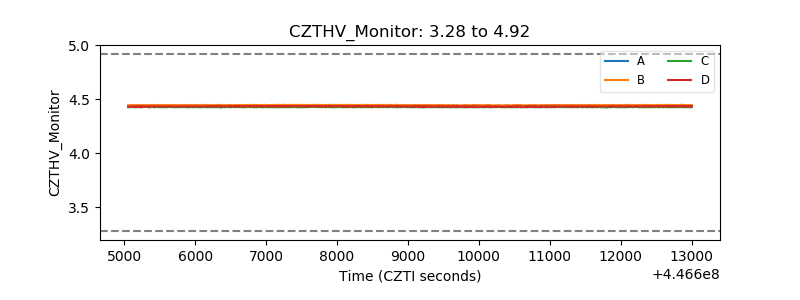 |
| D_VDD | 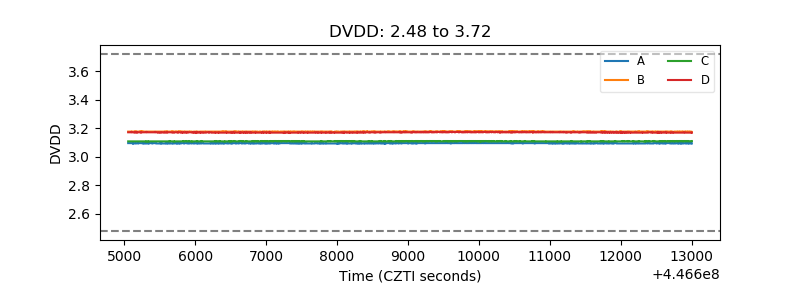 |
| Temperature 1 | 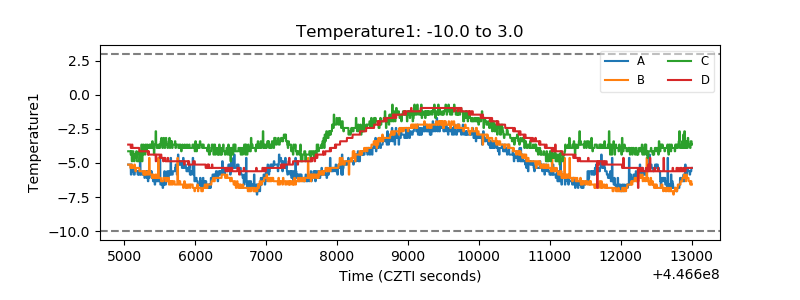 |
| Veto HV Monitor | 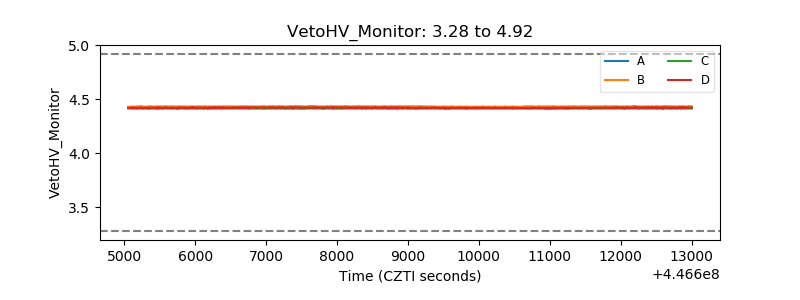 |
| Veto LLD | 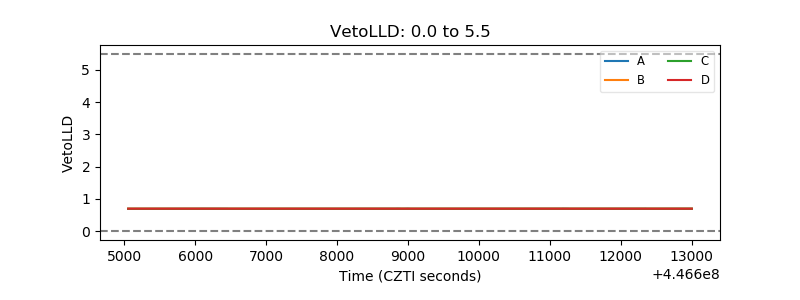 |
| Alpha Counter | 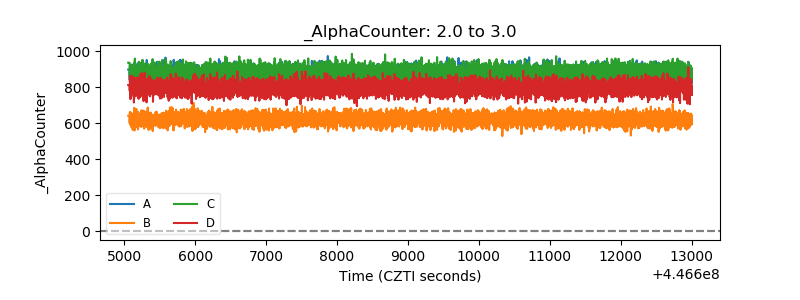 |
| _CPM_Rate | 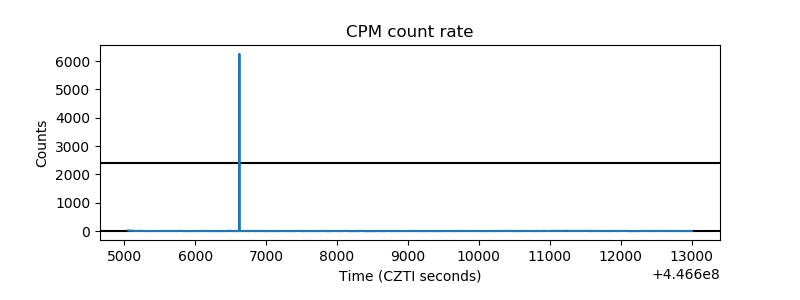 |
| CZT Counter | 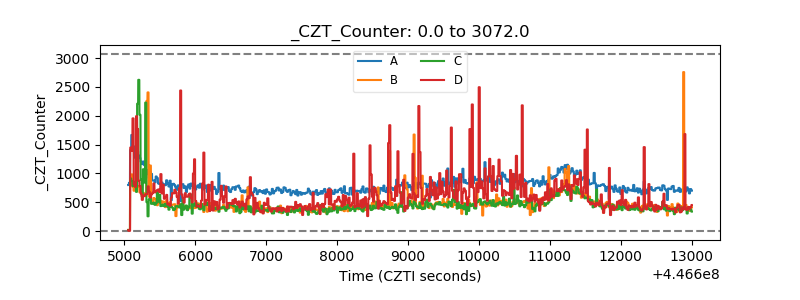 |
| +2.5 Volts monitor | 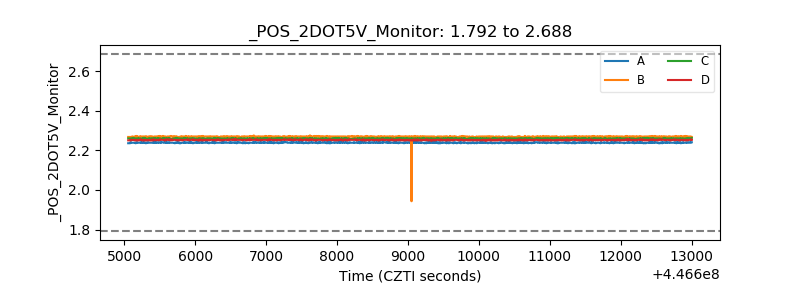 |
| +5 Volts monitor | 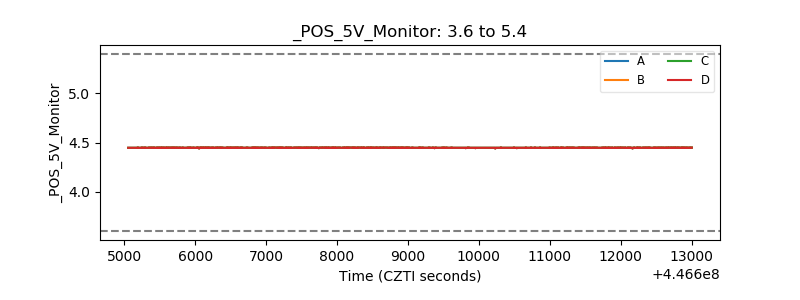 |
| _ROLL_ROT | 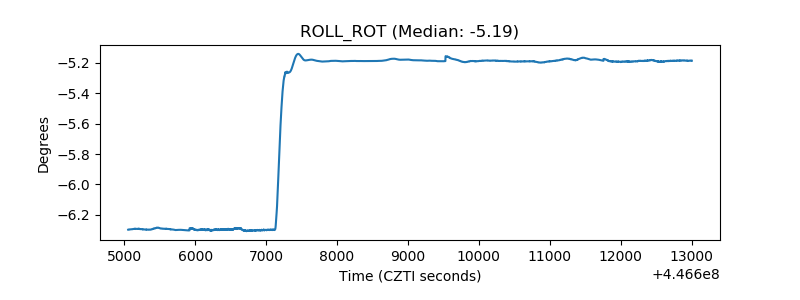 |
| _Roll_DEC | 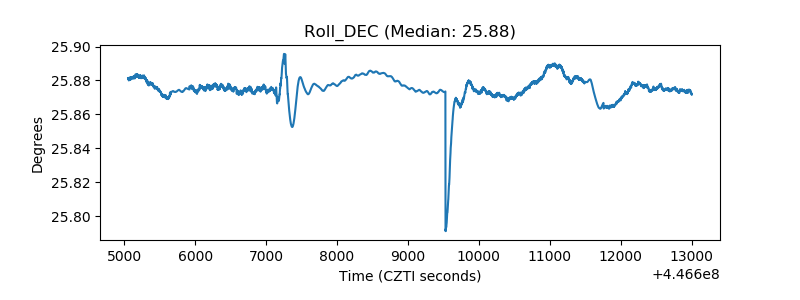 |
| _Roll_RA | 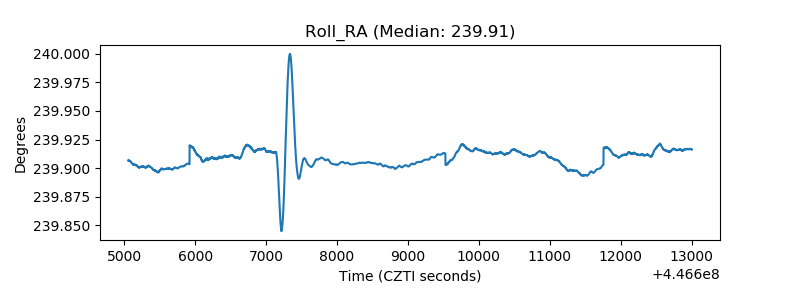 |
| Veto Counter | 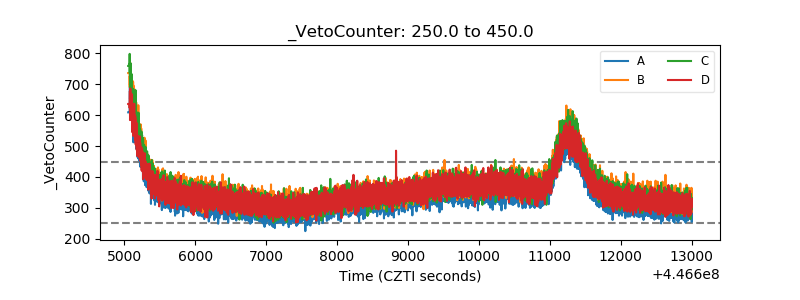 |