| Param | Original file | Final file |
|---|---|---|
| Filename | modeM0/AS1A13_054T01_9000006098_45497cztM0_level2.fits | modeM0/AS1A13_054T01_9000006098_45497cztM0_level2_quad_clean.evt |
| Size (bytes) | 622,843,200 | 151,617,600 |
| Size | 594.0 MB | 144.6 MB |
| Events in quadrant A | 7,681,260 | 992,243 |
| Events in quadrant B | 4,550,009 | 1,048,974 |
| Events in quadrant C | 4,338,315 | 998,761 |
| Events in quadrant D | 5,745,598 | 888,664 |
| Mode M0 | |||
|---|---|---|---|
| Quadrant | BADHDUFLAG | Total packets | Discarded packets |
| A | 0 | 30763 | 1432 |
| B | 0 | 20852 | 841 |
| C | 0 | 20608 | 786 |
| D | 0 | 25232 | 1762 |
| Mode SS | |||
|---|---|---|---|
| Quadrant | BADHDUFLAG | Total packets | Discarded packets |
| A | 0 | 201 | 5 |
| B | 0 | 202 | 6 |
| C | 0 | 203 | 9 |
| D | 0 | 201 | 10 |
| Mode M9 | |||
|---|---|---|---|
| Quadrant | BADHDUFLAG | Total packets | Discarded packets |
| A | 0 | 12 | 0 |
| B | 0 | 13 | 1 |
| C | 0 | 12 | 0 |
| D | 0 | 12 | 0 |
| Quadrant | Total seconds | Saturated seconds | Saturation percentage |
|---|---|---|---|
| A | 9517 | 216 | 2.269623% |
| B | 9586 | 129 | 1.345712% |
| C | 9589 | 73 | 0.761289% |
| D | 9495 | 230 | 2.422328% |
Noise dominated data is calculated using 1-second bins in cleaned event files. If a bin has >2000 counts, and if more than 50% of those come from <1% of pixels, then it is considered to be noise-dominated and hence unusable.
| Quadrant | # 1 sec bins | Bins with >0 counts | Bins with >2000 counts | High rate bins dominated by noise | Noise dominated (total time) | Noise dominated (detector-on time) | Marked lightcurve |
|---|---|---|---|---|---|---|---|
| A | 10961 | 9665 | 0 | 0 | 0.00% | 0.00% | 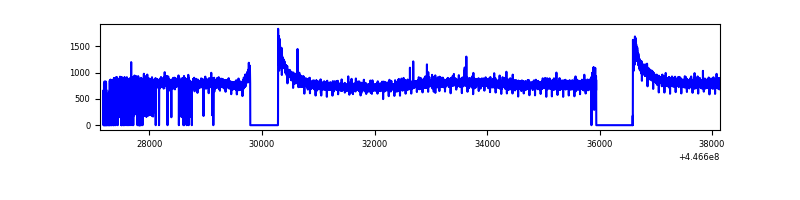 |
| B | 10964 | 9699 | 9 | 9 | 0.08% | 0.09% | 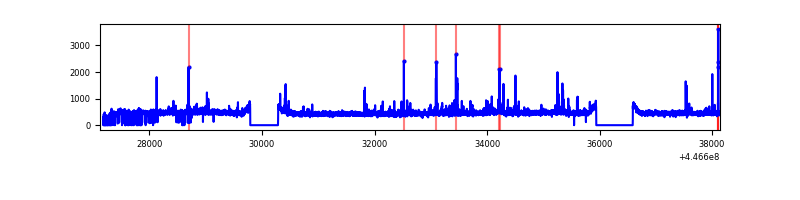 |
| C | 10951 | 9699 | 15 | 15 | 0.14% | 0.15% | 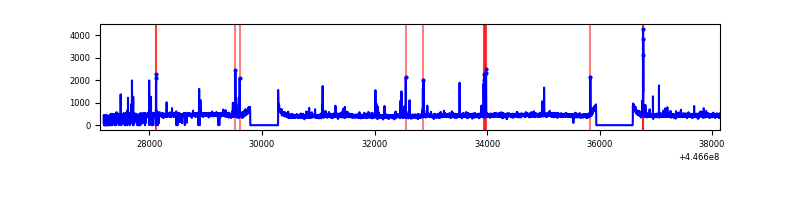 |
| D | 11019 | 9647 | 109 | 109 | 0.99% | 1.13% | 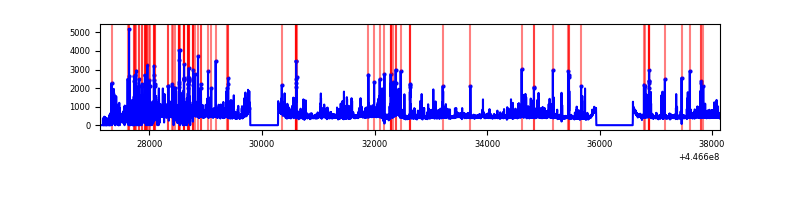 |
Top three noisy pixels from each quadrant. If the there are fewer than three noisy pixels in the level2.evt file, extra rows are filled as -1
| Pixel properties | Quadrant properties | ||||||
|---|---|---|---|---|---|---|---|
| Quadrant | DetID | PixID | Counts | Sigma | Mean | Median | Sigma |
| A | 10 | 83 | 3558187 | 16038.22 | 1065 | 1042 | 221.8 |
| A | 3 | 137 | 12567 | 51.96 | 1065 | 1042 | 221.8 |
| A | 13 | 254 | 10223 | 41.39 | 1065 | 1042 | 221.8 |
| B | 5 | 172 | 49396 | 226.32 | 1078 | 1045 | 213.6 |
| B | 12 | 18 | 42533 | 194.19 | 1078 | 1045 | 213.6 |
| B | 0 | 189 | 41311 | 188.47 | 1078 | 1045 | 213.6 |
| C | 14 | 254 | 141172 | 559.48 | 1061 | 1066 | 250.4 |
| C | 3 | 233 | 38143 | 148.06 | 1061 | 1066 | 250.4 |
| C | 2 | 14 | 12820 | 46.94 | 1061 | 1066 | 250.4 |
| D | 1 | 52 | 690903 | 2622.0 | 1041 | 1006 | 263.1 |
| D | 2 | 249 | 543504 | 2061.8 | 1041 | 1006 | 263.1 |
| D | 11 | 241 | 166522 | 629.05 | 1041 | 1006 | 263.1 |
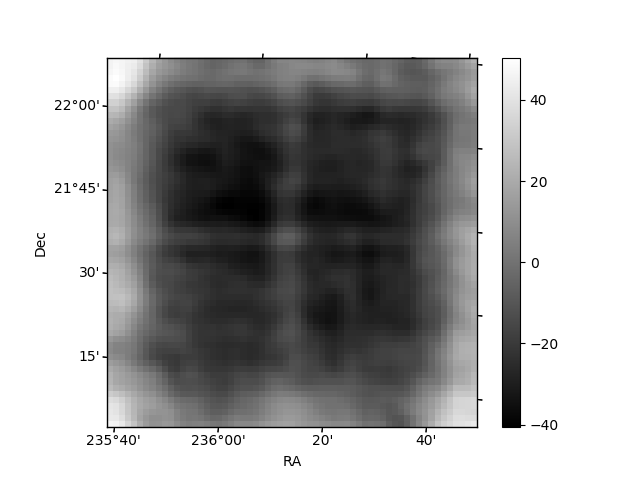
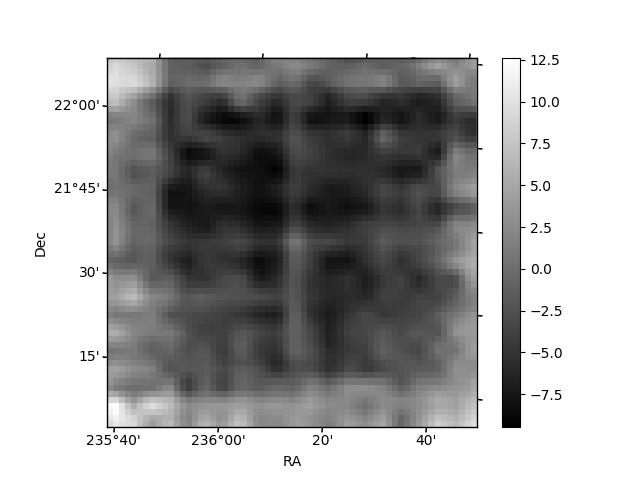
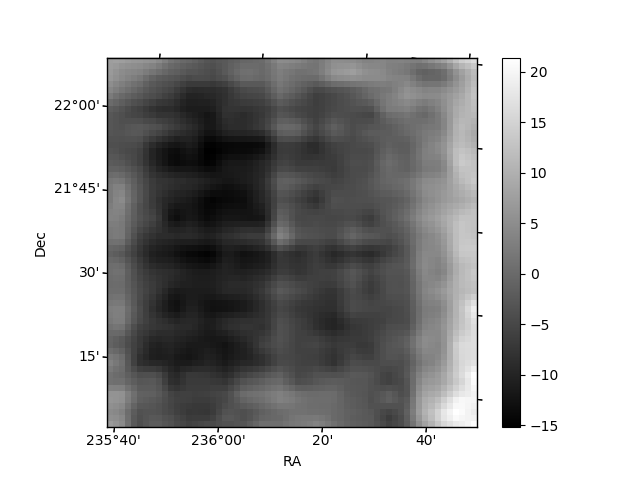
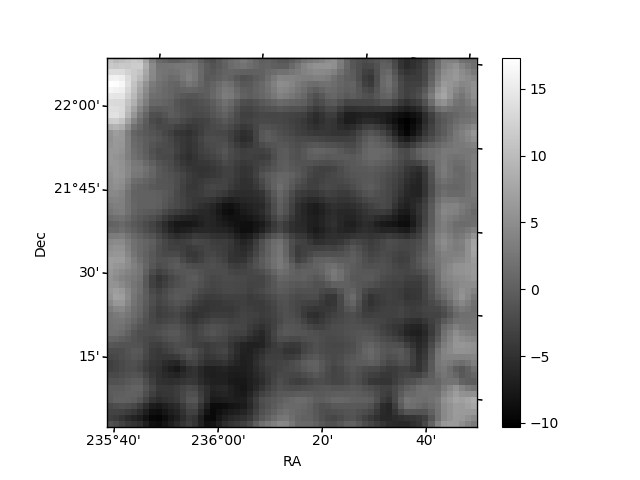
Histogram calculated using DETX and DETY for each event in the final _common_clean file
| Quadrant A | 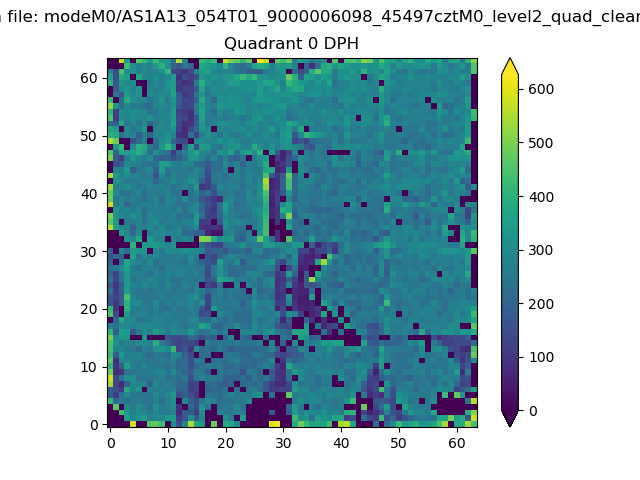 |
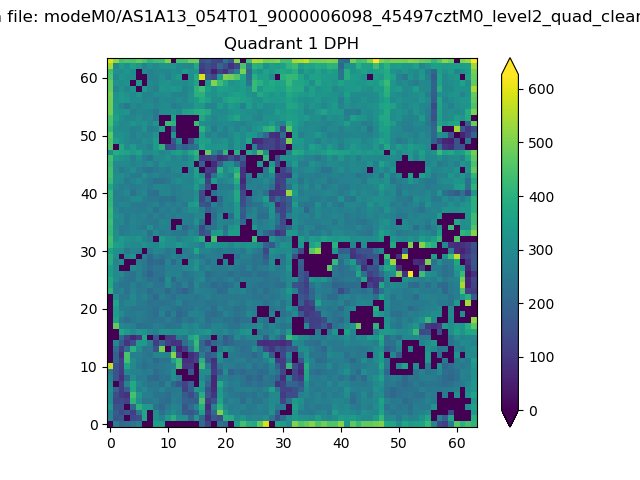 |
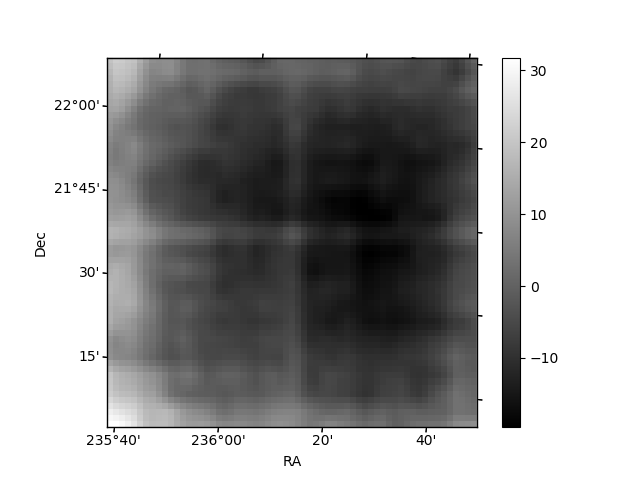
Quadrant B |
|---|---|---|---|
| Quadrant D | 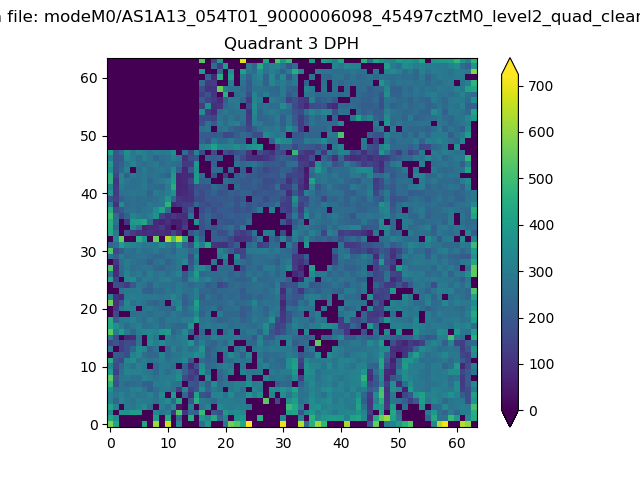 |
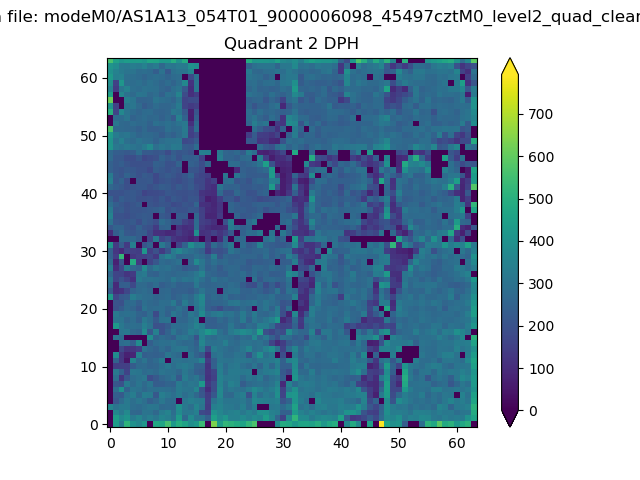 |
Quadrant C |
| Plot type | Count rate plots | Images |
|---|---|---|
| Comparison with Poisson distribution Blue bars denote a histogram of data divided into 1 sec bins. Red curve is a Poisson curve with rate = median count rate of data. |
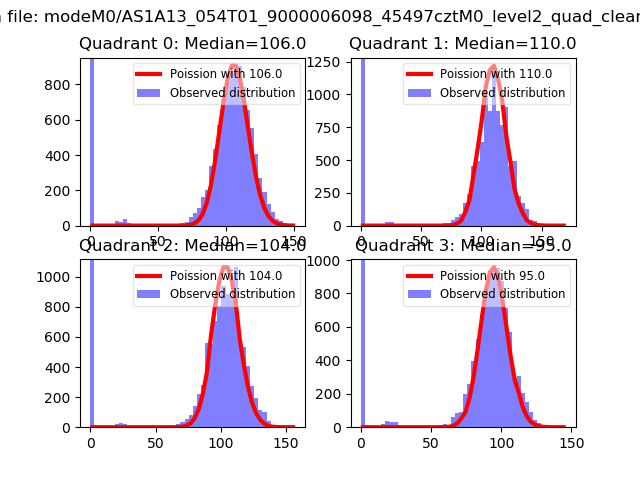 |
 |
| Quadrant-wise count rates Data is divided into 100 sec bins |
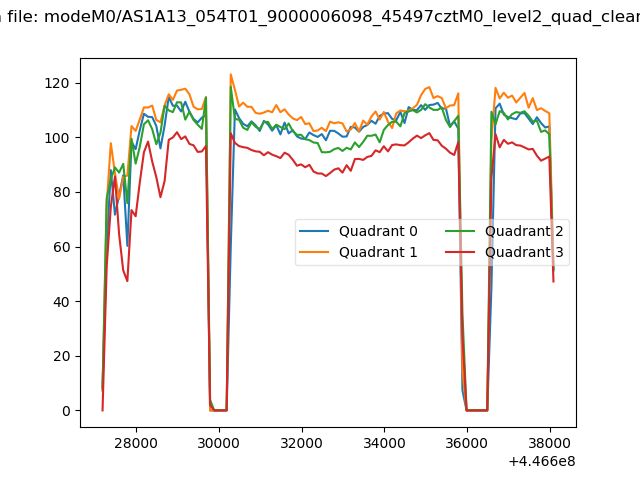 |
|
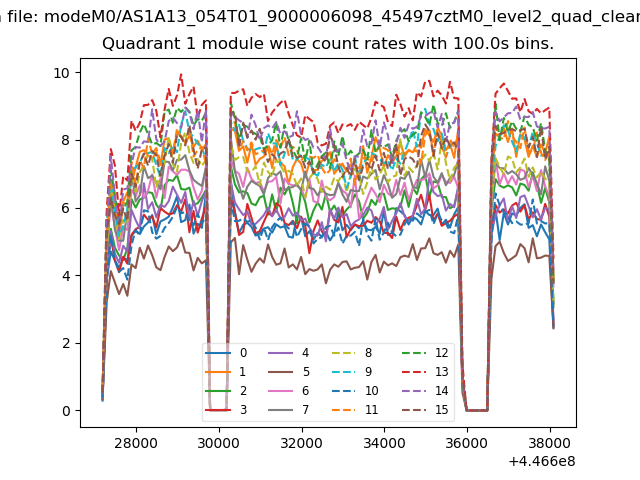
| Module-wise count rates for Quadrant A Data is divided into 100 sec bins |
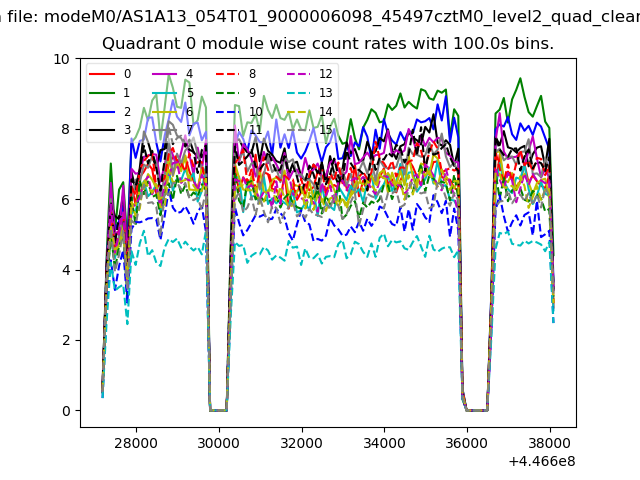 |
 |
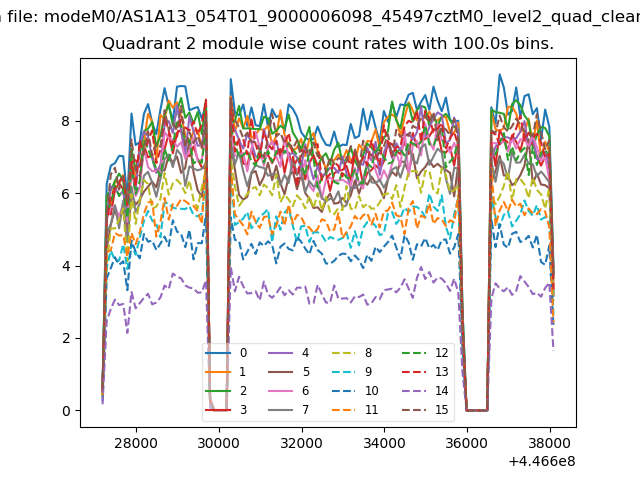
| Module-wise count rates for Quadrant B Data is divided into 100 sec bins |
 |
 |
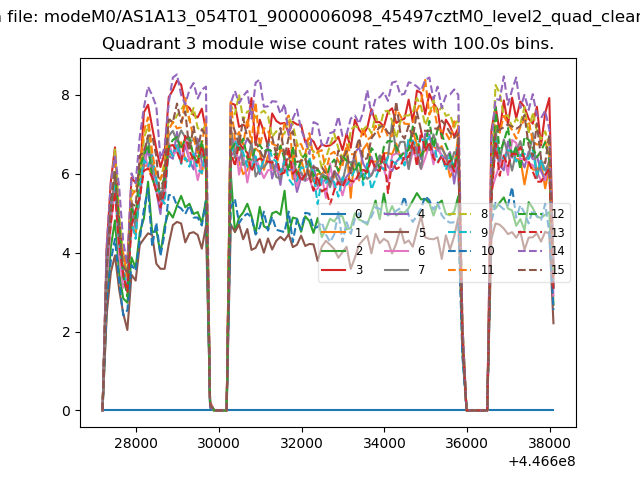
| Module-wise count rates for Quadrant C Data is divided into 100 sec bins |
 |
 |
| Module-wise count rates for Quadrant D Data is divided into 100 sec bins |
 |
 |
| Parameter | Plot |
|---|---|
| CZT HV Monitor | 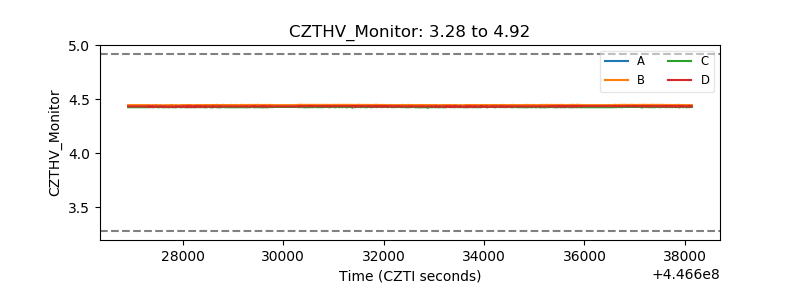 |
| D_VDD | 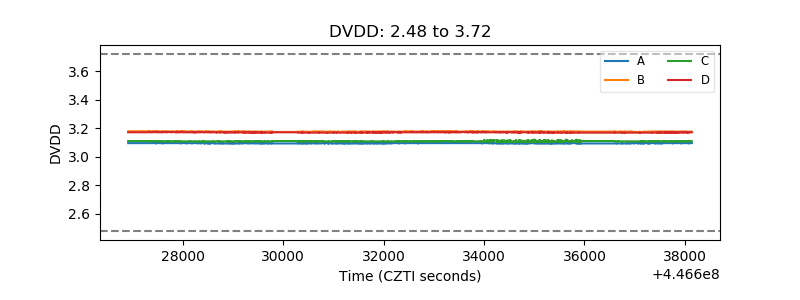 |
| Temperature 1 | 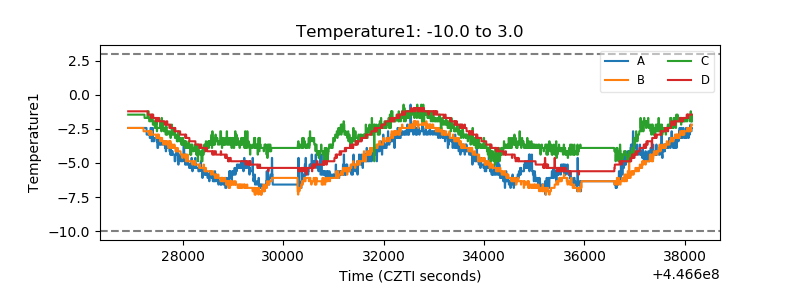 |
| Veto HV Monitor | 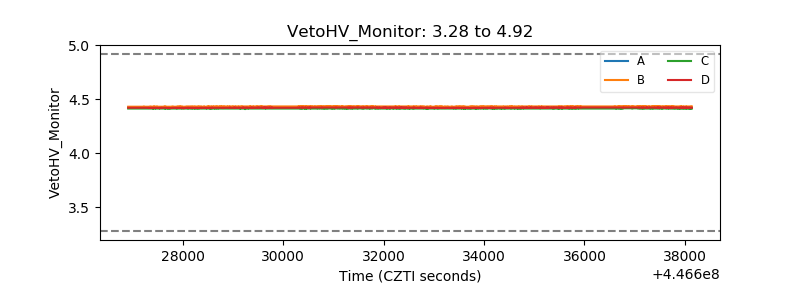 |
| Veto LLD | 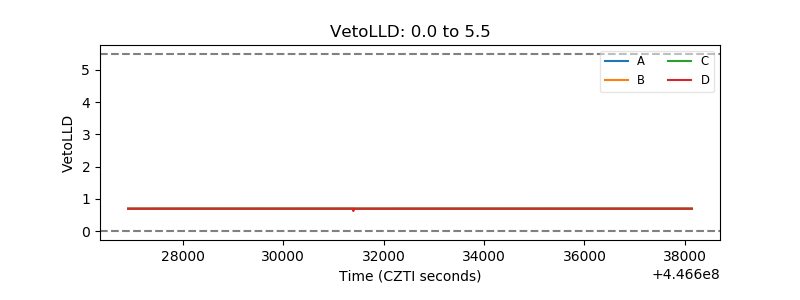 |
| Alpha Counter | 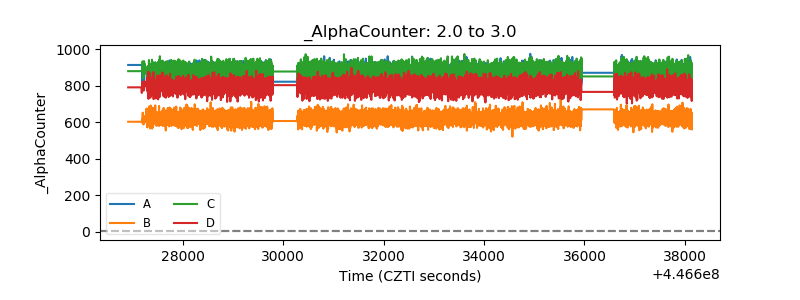 |
| _CPM_Rate | 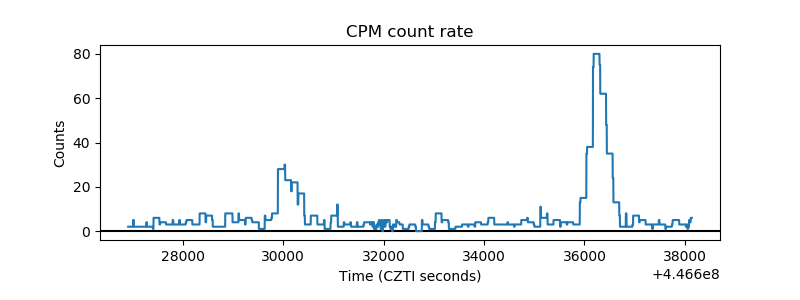 |
| CZT Counter | 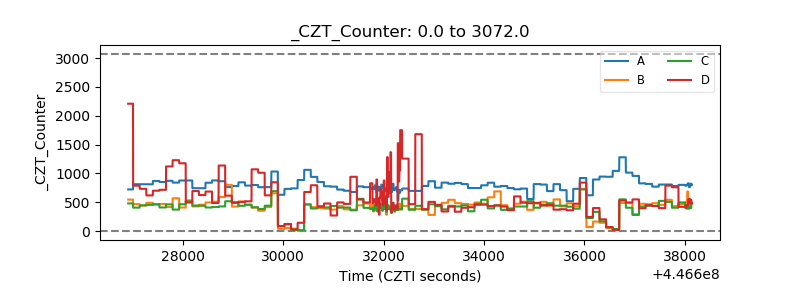 |
| +2.5 Volts monitor | 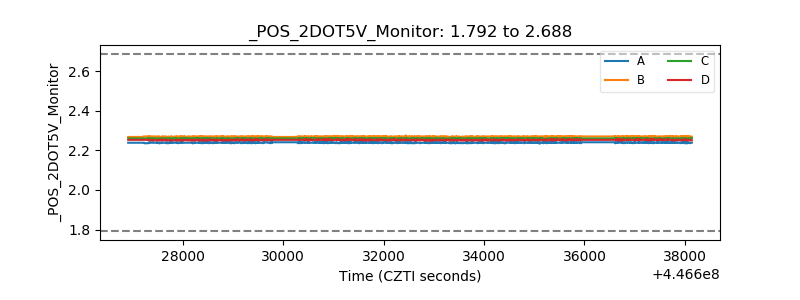 |
| +5 Volts monitor | 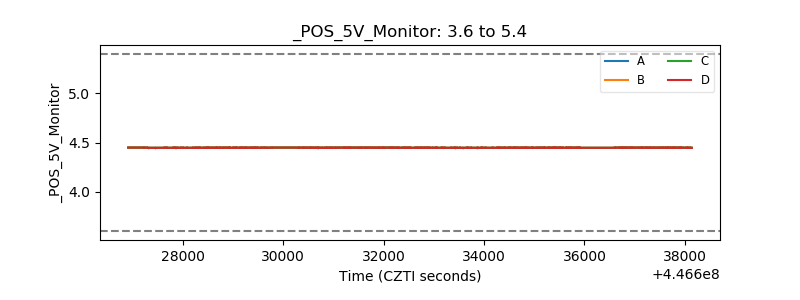 |
| _ROLL_ROT | 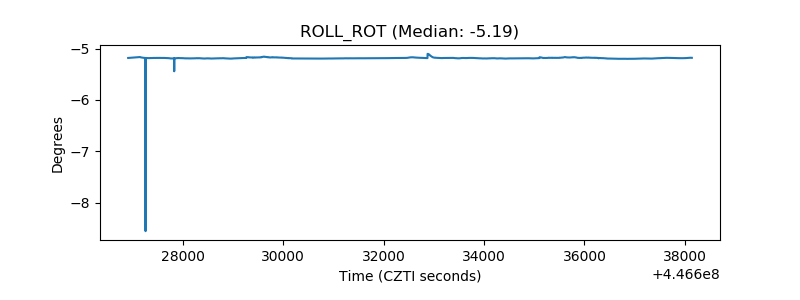 |
| _Roll_DEC | 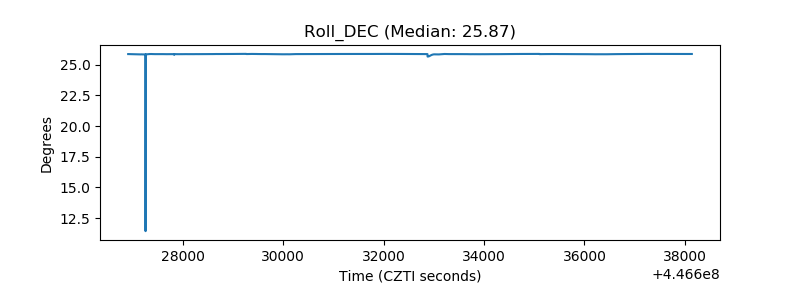 |
| _Roll_RA | 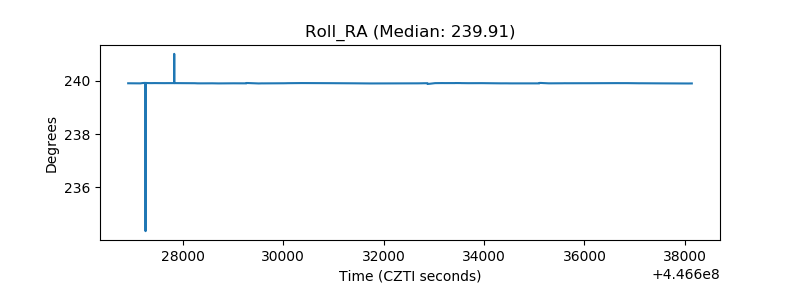 |
| Veto Counter | 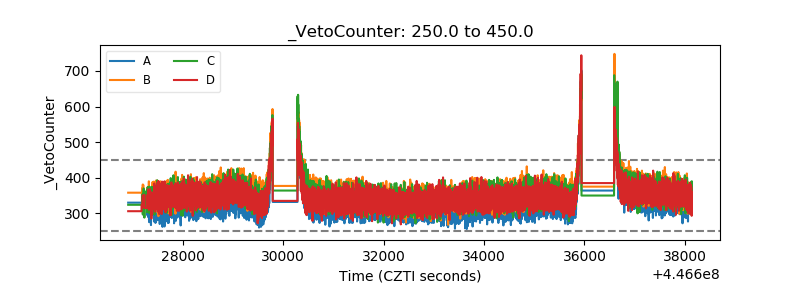 |