| Param | Original file | Final file |
|---|---|---|
| Filename | modeM0/AS1A13_054T01_9000006098_45498cztM0_level2.fits | modeM0/AS1A13_054T01_9000006098_45498cztM0_level2_quad_clean.evt |
| Size (bytes) | 453,320,640 | 109,512,000 |
| Size | 432.3 MB | 104.4 MB |
| Events in quadrant A | 5,746,194 | 723,758 |
| Events in quadrant B | 3,280,901 | 756,509 |
| Events in quadrant C | 3,145,684 | 714,264 |
| Events in quadrant D | 4,077,016 | 645,420 |
| Mode M0 | |||
|---|---|---|---|
| Quadrant | BADHDUFLAG | Total packets | Discarded packets |
| A | 0 | 21579 | 1 |
| B | 0 | 14293 | 1 |
| C | 0 | 14246 | 1 |
| D | 0 | 16407 | 1 |
| Mode SS | |||
|---|---|---|---|
| Quadrant | BADHDUFLAG | Total packets | Discarded packets |
| A | 0 | 138 | 0 |
| B | 0 | 138 | 0 |
| C | 0 | 138 | 0 |
| D | 0 | 138 | 0 |
| Mode M9 | |||
|---|---|---|---|
| Quadrant | BADHDUFLAG | Total packets | Discarded packets |
| A | 0 | 8 | 0 |
| B | 0 | 8 | 0 |
| C | 0 | 8 | 0 |
| D | 0 | 8 | 0 |
| Quadrant | Total seconds | Saturated seconds | Saturation percentage |
|---|---|---|---|
| A | 6831 | 172 | 2.517933% |
| B | 6831 | 114 | 1.668863% |
| C | 6831 | 93 | 1.361440% |
| D | 6831 | 180 | 2.635046% |
Noise dominated data is calculated using 1-second bins in cleaned event files. If a bin has >2000 counts, and if more than 50% of those come from <1% of pixels, then it is considered to be noise-dominated and hence unusable.
| Quadrant | # 1 sec bins | Bins with >0 counts | Bins with >2000 counts | High rate bins dominated by noise | Noise dominated (total time) | Noise dominated (detector-on time) | Marked lightcurve |
|---|---|---|---|---|---|---|---|
| A | 7651 | 6832 | 16 | 16 | 0.21% | 0.23% | 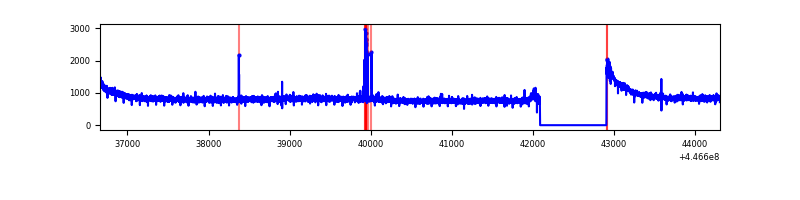 |
| B | 7651 | 6832 | 17 | 17 | 0.22% | 0.25% | 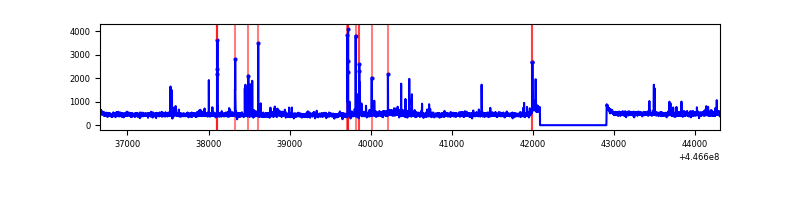 |
| C | 7651 | 6832 | 20 | 20 | 0.26% | 0.29% | 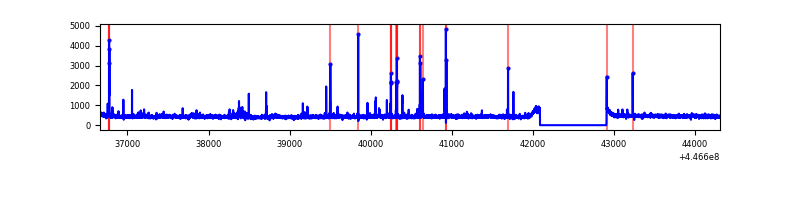 |
| D | 7651 | 6832 | 83 | 83 | 1.08% | 1.21% | 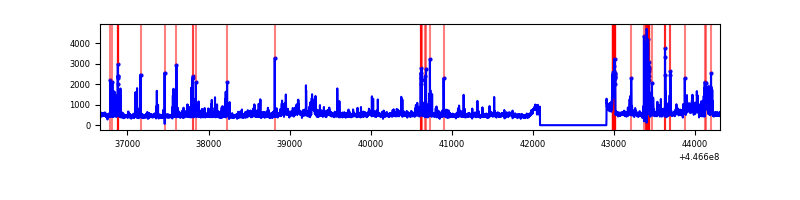 |
Top three noisy pixels from each quadrant. If the there are fewer than three noisy pixels in the level2.evt file, extra rows are filled as -1
| Pixel properties | Quadrant properties | ||||||
|---|---|---|---|---|---|---|---|
| Quadrant | DetID | PixID | Counts | Sigma | Mean | Median | Sigma |
| A | 10 | 83 | 2714861 | 16959.25 | 772 | 754 | 160.0 |
| A | 2 | 79 | 42192 | 258.93 | 772 | 754 | 160.0 |
| A | 3 | 137 | 9004 | 51.55 | 772 | 754 | 160.0 |
| B | 10 | 14 | 54157 | 346.31 | 770 | 748 | 154.2 |
| B | 5 | 172 | 52450 | 335.24 | 770 | 748 | 154.2 |
| B | 15 | 35 | 32182 | 203.82 | 770 | 748 | 154.2 |
| C | 14 | 254 | 150983 | 840.63 | 757 | 759 | 178.7 |
| C | 3 | 233 | 30274 | 165.16 | 757 | 759 | 178.7 |
| C | 1 | 3 | 7481 | 37.62 | 757 | 759 | 178.7 |
| D | 11 | 241 | 403855 | 2119.79 | 753 | 728 | 190.2 |
| D | 2 | 249 | 191238 | 1001.77 | 753 | 728 | 190.2 |
| D | 1 | 52 | 169865 | 889.39 | 753 | 728 | 190.2 |
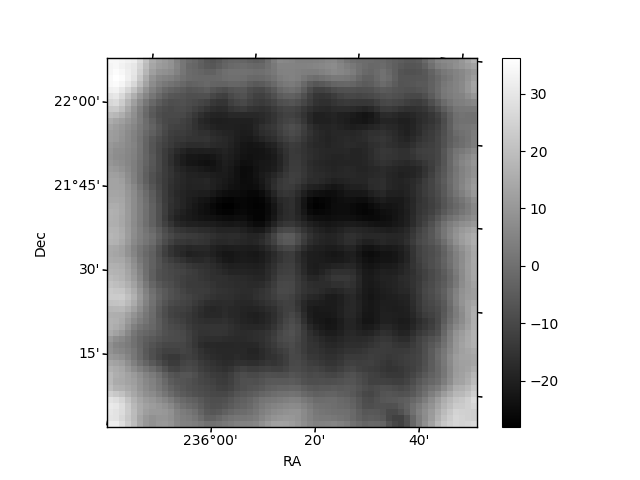
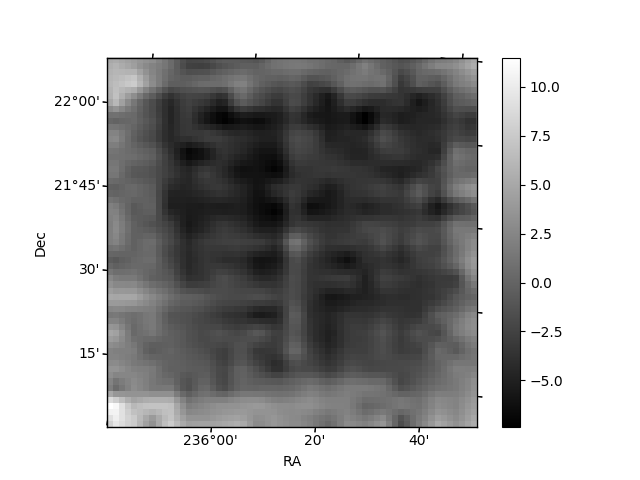
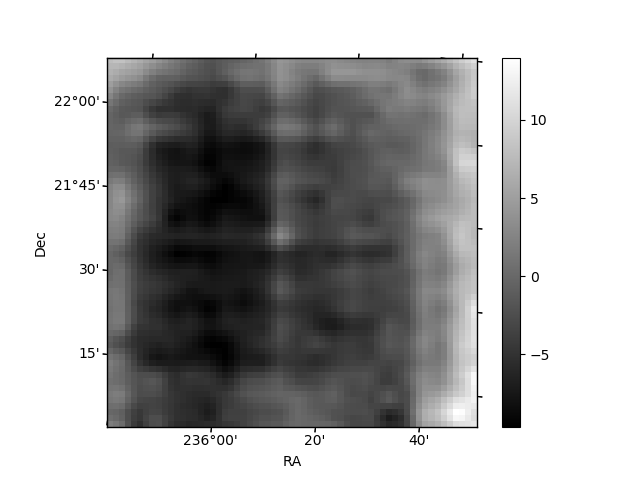
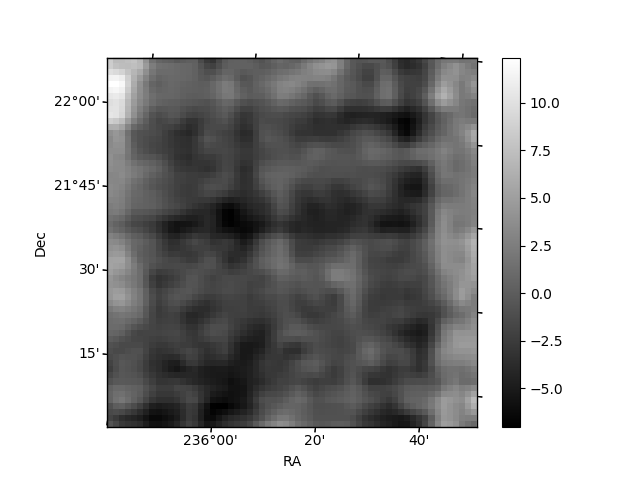
Histogram calculated using DETX and DETY for each event in the final _common_clean file
| Quadrant A | 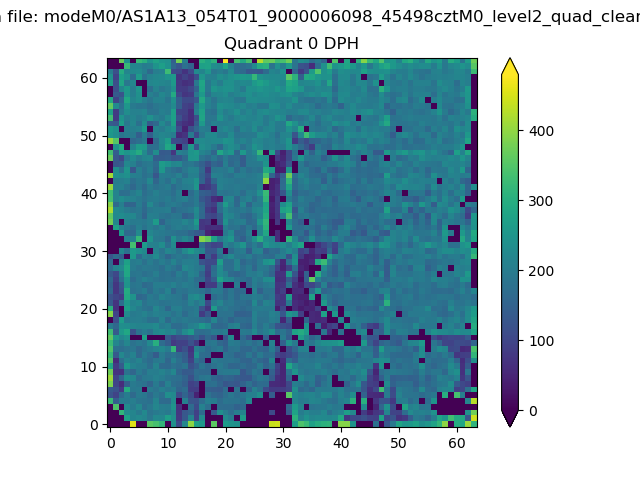 |
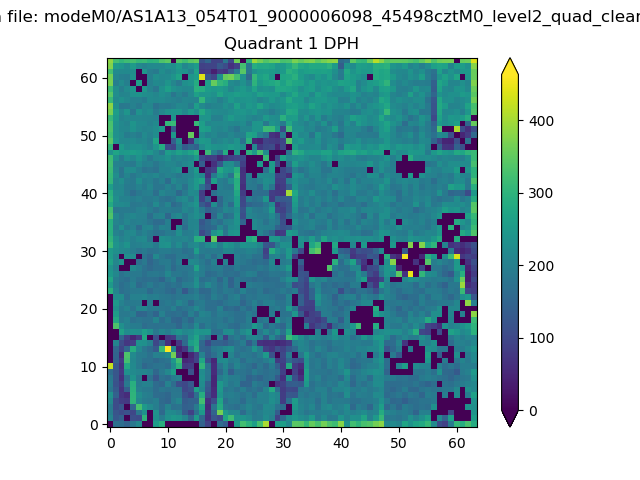 |
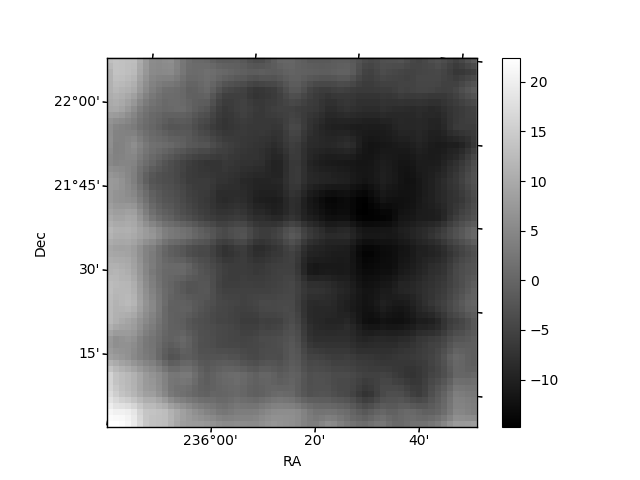
Quadrant B |
|---|---|---|---|
| Quadrant D | 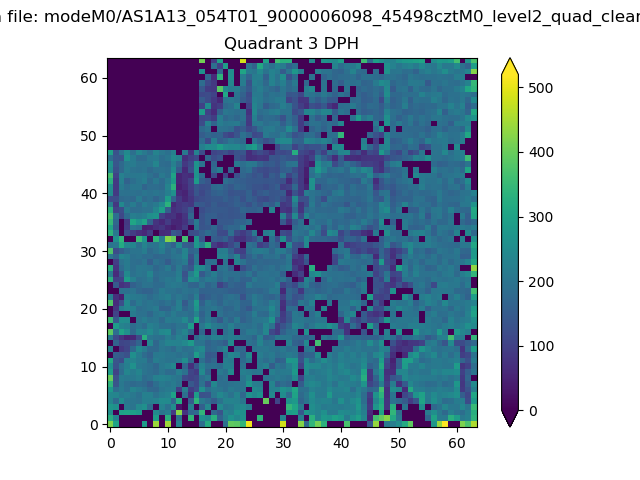 |
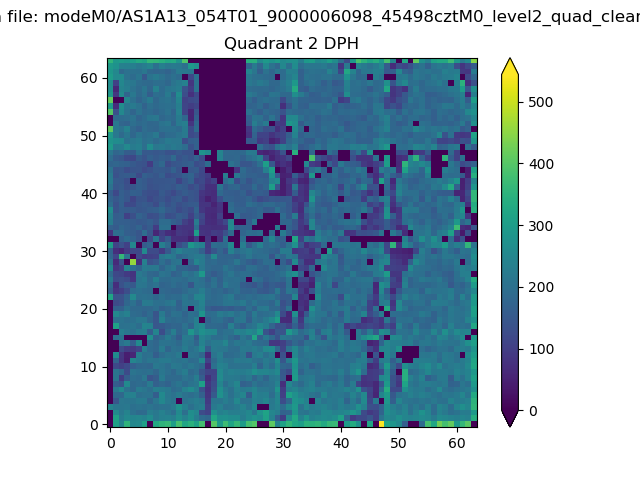 |
Quadrant C |
| Plot type | Count rate plots | Images |
|---|---|---|
| Comparison with Poisson distribution Blue bars denote a histogram of data divided into 1 sec bins. Red curve is a Poisson curve with rate = median count rate of data. |
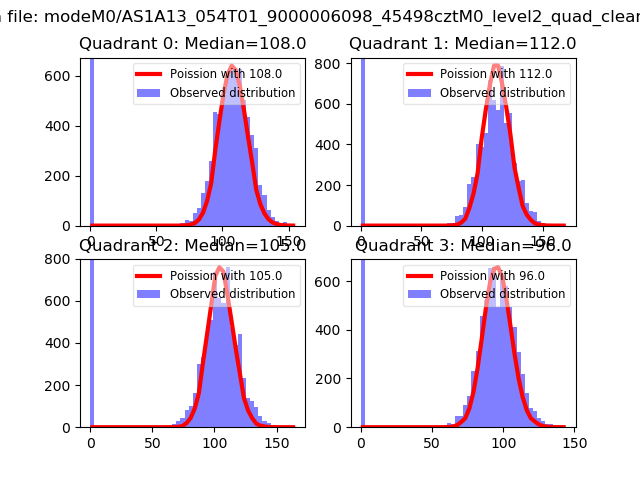 |
 |
| Quadrant-wise count rates Data is divided into 100 sec bins |
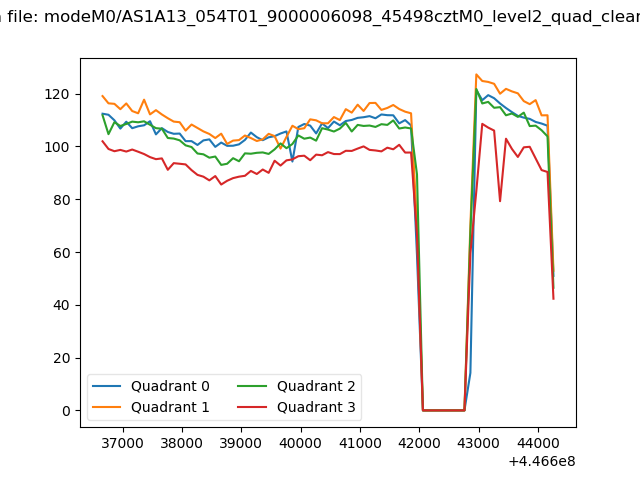 |
|
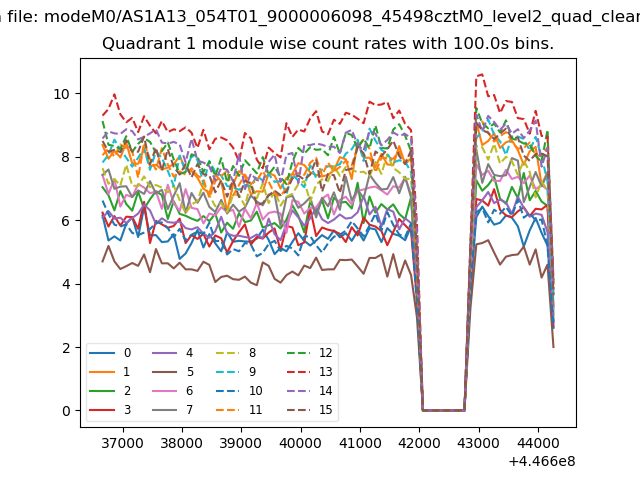
| Module-wise count rates for Quadrant A Data is divided into 100 sec bins |
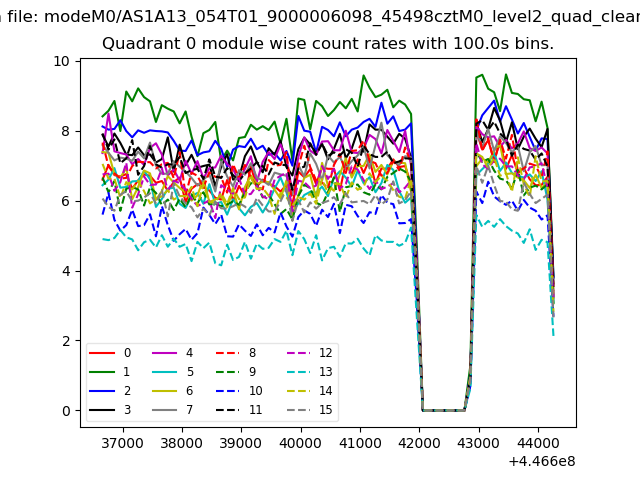 |
 |
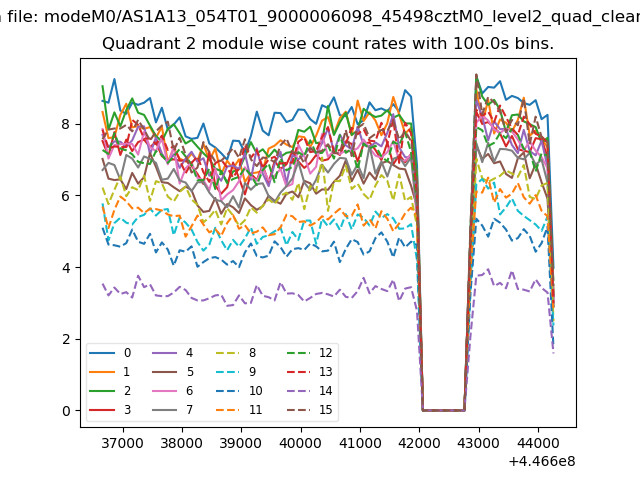
| Module-wise count rates for Quadrant B Data is divided into 100 sec bins |
 |
 |
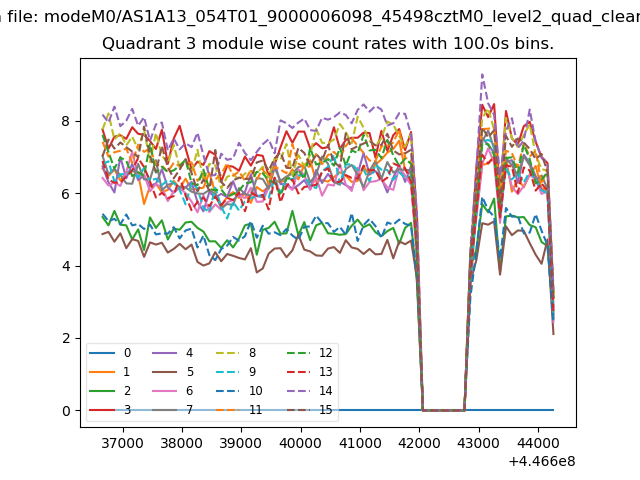
| Module-wise count rates for Quadrant C Data is divided into 100 sec bins |
 |
 |
| Module-wise count rates for Quadrant D Data is divided into 100 sec bins |
 |
 |
| Parameter | Plot |
|---|---|
| CZT HV Monitor | 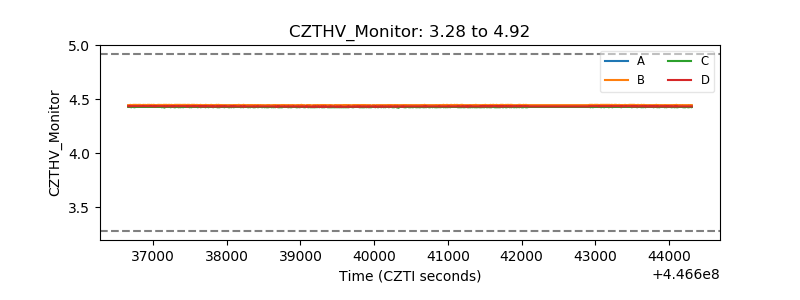 |
| D_VDD | 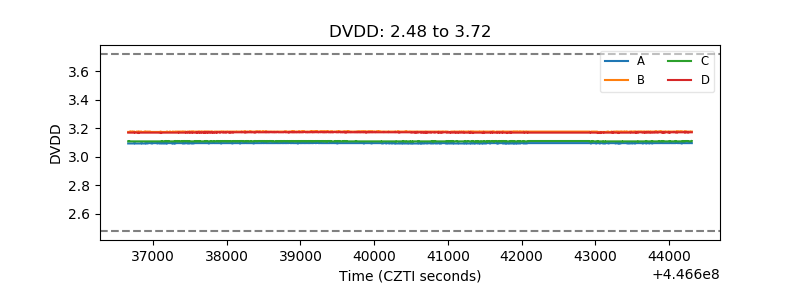 |
| Temperature 1 | 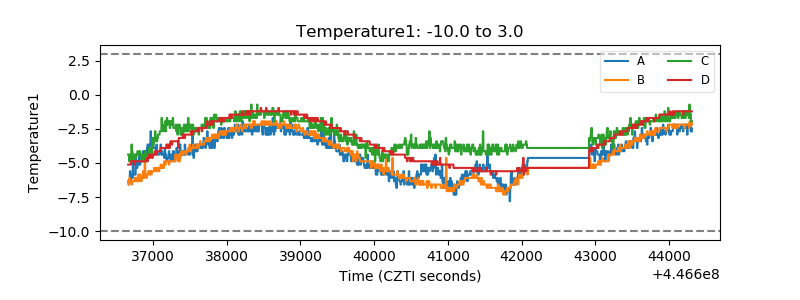 |
| Veto HV Monitor | 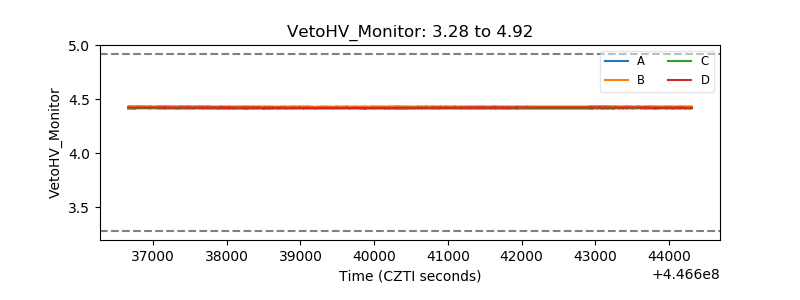 |
| Veto LLD | 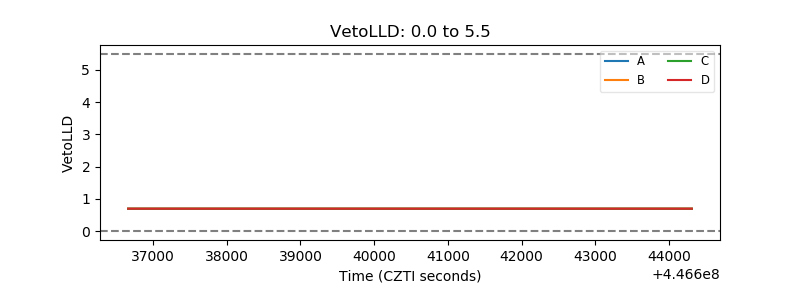 |
| Alpha Counter | 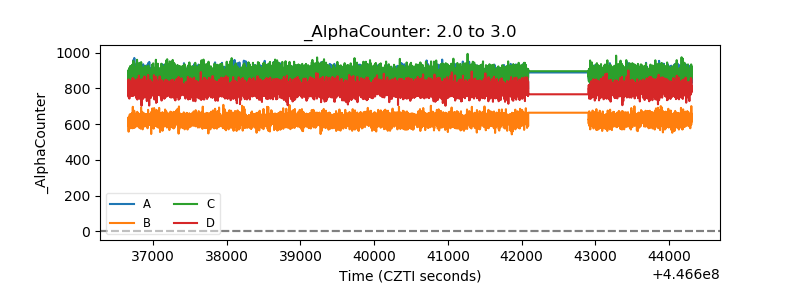 |
| _CPM_Rate | 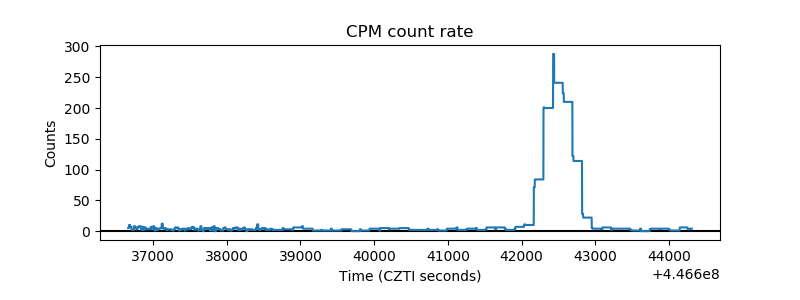 |
| CZT Counter | 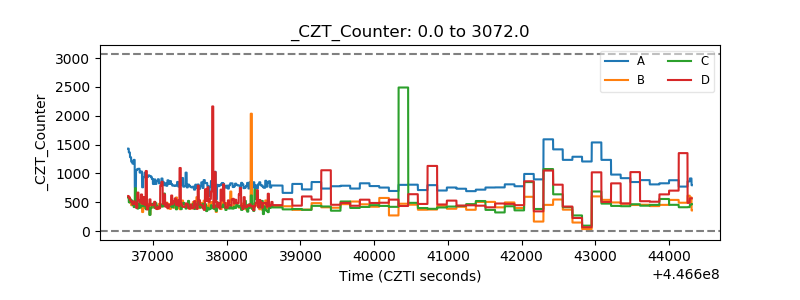 |
| +2.5 Volts monitor | 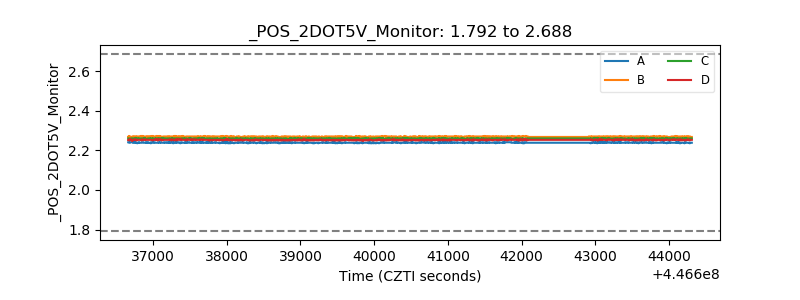 |
| +5 Volts monitor | 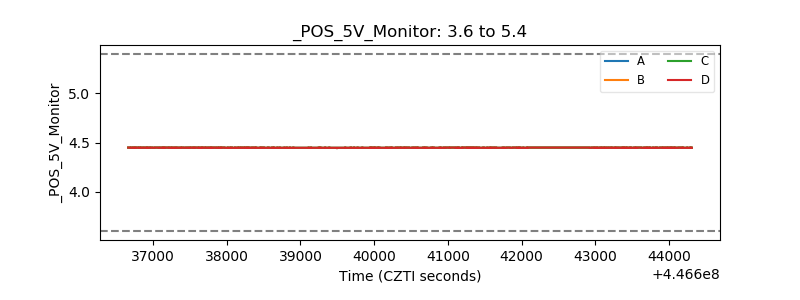 |
| _ROLL_ROT | 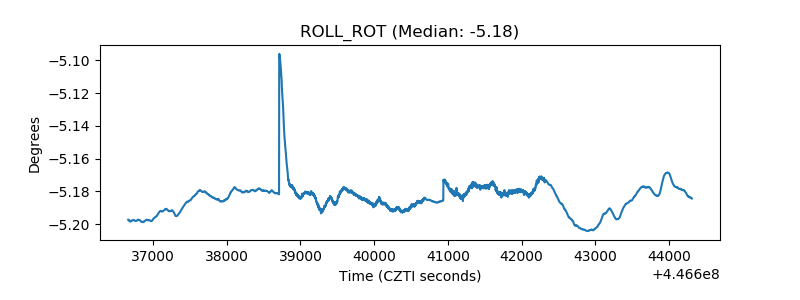 |
| _Roll_DEC | 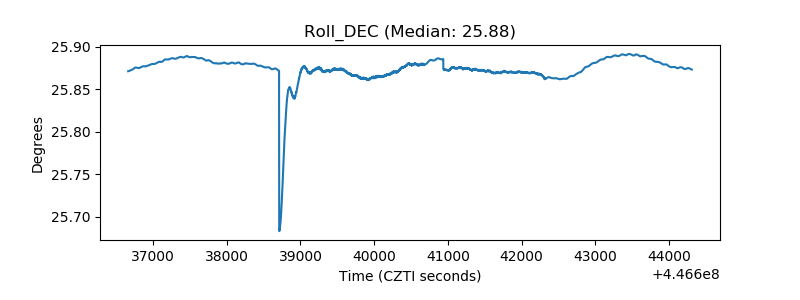 |
| _Roll_RA | 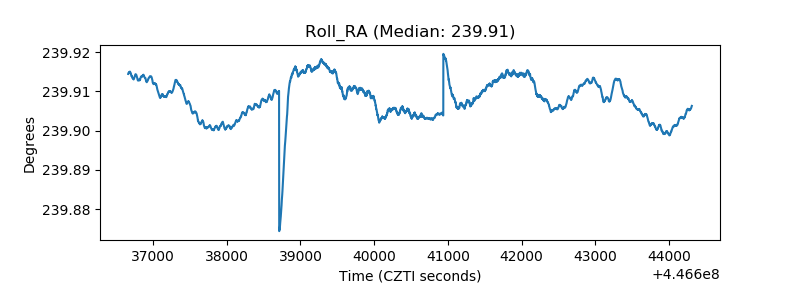 |
| Veto Counter | 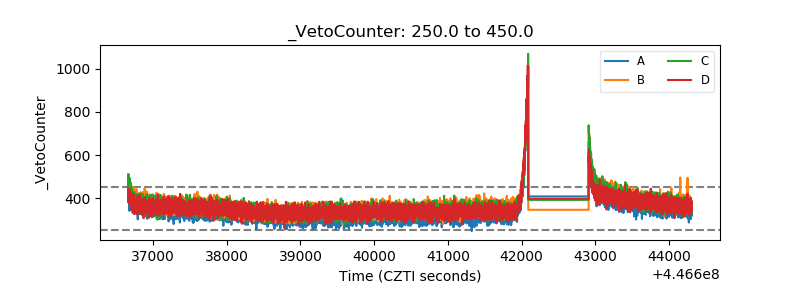 |